Darden Capital Management: Monticello Fund Portfolio Analysis
VerifiedAdded on 2022/08/14
|14
|3432
|21
Case Study
AI Summary
This case study examines the Monticello Fund, a student-managed portfolio within the Darden Capital Management program. It analyzes the portfolio allocation decisions made by the fund managers, focusing on the selection of stocks and the rationale behind these choices. The report delves into the details of the fund, including its investment strategy, past performance, and the team's objectives. It evaluates the risk metrics associated with the chosen stocks, including beta, and the application of the Capital Asset Pricing Model (CAPM) to estimate expected returns. The analysis explores diversification strategies and the efficiency of financial markets, providing insights into how the fund aims to generate alpha, or excess returns, compared to its benchmark. The study assesses the fundamentals of various companies, including Micron Technology, Boise Cascade, New York Times, Placer Dome, and Mylan Labs, to determine their suitability for the portfolio. The correlation between different stocks is also examined to understand the benefits of diversification in reducing portfolio risk. The report offers a comprehensive overview of the portfolio's construction, risk management, and the team's approach to achieving investment goals.

Running head: PORTFOLIO ANALYSIS
Portfolio Analysis
Name of the Student:
Name of the University:
Author Note:
Portfolio Analysis
Name of the Student:
Name of the University:
Author Note:
Paraphrase This Document
Need a fresh take? Get an instant paraphrase of this document with our AI Paraphraser

1PORTFOLIO ANALYSIS
Table of Contents
Introduction:...............................................................................................................................2
Discussion:.................................................................................................................................2
Details of the Fund:................................................................................................................2
Portfolio Allocation Decision:...............................................................................................3
Reason for holding all the stocks:..........................................................................................6
CAPM:...................................................................................................................................8
Efficiency of the markets:......................................................................................................8
Conclusion:..............................................................................................................................11
References:...............................................................................................................................12
2PORTFOLIO ANALYSIS
Introduction:
Portfolio management is a process which requires analytical skills and observation
skills of the portfolio manager. A portfolio is constructed in two dimensions which are to
manage it actively and another is to manage it passively. The passive management of
portfolio implies to mimic the benchmark index with the level of return and risk, thus does
not require the portfolio manager’s skill. However active management involves the use of
portfolio manager skills to beat the benchmark and generate alpha or excess returns. This
requires the portfolio manager to apply strategic asset allocation along with tactical asset
allocation of the portfolio, with a higher frequency of churning the portfolio (Chandra 2017).
Thus, this report aims to provide the portfolio allocation decision of the Monticello
fund which is actively managed to generate alpha. Also the various measures of return and
risk from the portfolio is analysed and calculated to analyse the effectiveness of asset
allocation. The importance of using Diversification and the efficiency of the markets is
analysed in the report along with the use of CAPM in calculating the expected return of the
stocks which comprise in the portfolio (Antchak, Ziakas and Getz 2019).
Discussion:
Details of the Fund:
The fund Monticello fund was a part of the Darden capital management team which
comprised of another two funds. The funds were actively managed by a small group of
students to provide them experience of actively managing a portfolio and providing them the
relevant experience in regards to the practical application of the theoretical knowledge. The
old team which had previously managed the fund had generated impressive returns of 42.9%
while the index which is the S&P 500 had generated 35.1% in the same period. Thus in
⊘ This is a preview!⊘
Do you want full access?
Subscribe today to unlock all pages.
Trusted by 1+ million students worldwide
3PORTFOLIO ANALYSIS
absolute terms the return of 42.9% is quite impressive performance by the team, but in
relative terms the team has been able to generate only 7.8%. Thus the aim of the new team is
to use the appropriate strategic asset allocation to generate impressive returns greater than the
benchmark and provide alpha returns to the fund (Nawrocka 2018).
Portfolio Allocation Decision:
The stock selection is an important aspect for the portfolio allocation decision. The
fund is focused in providing abnormal returns to the capital managers, hence the primary
weightage is given to the equity selection, while the rest of the weights is invested in bonds.
Hence the style of the portfolio is to invest in aggressive portfolio which is actively managed.
The portfolio which was managed by the predecessor was using the combination of Large
Cap stocks along with bonds. The large cap stocks which were invested in the past were from
different industries and sectors, hence the diversification of the portfolio was an objective
with weightings ranging from 2.1% to 5.6% in the portfolio for the stocks (Alford,
Luchtenberg and Reddie 2018).
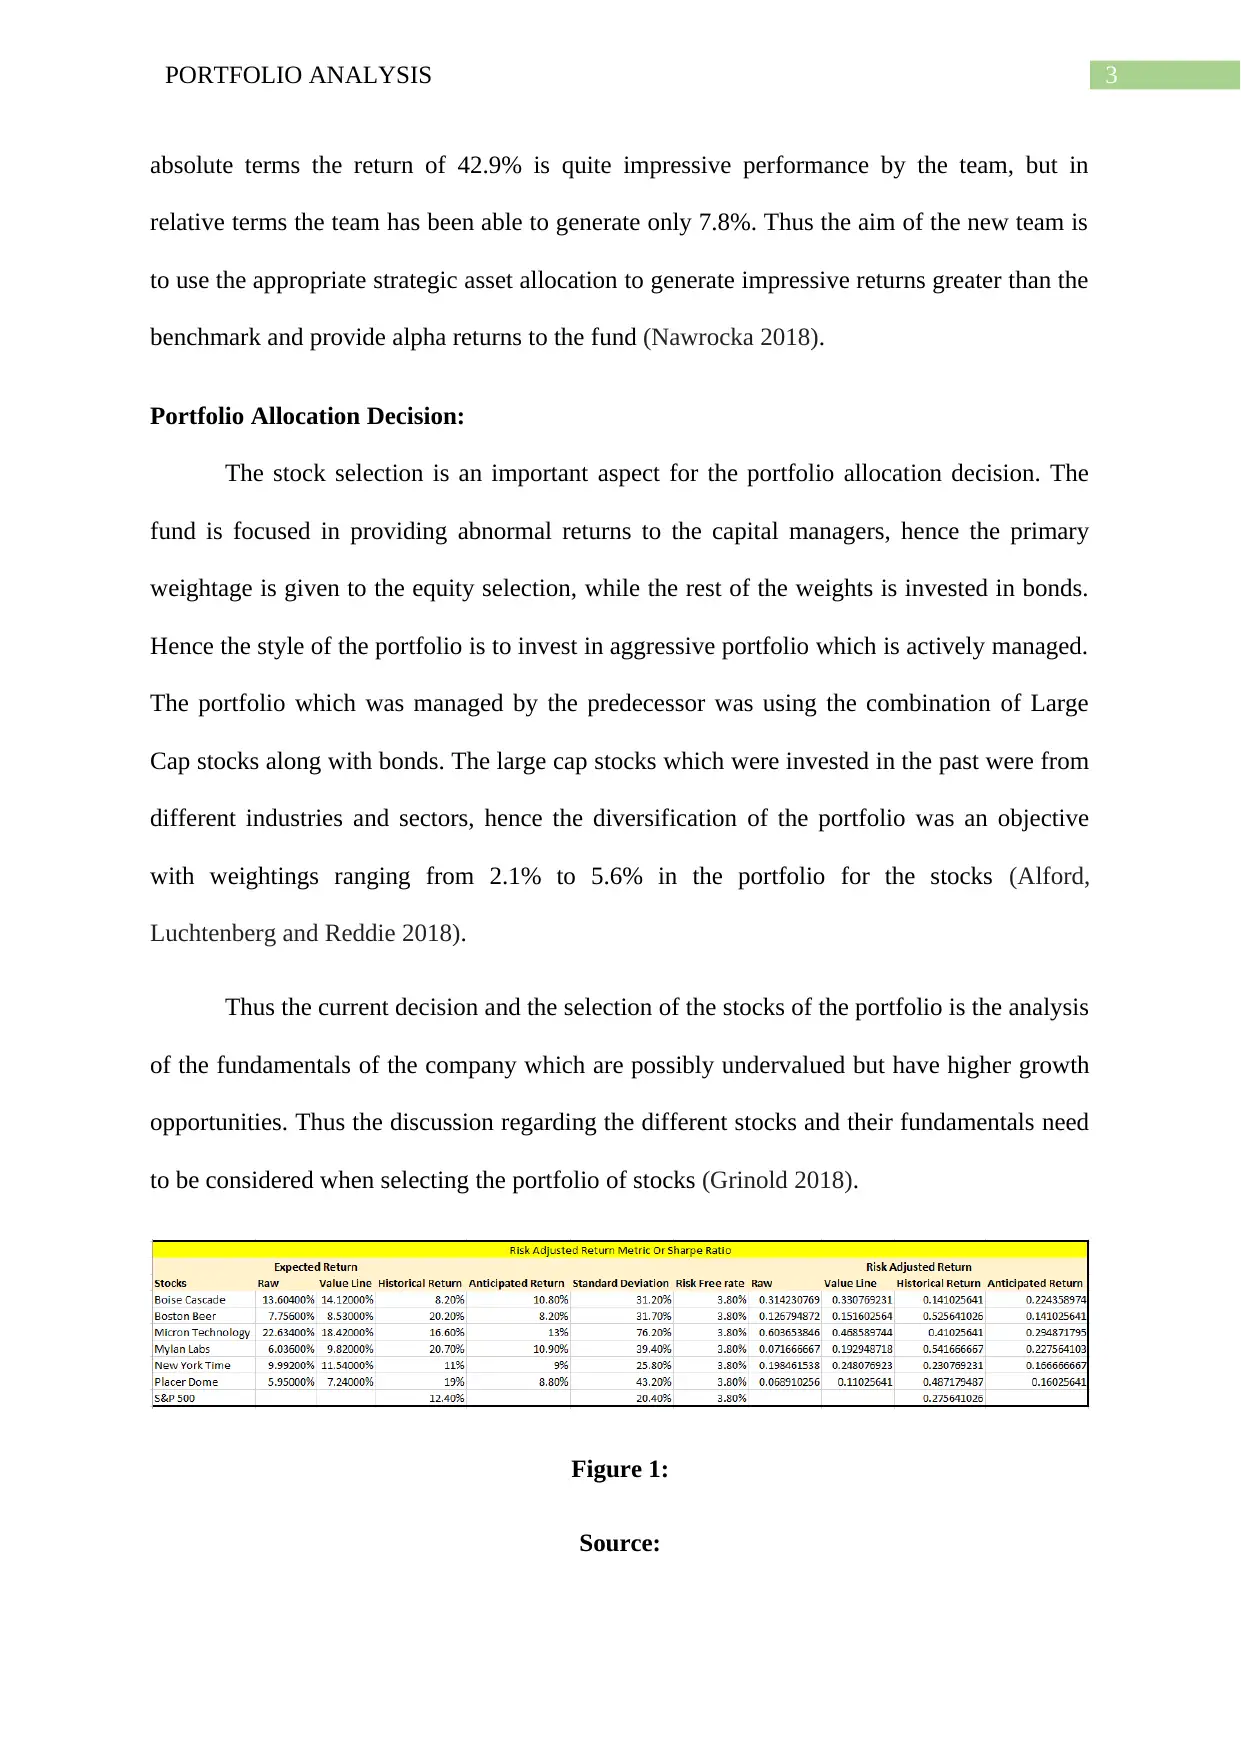
Thus the current decision and the selection of the stocks of the portfolio is the analysis
of the fundamentals of the company which are possibly undervalued but have higher growth
opportunities. Thus the discussion regarding the different stocks and their fundamentals need
to be considered when selecting the portfolio of stocks (Grinold 2018).
Figure 1:
Source:
absolute terms the return of 42.9% is quite impressive performance by the team, but in
relative terms the team has been able to generate only 7.8%. Thus the aim of the new team is
to use the appropriate strategic asset allocation to generate impressive returns greater than the
benchmark and provide alpha returns to the fund (Nawrocka 2018).
Portfolio Allocation Decision:
The stock selection is an important aspect for the portfolio allocation decision. The
fund is focused in providing abnormal returns to the capital managers, hence the primary
weightage is given to the equity selection, while the rest of the weights is invested in bonds.
Hence the style of the portfolio is to invest in aggressive portfolio which is actively managed.
The portfolio which was managed by the predecessor was using the combination of Large
Cap stocks along with bonds. The large cap stocks which were invested in the past were from
different industries and sectors, hence the diversification of the portfolio was an objective
with weightings ranging from 2.1% to 5.6% in the portfolio for the stocks (Alford,
Luchtenberg and Reddie 2018).
Thus the current decision and the selection of the stocks of the portfolio is the analysis
of the fundamentals of the company which are possibly undervalued but have higher growth
opportunities. Thus the discussion regarding the different stocks and their fundamentals need
to be considered when selecting the portfolio of stocks (Grinold 2018).
Figure 1:
Source:
Paraphrase This Document
Need a fresh take? Get an instant paraphrase of this document with our AI Paraphraser
4PORTFOLIO ANALYSIS
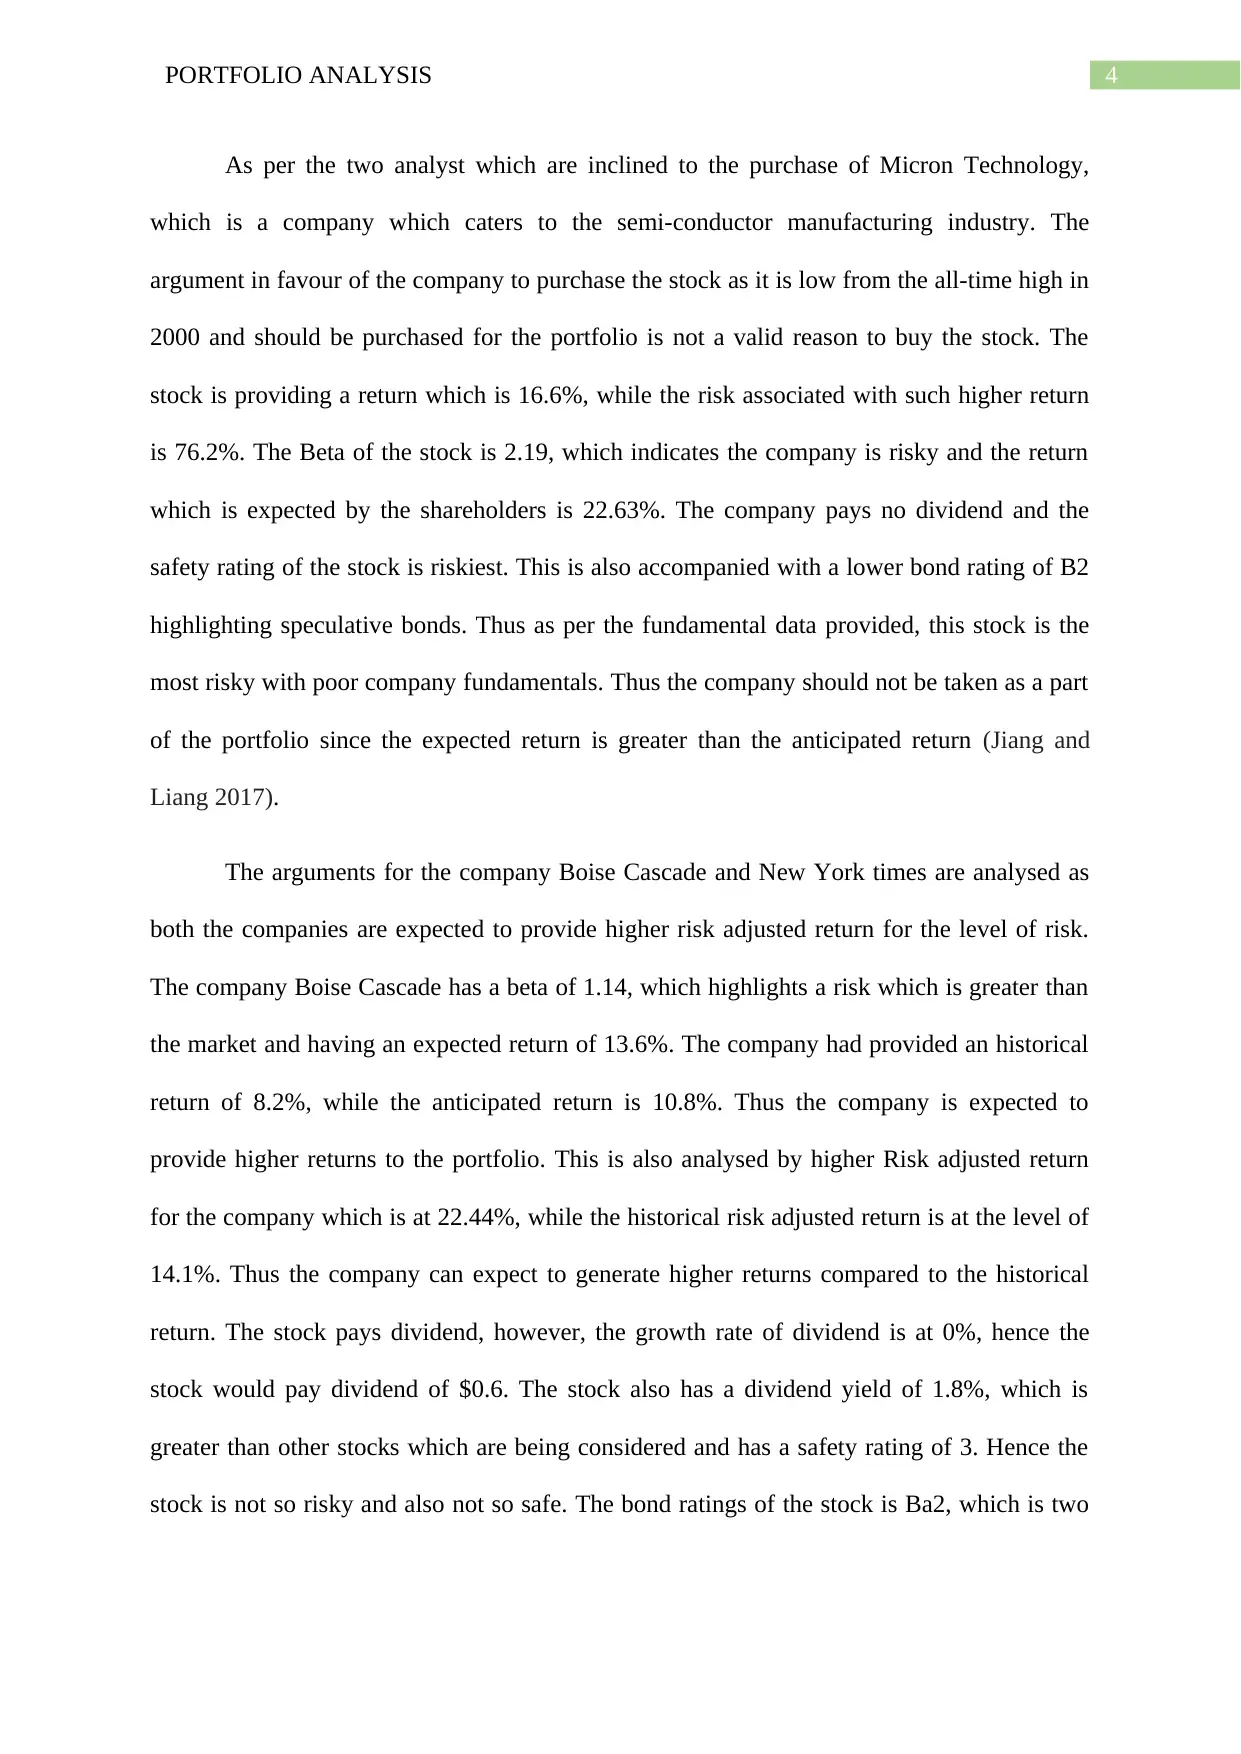
As per the two analyst which are inclined to the purchase of Micron Technology,
which is a company which caters to the semi-conductor manufacturing industry. The
argument in favour of the company to purchase the stock as it is low from the all-time high in
2000 and should be purchased for the portfolio is not a valid reason to buy the stock. The
stock is providing a return which is 16.6%, while the risk associated with such higher return
is 76.2%. The Beta of the stock is 2.19, which indicates the company is risky and the return
which is expected by the shareholders is 22.63%. The company pays no dividend and the
safety rating of the stock is riskiest. This is also accompanied with a lower bond rating of B2
highlighting speculative bonds. Thus as per the fundamental data provided, this stock is the
most risky with poor company fundamentals. Thus the company should not be taken as a part
of the portfolio since the expected return is greater than the anticipated return (Jiang and
Liang 2017).
The arguments for the company Boise Cascade and New York times are analysed as
both the companies are expected to provide higher risk adjusted return for the level of risk.
The company Boise Cascade has a beta of 1.14, which highlights a risk which is greater than
the market and having an expected return of 13.6%. The company had provided an historical
return of 8.2%, while the anticipated return is 10.8%. Thus the company is expected to
provide higher returns to the portfolio. This is also analysed by higher Risk adjusted return
for the company which is at 22.44%, while the historical risk adjusted return is at the level of
14.1%. Thus the company can expect to generate higher returns compared to the historical
return. The stock pays dividend, however, the growth rate of dividend is at 0%, hence the
stock would pay dividend of $0.6. The stock also has a dividend yield of 1.8%, which is
greater than other stocks which are being considered and has a safety rating of 3. Hence the
stock is not so risky and also not so safe. The bond ratings of the stock is Ba2, which is two
5PORTFOLIO ANALYSIS
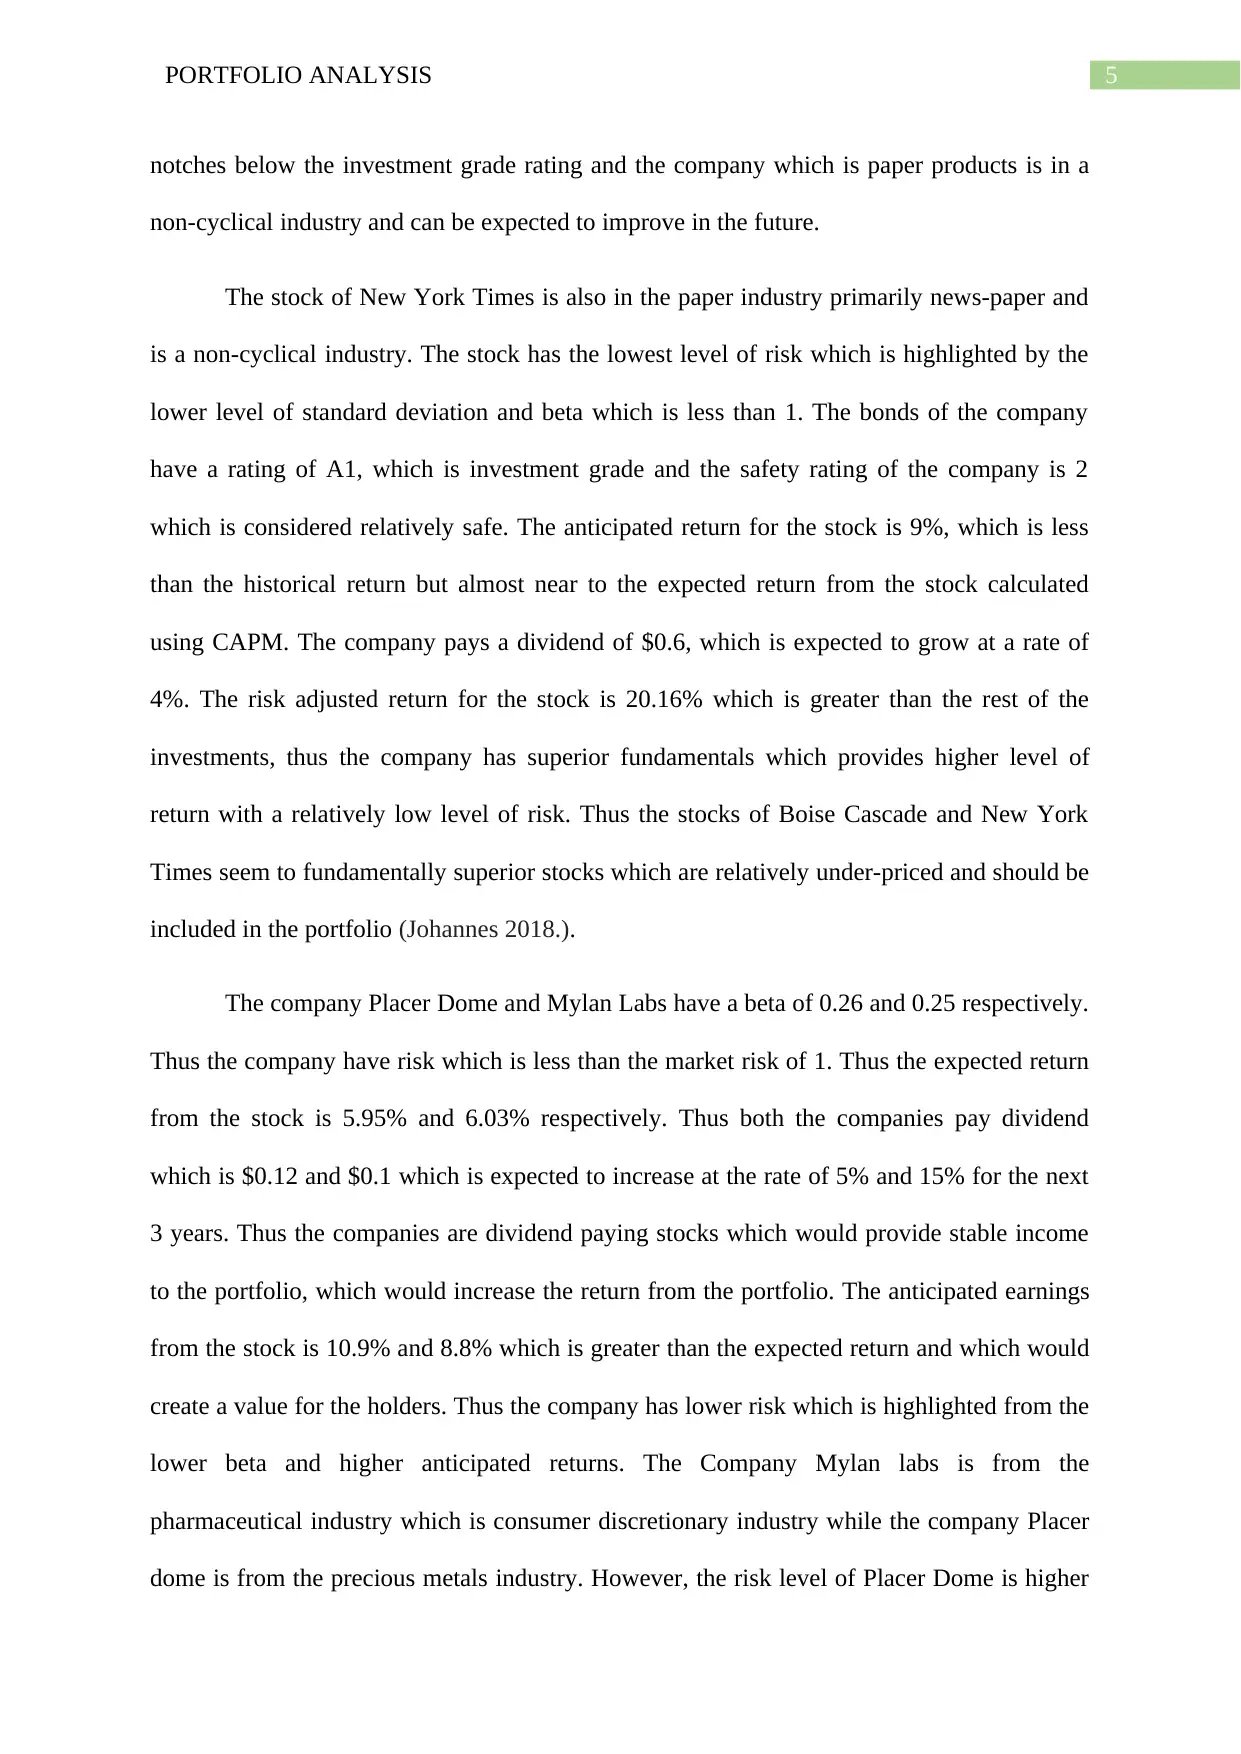
notches below the investment grade rating and the company which is paper products is in a
non-cyclical industry and can be expected to improve in the future.
The stock of New York Times is also in the paper industry primarily news-paper and
is a non-cyclical industry. The stock has the lowest level of risk which is highlighted by the
lower level of standard deviation and beta which is less than 1. The bonds of the company
have a rating of A1, which is investment grade and the safety rating of the company is 2
which is considered relatively safe. The anticipated return for the stock is 9%, which is less
than the historical return but almost near to the expected return from the stock calculated
using CAPM. The company pays a dividend of $0.6, which is expected to grow at a rate of
4%. The risk adjusted return for the stock is 20.16% which is greater than the rest of the
investments, thus the company has superior fundamentals which provides higher level of
return with a relatively low level of risk. Thus the stocks of Boise Cascade and New York
Times seem to fundamentally superior stocks which are relatively under-priced and should be
included in the portfolio (Johannes 2018.).
The company Placer Dome and Mylan Labs have a beta of 0.26 and 0.25 respectively.
Thus the company have risk which is less than the market risk of 1. Thus the expected return
from the stock is 5.95% and 6.03% respectively. Thus both the companies pay dividend
which is $0.12 and $0.1 which is expected to increase at the rate of 5% and 15% for the next
3 years. Thus the companies are dividend paying stocks which would provide stable income
to the portfolio, which would increase the return from the portfolio. The anticipated earnings
from the stock is 10.9% and 8.8% which is greater than the expected return and which would
create a value for the holders. Thus the company has lower risk which is highlighted from the
lower beta and higher anticipated returns. The Company Mylan labs is from the
pharmaceutical industry which is consumer discretionary industry while the company Placer
dome is from the precious metals industry. However, the risk level of Placer Dome is higher
⊘ This is a preview!⊘
Do you want full access?
Subscribe today to unlock all pages.
Trusted by 1+ million students worldwide
6PORTFOLIO ANALYSIS
the relative anticipated risk adjusted return is greater than the expected risk adjusted return.
The company Mylan Labs have no bonds ratings but placer dome has bond ratings which is
Baa2 which is investment grade bonds. Thus the fundamentals of both the companies is
highlighting a undervalued stocks which have the potential to generate positive future
earnings. Thus this stocks would tend to increase the value of the portfolio (Kopmann, Kock,
Killen and Gemünden 2017).
Thus the portfolio which should be constructed should include all the stocks which
have been listed but with different weights so as to provide diversification benefits to the
portfolio, while enhancing the returns which would be expected to be generated from the
portfolio.
Reason for holding all the stocks:
The aim of portfolio management is to generate optimal portfolio which generates the
highest level of return with the least level of risk. Thus the management could invest in one
stock which provides the highest return to generate the highest return for the portfolio,
however the level of risk of the portfolio will be concentrated on the one stock. This means if
the stock would increase it would create a return for the portfolio, however if the stock falls
the portfolio would lose return and even could have a negative return. Thus to avoid
excessive return in the portfolio the portfolio is diversified with stocks which have lower
correlation. Thus correlation among the stock implies that when two stocks have a positive
correlation the direction of the movement of the stock and the magnitude of movement is the
same. This is the case of stocks with a positive correlation of 1, thus two stocks which have a
positive correlation reduce the diversification benefits, whereas when two stocks have 0
correlation or negative correlation increase the diversification benefits (Jiang, Xu and Liang
2017). Thus the correlation among the stocks is calculated and highlighted in the figure
below,
Paraphrase This Document
Need a fresh take? Get an instant paraphrase of this document with our AI Paraphraser
7PORTFOLIO ANALYSIS
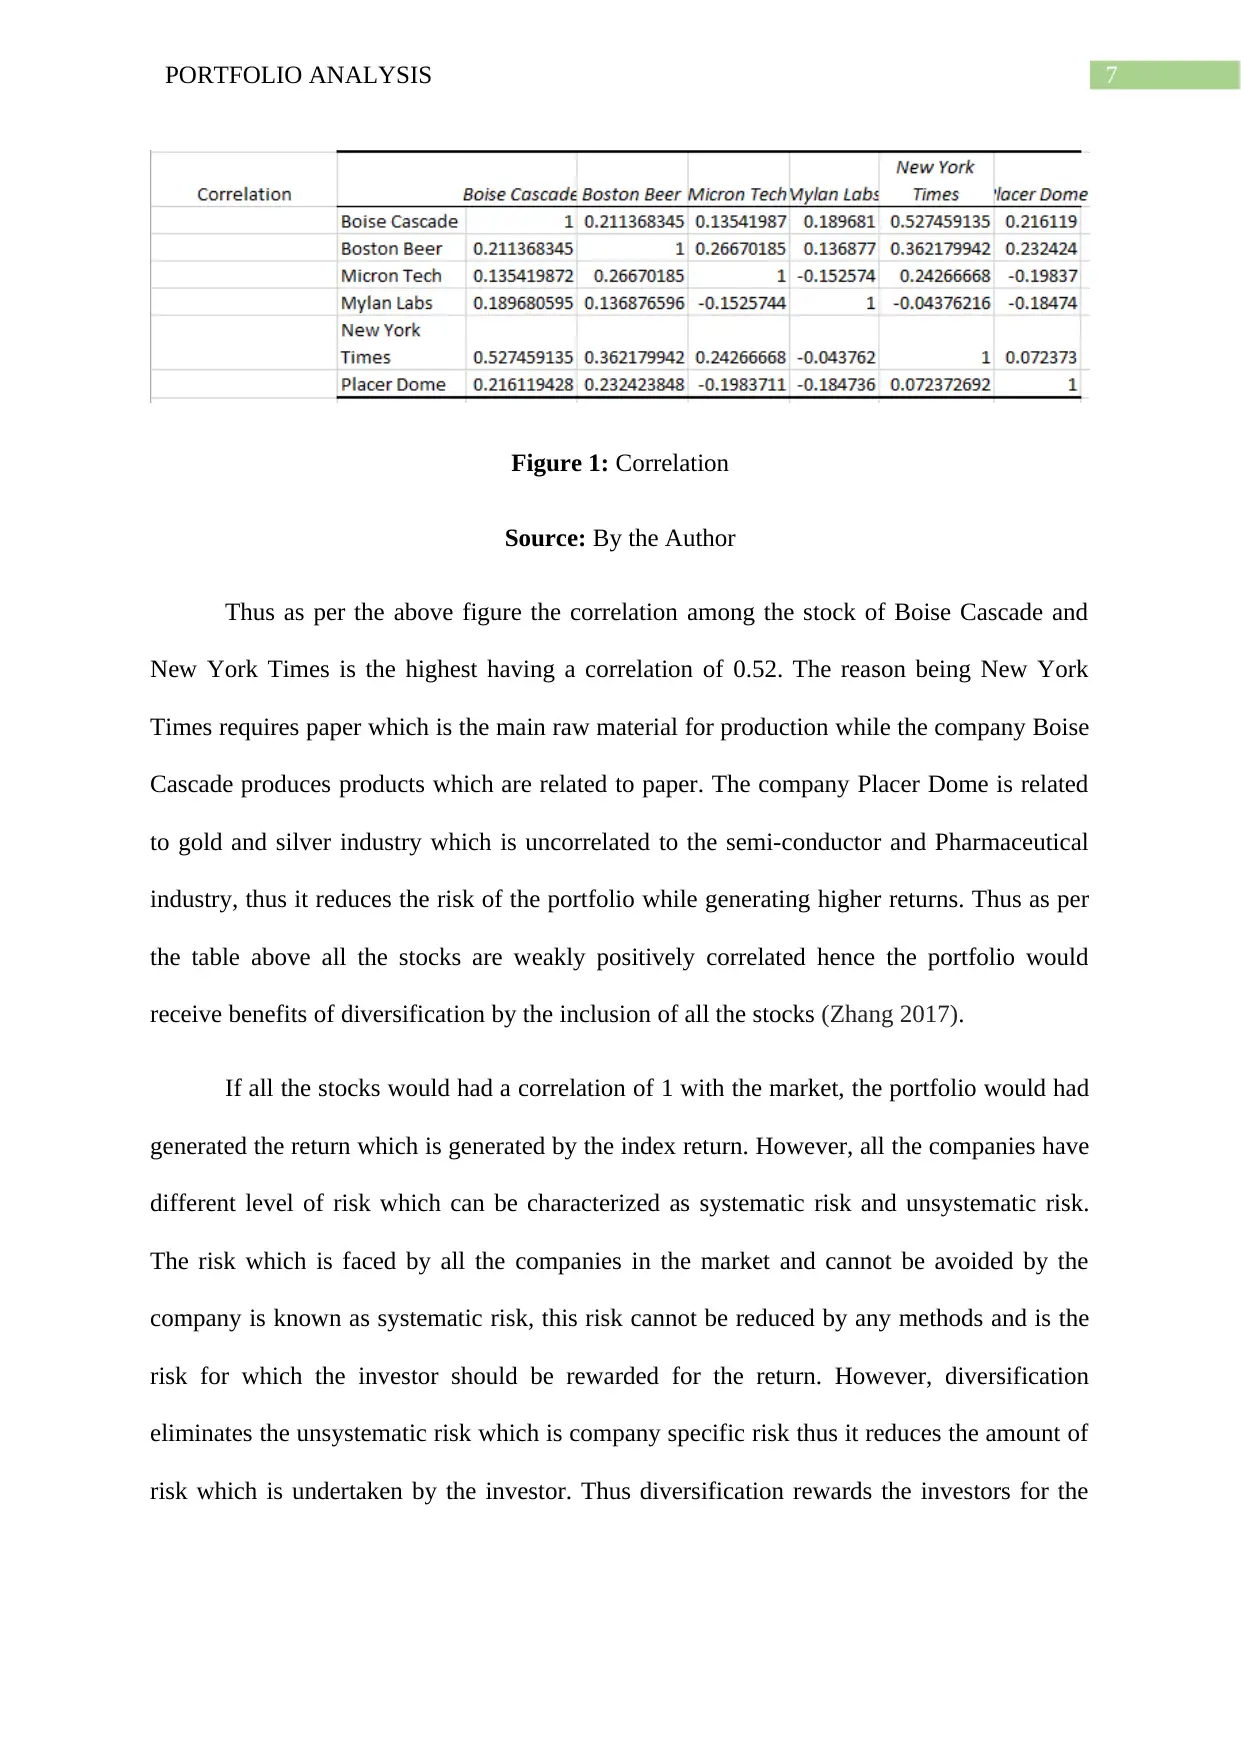
Figure 1: Correlation
Source: By the Author
Thus as per the above figure the correlation among the stock of Boise Cascade and
New York Times is the highest having a correlation of 0.52. The reason being New York
Times requires paper which is the main raw material for production while the company Boise
Cascade produces products which are related to paper. The company Placer Dome is related
to gold and silver industry which is uncorrelated to the semi-conductor and Pharmaceutical
industry, thus it reduces the risk of the portfolio while generating higher returns. Thus as per
the table above all the stocks are weakly positively correlated hence the portfolio would
receive benefits of diversification by the inclusion of all the stocks (Zhang 2017).
If all the stocks would had a correlation of 1 with the market, the portfolio would had
generated the return which is generated by the index return. However, all the companies have
different level of risk which can be characterized as systematic risk and unsystematic risk.
The risk which is faced by all the companies in the market and cannot be avoided by the
company is known as systematic risk, this risk cannot be reduced by any methods and is the
risk for which the investor should be rewarded for the return. However, diversification
eliminates the unsystematic risk which is company specific risk thus it reduces the amount of
risk which is undertaken by the investor. Thus diversification rewards the investors for the
8PORTFOLIO ANALYSIS
market risk or systematic risk which cannot be avoided by the investor by reducing or
eliminating the company specific risk (Alagidede, Koutounidis and Panagiotidis 2017).
CAPM:
The capital asset pricing model is a model which tends to calculate the level of return
which should be generated for the investor by taking a certain level of risk. The risk is
measured by the beta of the company, which is the measure of the systematic risk of the
company. Thus a beta greater than 1 implies that the company is risky than the market
portfolio. The beta equal to 1 means the company has the same risk as the market portfolio
and less than 1 implies the company is less risky than the market portfolio. Thus the CAPM
formula is used to calculate the required level of return for the level of systematic risk which
is present in the company. Thus the market return which is taken for the calculation of
expected return is the annualized S&P 500 index return which acts as benchmark for market
portfolio and provides a return of 12.4%. The risk free rate is the rate which could had been
earned by the investor by investing in risk free assets, thus if the investor invests in risky
assets it requires the risk free return to be generated along with the risky return. Thus the risk
free rate of return is taken as 3.8% which is the return of the US treasury bills and are
considered risk free due to being backed by the US government. The beta measure for each of
the stock is taken as the raw beta since it is calculated by regressing the monthly returns from
the stock with the monthly returns of the index and provides a true measure of the systematic
risk of the stock. A better measure of beta would had been to taken the daily returns of the
stock and regressing with the daily stock returns (Jain, Mitra, Haidary and Tiwari 2017).
Efficiency of the markets:
If the markets are efficient it would generate the expected return for the stock which is
calculated using the CAPM. This is because the efficient markets would reward the investors
only for the level of systematic risk and generating abnormal returns would be difficult on a
⊘ This is a preview!⊘
Do you want full access?
Subscribe today to unlock all pages.
Trusted by 1+ million students worldwide
9PORTFOLIO ANALYSIS
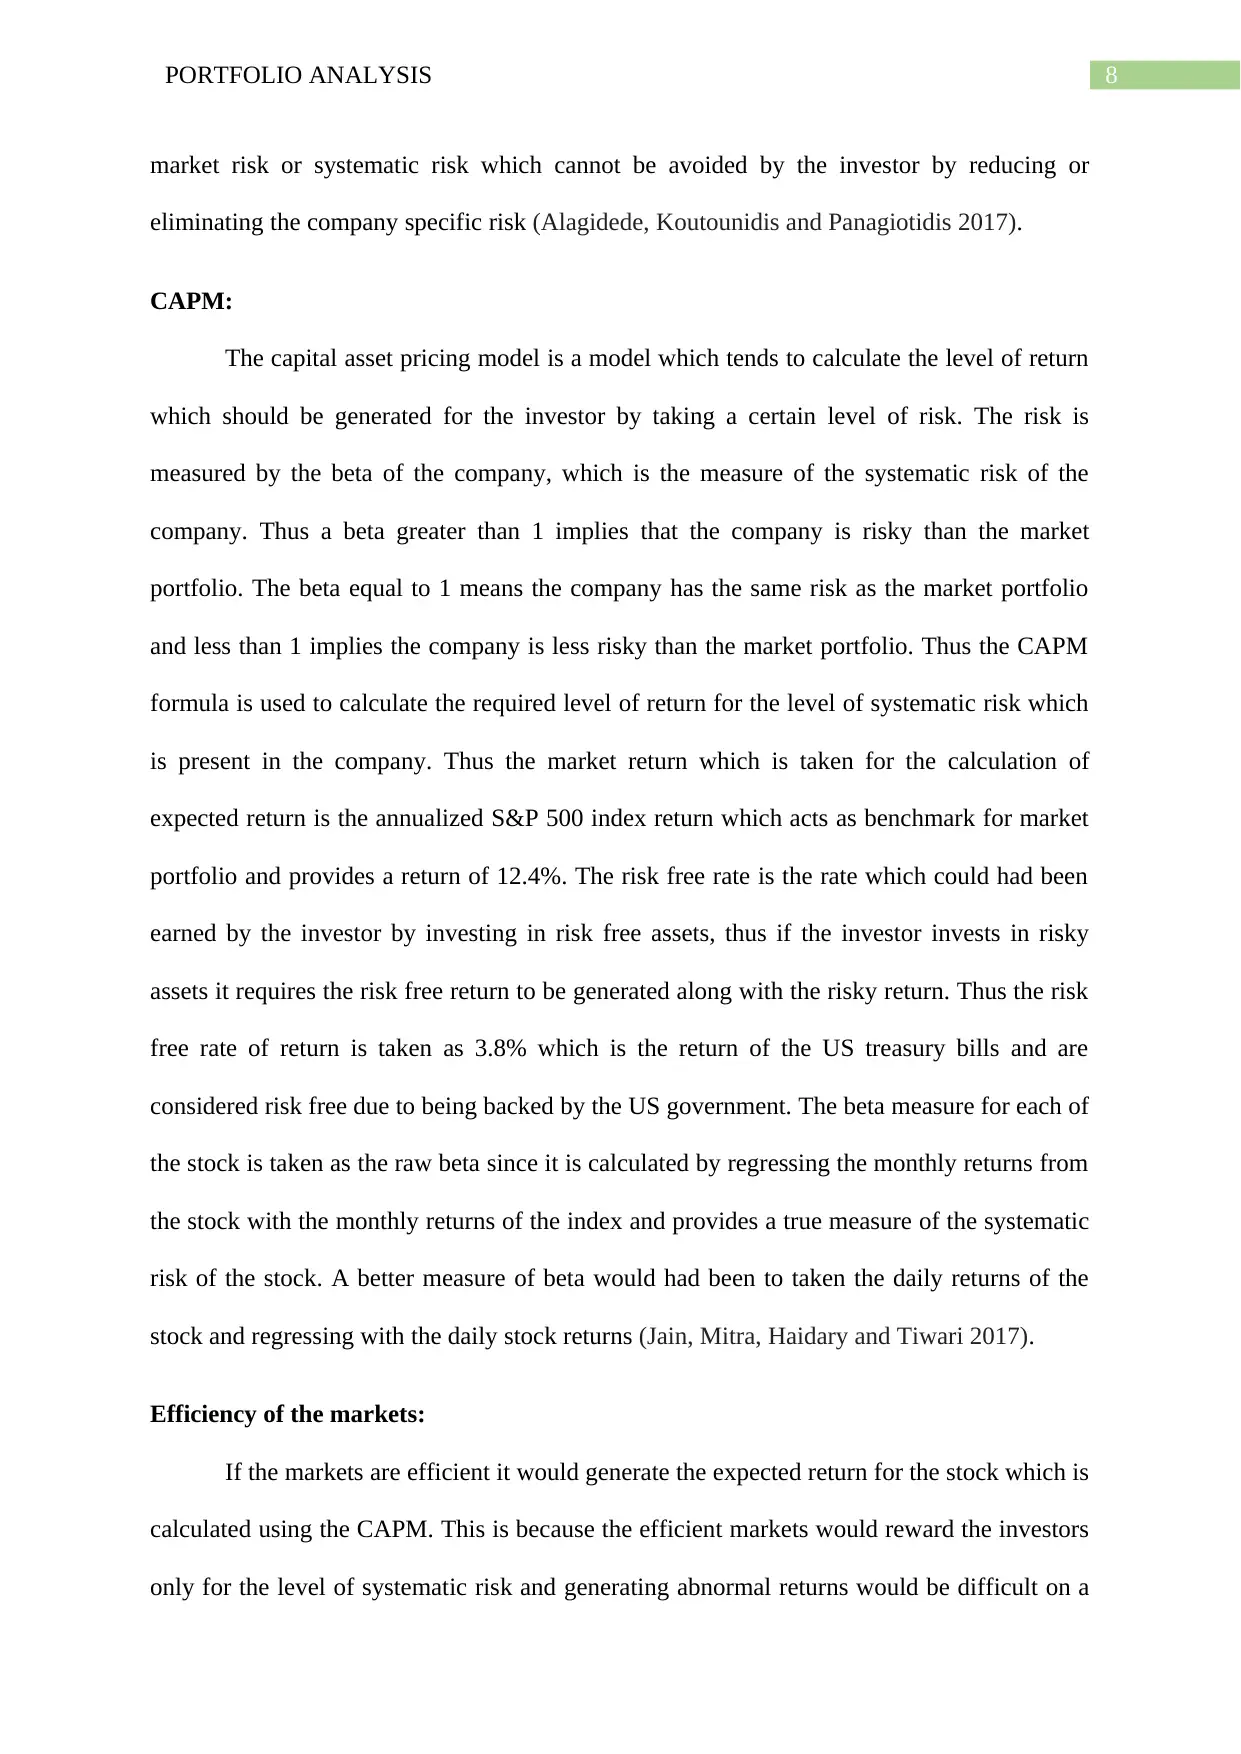
consistent basis. Thus the portfolio allocation which should be done in the event of efficient
markets is highlighted in the figure below,
Figure 3: CAPM Optimal Portfolio
Source: By the Author
Thus if the market is efficient it would generate a return of 13.33% with a standard
deviation of 7.12%. The Sharpe Ratio or the risk adjusted return would be maximized by
using above security selection. Thus also the portfolio allocation among the various securities
have been calculated using the historical return and anticipated return with the objective to
maximize the Sharpe Ratio (Olivier, Dessaint, Otto and Thesmar 2018).
Paraphrase This Document
Need a fresh take? Get an instant paraphrase of this document with our AI Paraphraser
10PORTFOLIO ANALYSIS
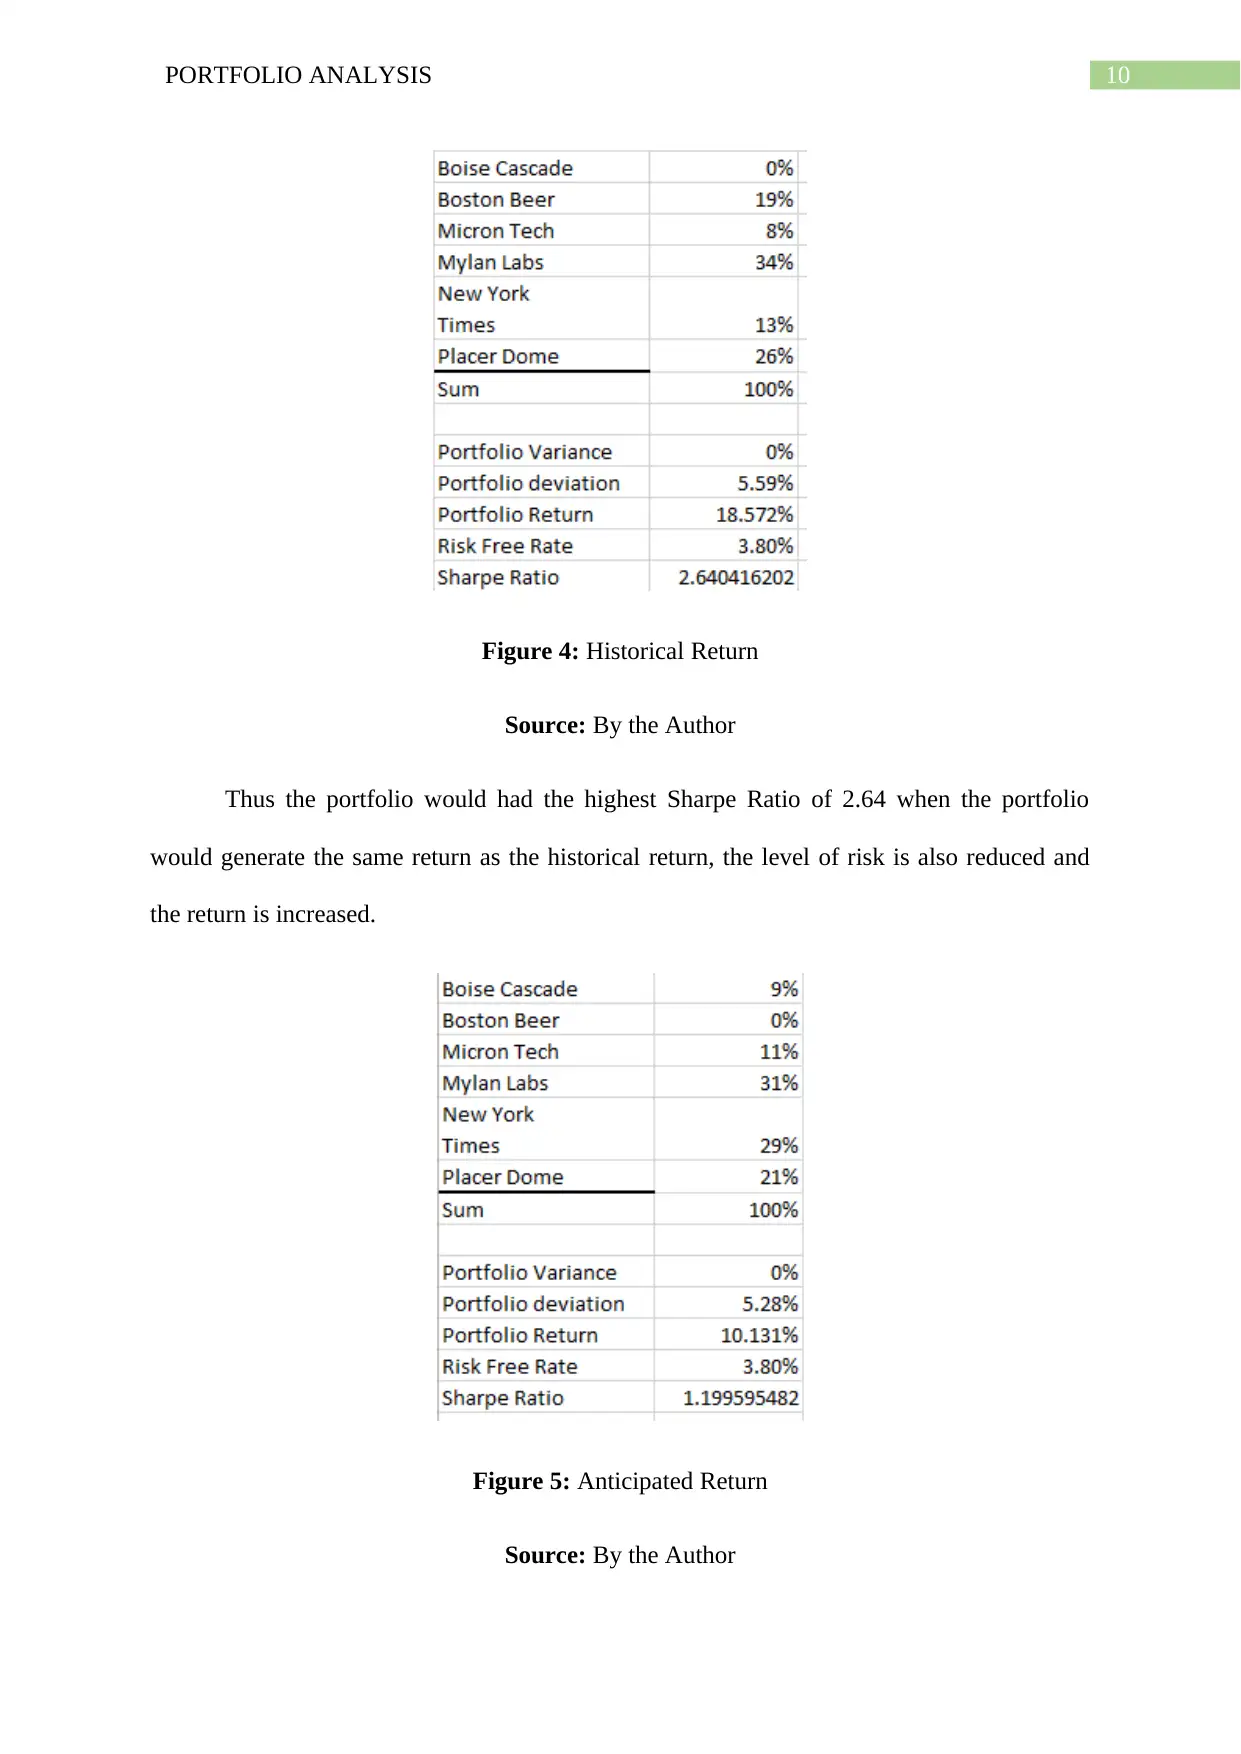
Figure 4: Historical Return
Source: By the Author
Thus the portfolio would had the highest Sharpe Ratio of 2.64 when the portfolio
would generate the same return as the historical return, the level of risk is also reduced and
the return is increased.
Figure 5: Anticipated Return
Source: By the Author

11PORTFOLIO ANALYSIS
Conclusion:
Thus in the above report it is concluded the importance of the level of return and risk
which needs to be considered when constructing a portfolio. The selection of security should
not be made in absolute terms only by analysing the risk return from the security on a
standalone basis. This is because if a portfolio is constructed on a standalone basis it leads to
the concentration risk in the portfolio which can lead to severe losses. Thus all the
fundamental factors need to be analysed when selecting securities for the portfolio. The
portfolio should consists of stocks with low correlation which would reduce the level of risk
of the portfolio providing diversification benefits to the portfolio, generating higher level of
returns for lower level of risk. The portfolio should be constructed in such a manner which
would increase the risk adjusted return of the portfolio or the Sharpe ratio. Thus the investors
should be awarded for the systematic risk which is undertaken and the unsystematic risk
should be reduced or eliminated by diversification of the portfolio.
⊘ This is a preview!⊘
Do you want full access?
Subscribe today to unlock all pages.
Trusted by 1+ million students worldwide
1 out of 14
Related Documents


Your All-in-One AI-Powered Toolkit for Academic Success.
+13062052269
info@desklib.com
Available 24*7 on WhatsApp / Email
![[object Object]](/_next/static/media/star-bottom.7253800d.svg)
Unlock your academic potential
Copyright © 2020–2026 A2Z Services. All Rights Reserved. Developed and managed by ZUCOL.