Case Study: Portfolio Analysis in ACC91210 Finance for Managers

Verified

Added on  2022/11/15

|7
|1886
|118
Case Study
AI Summary
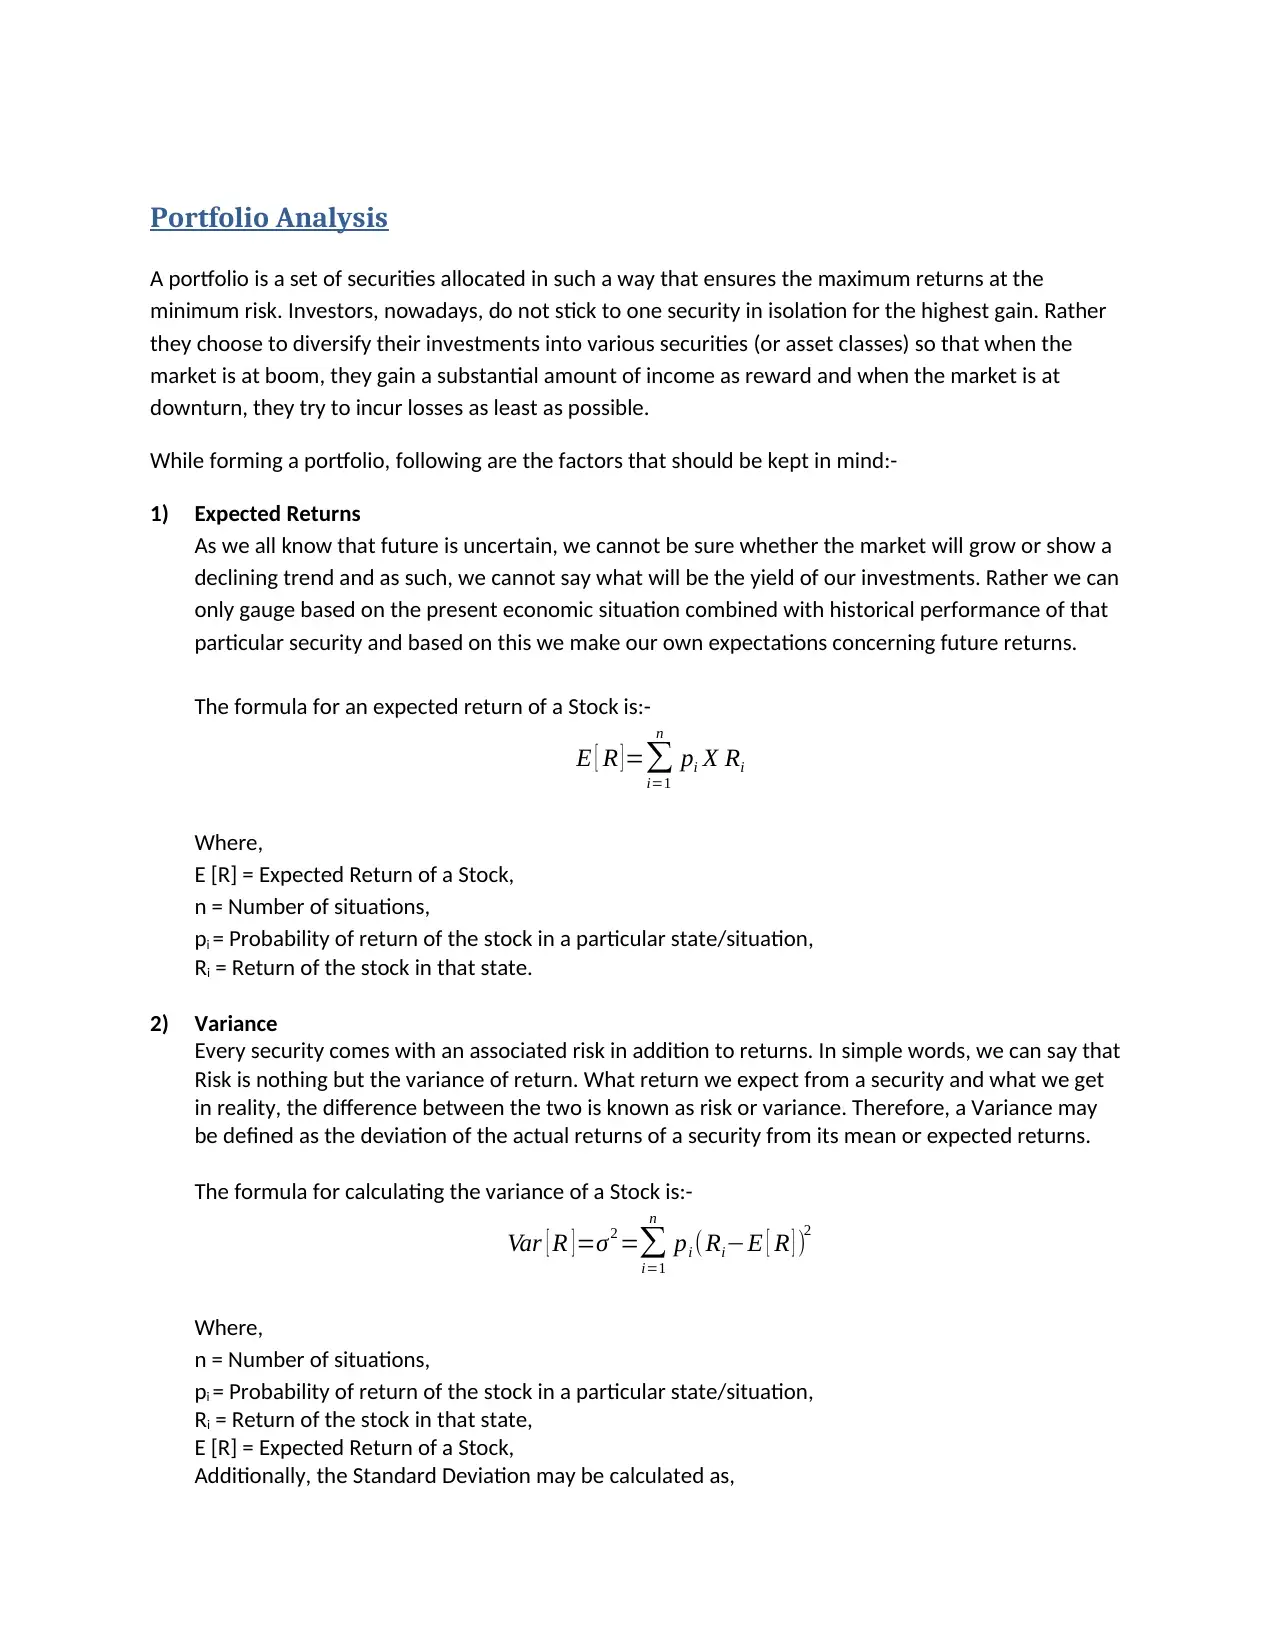
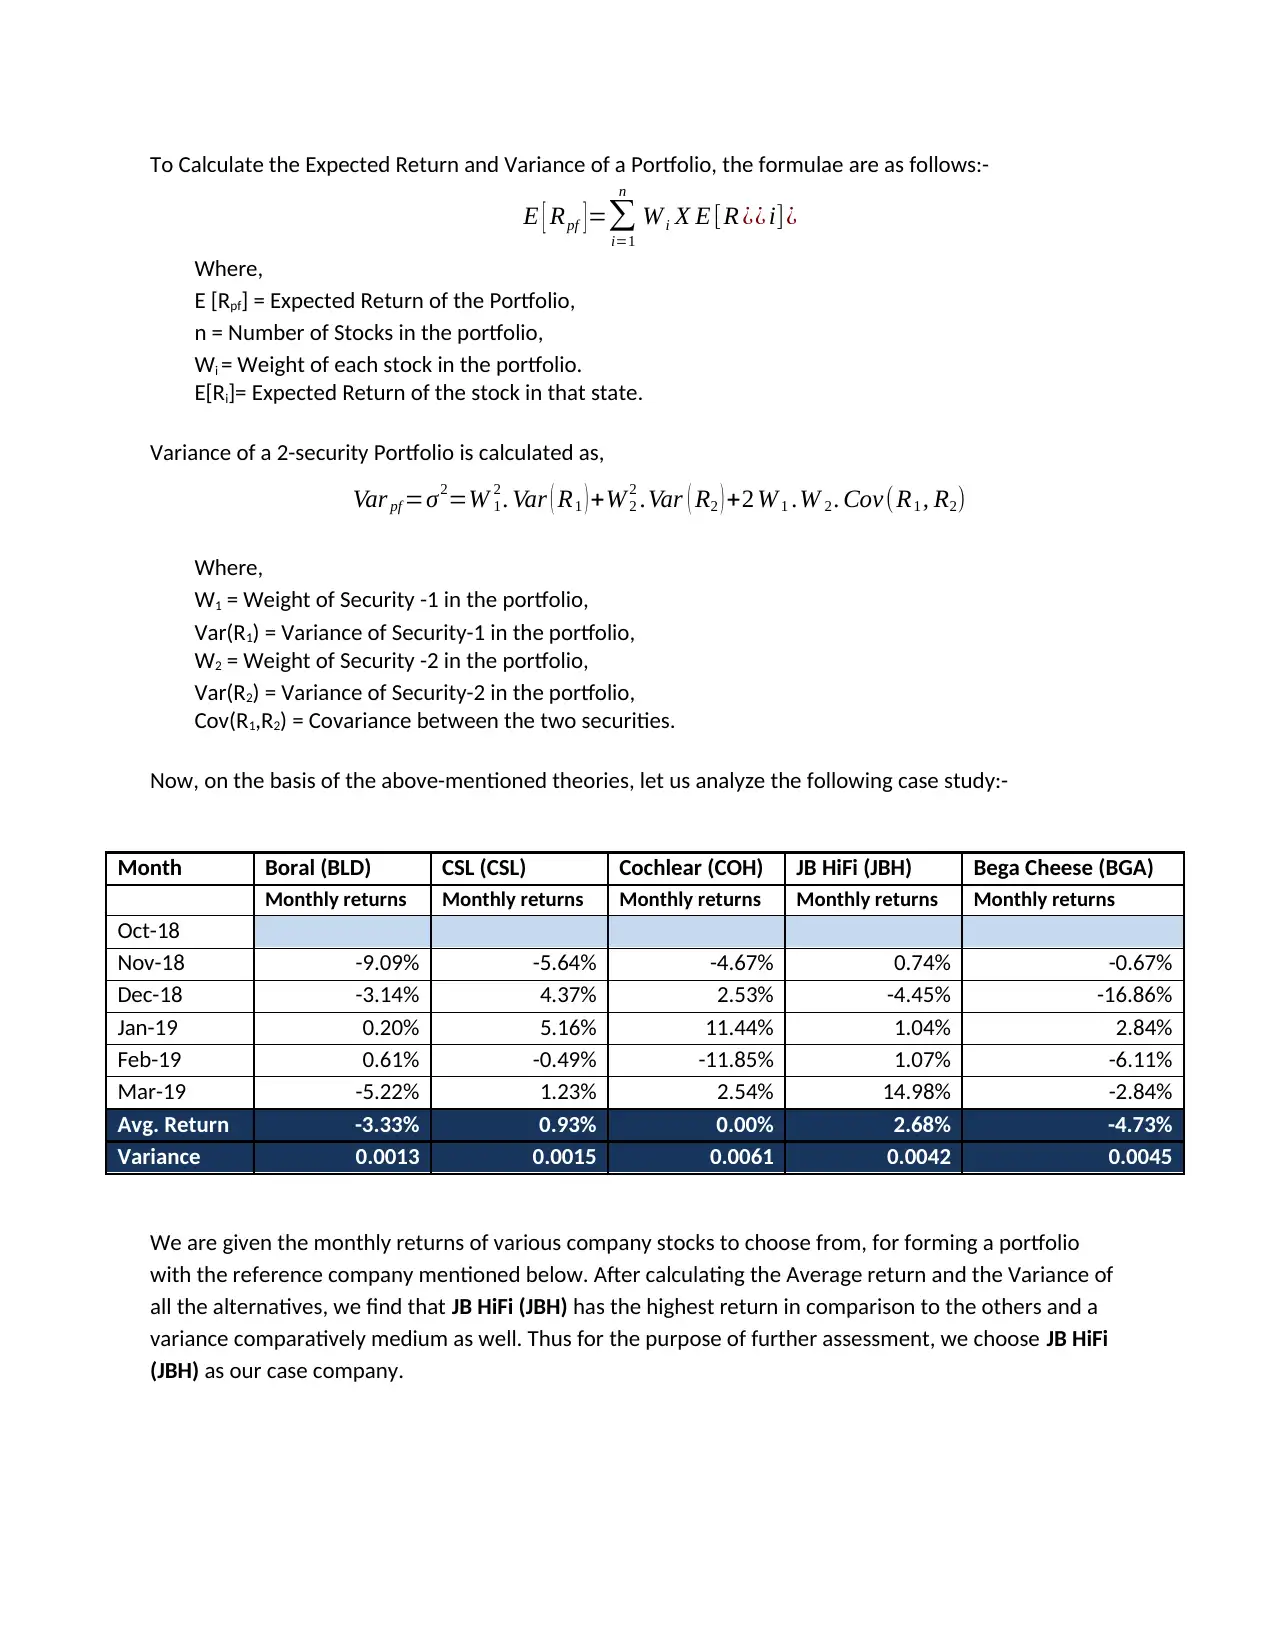
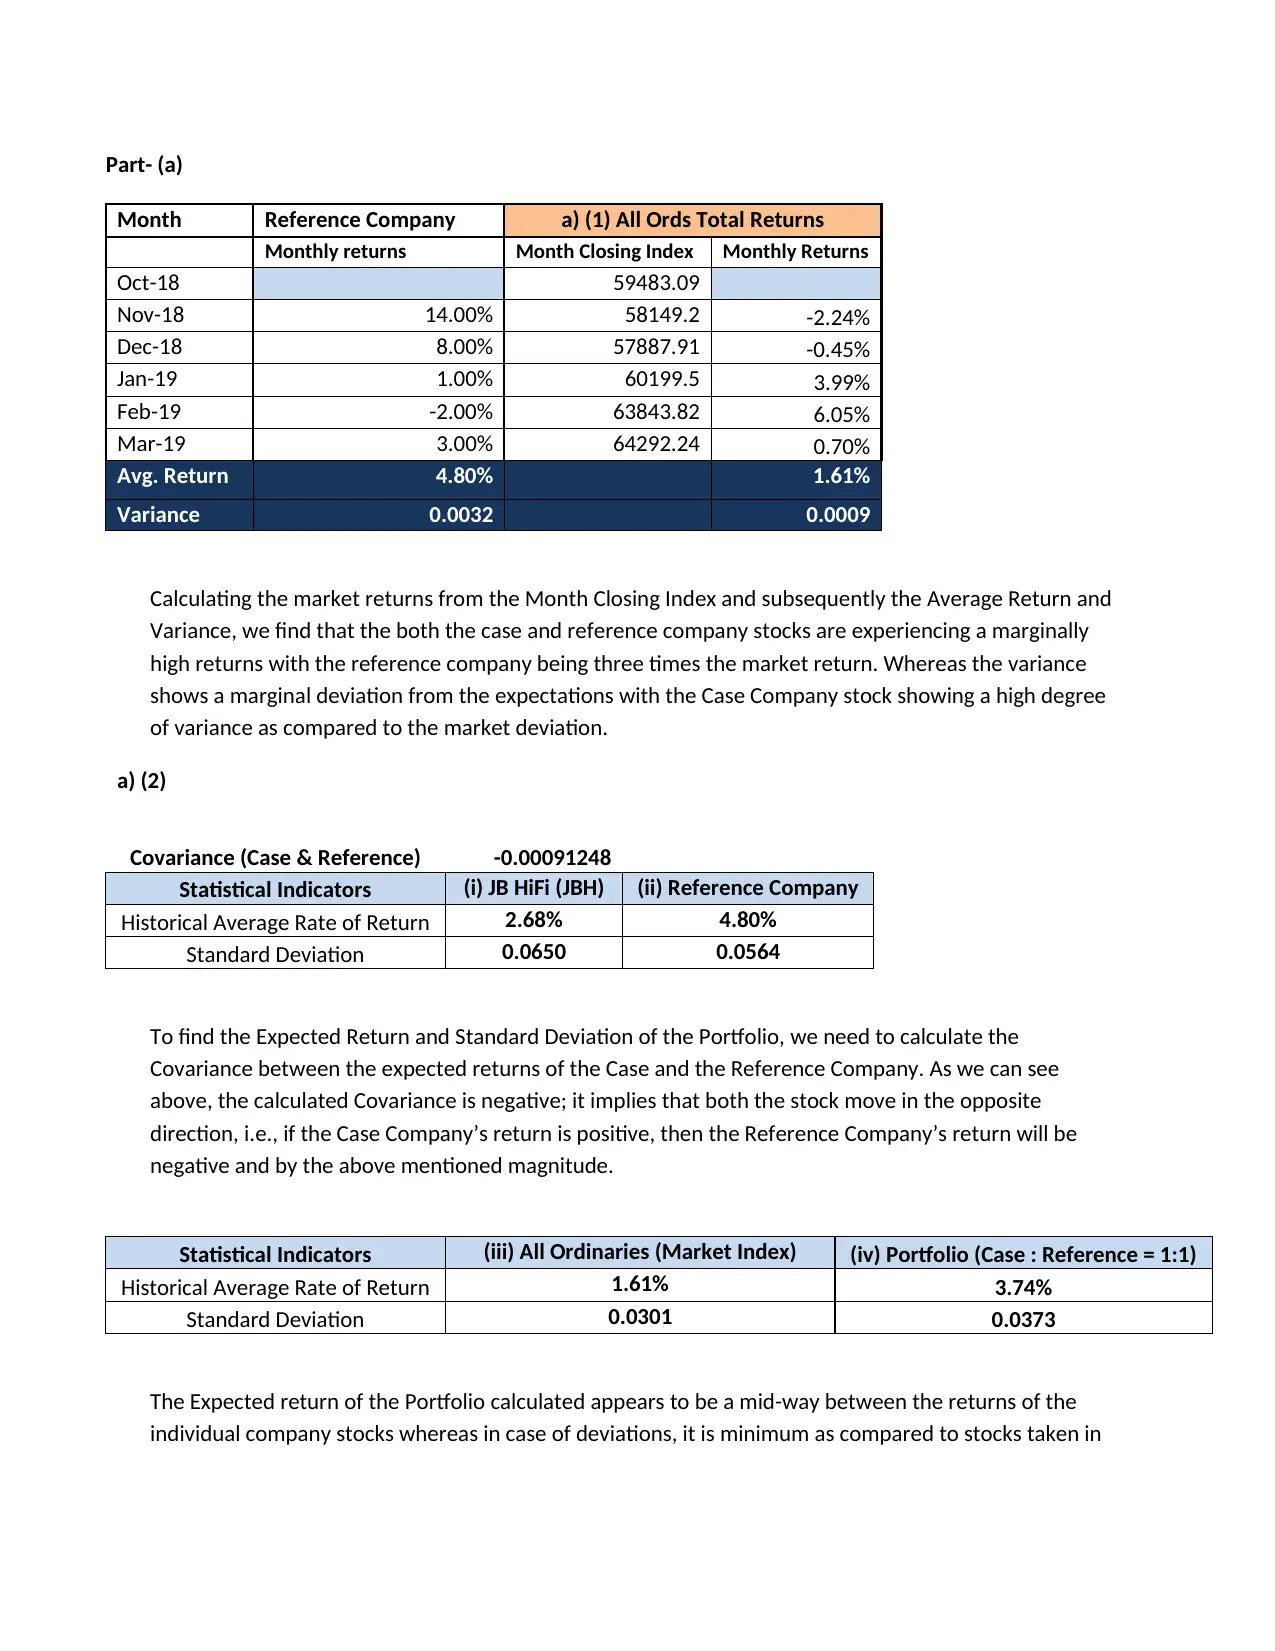
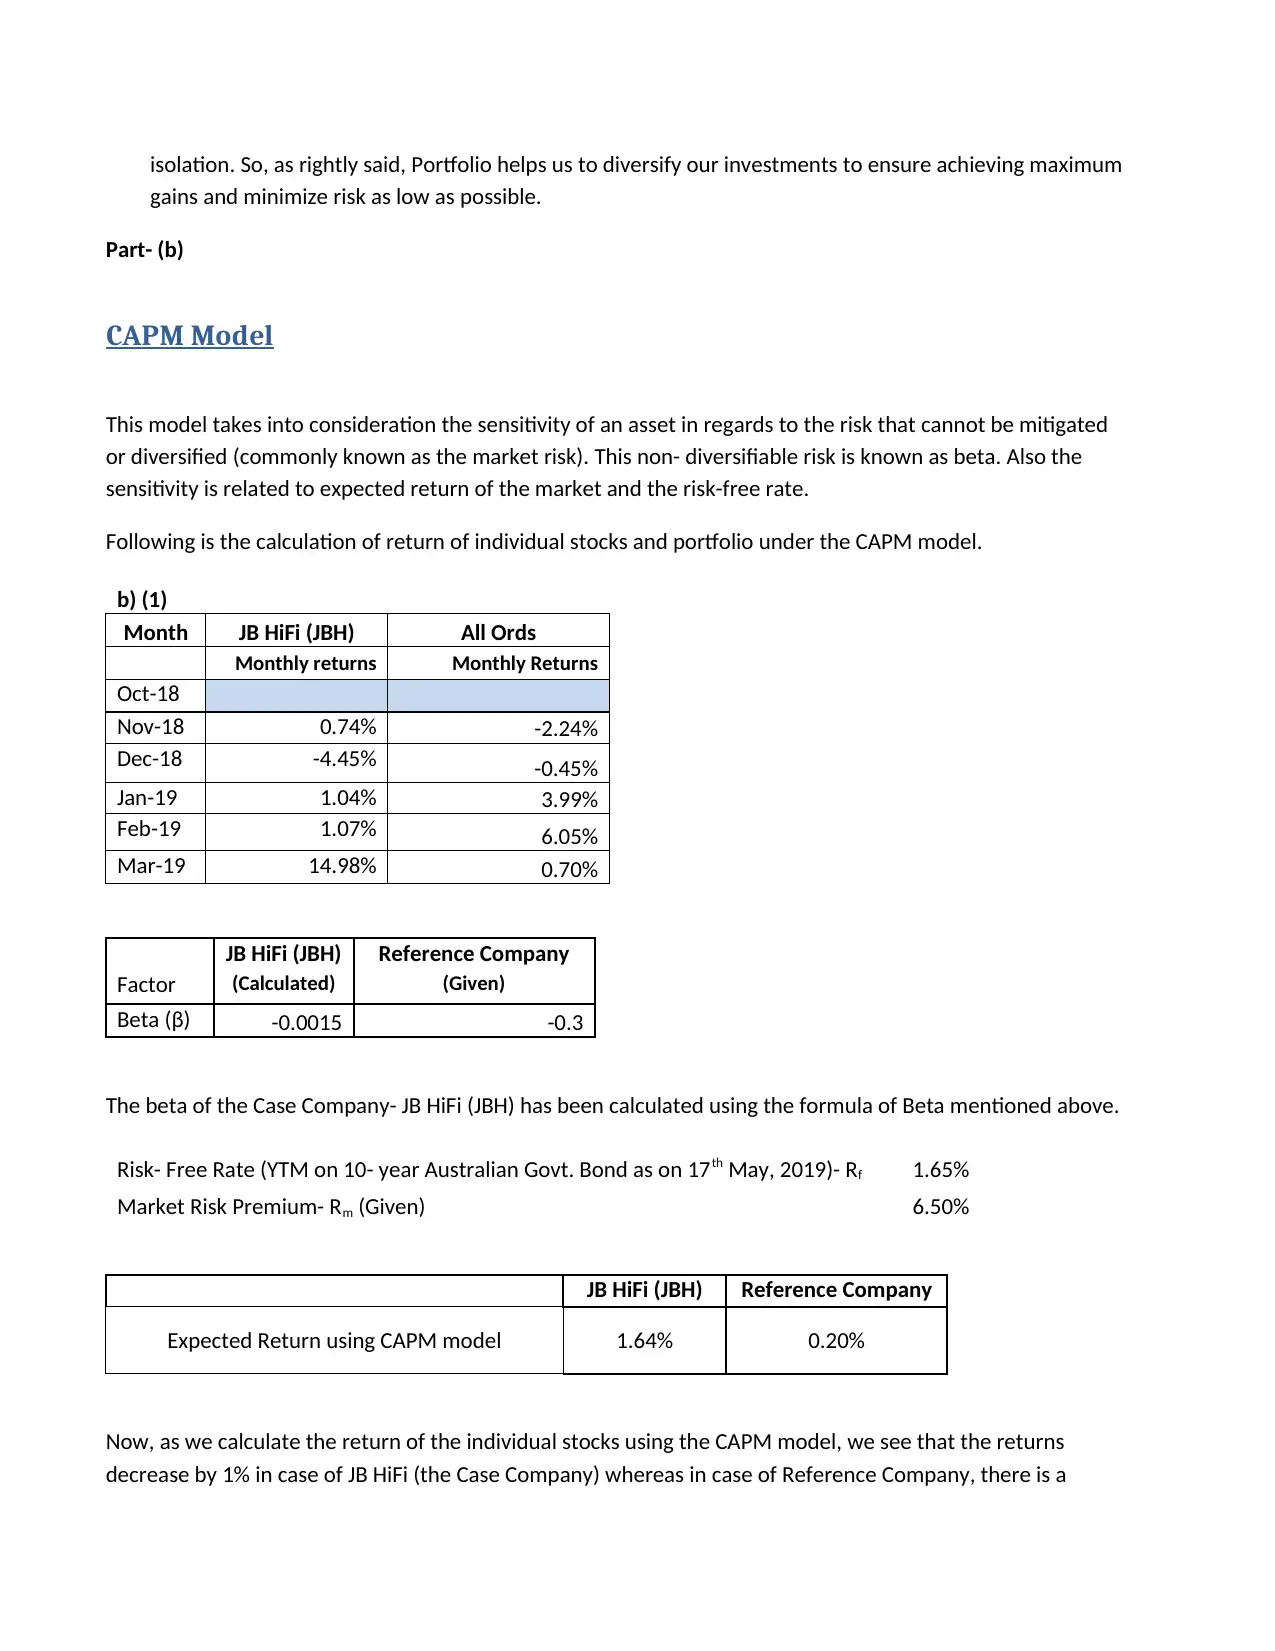
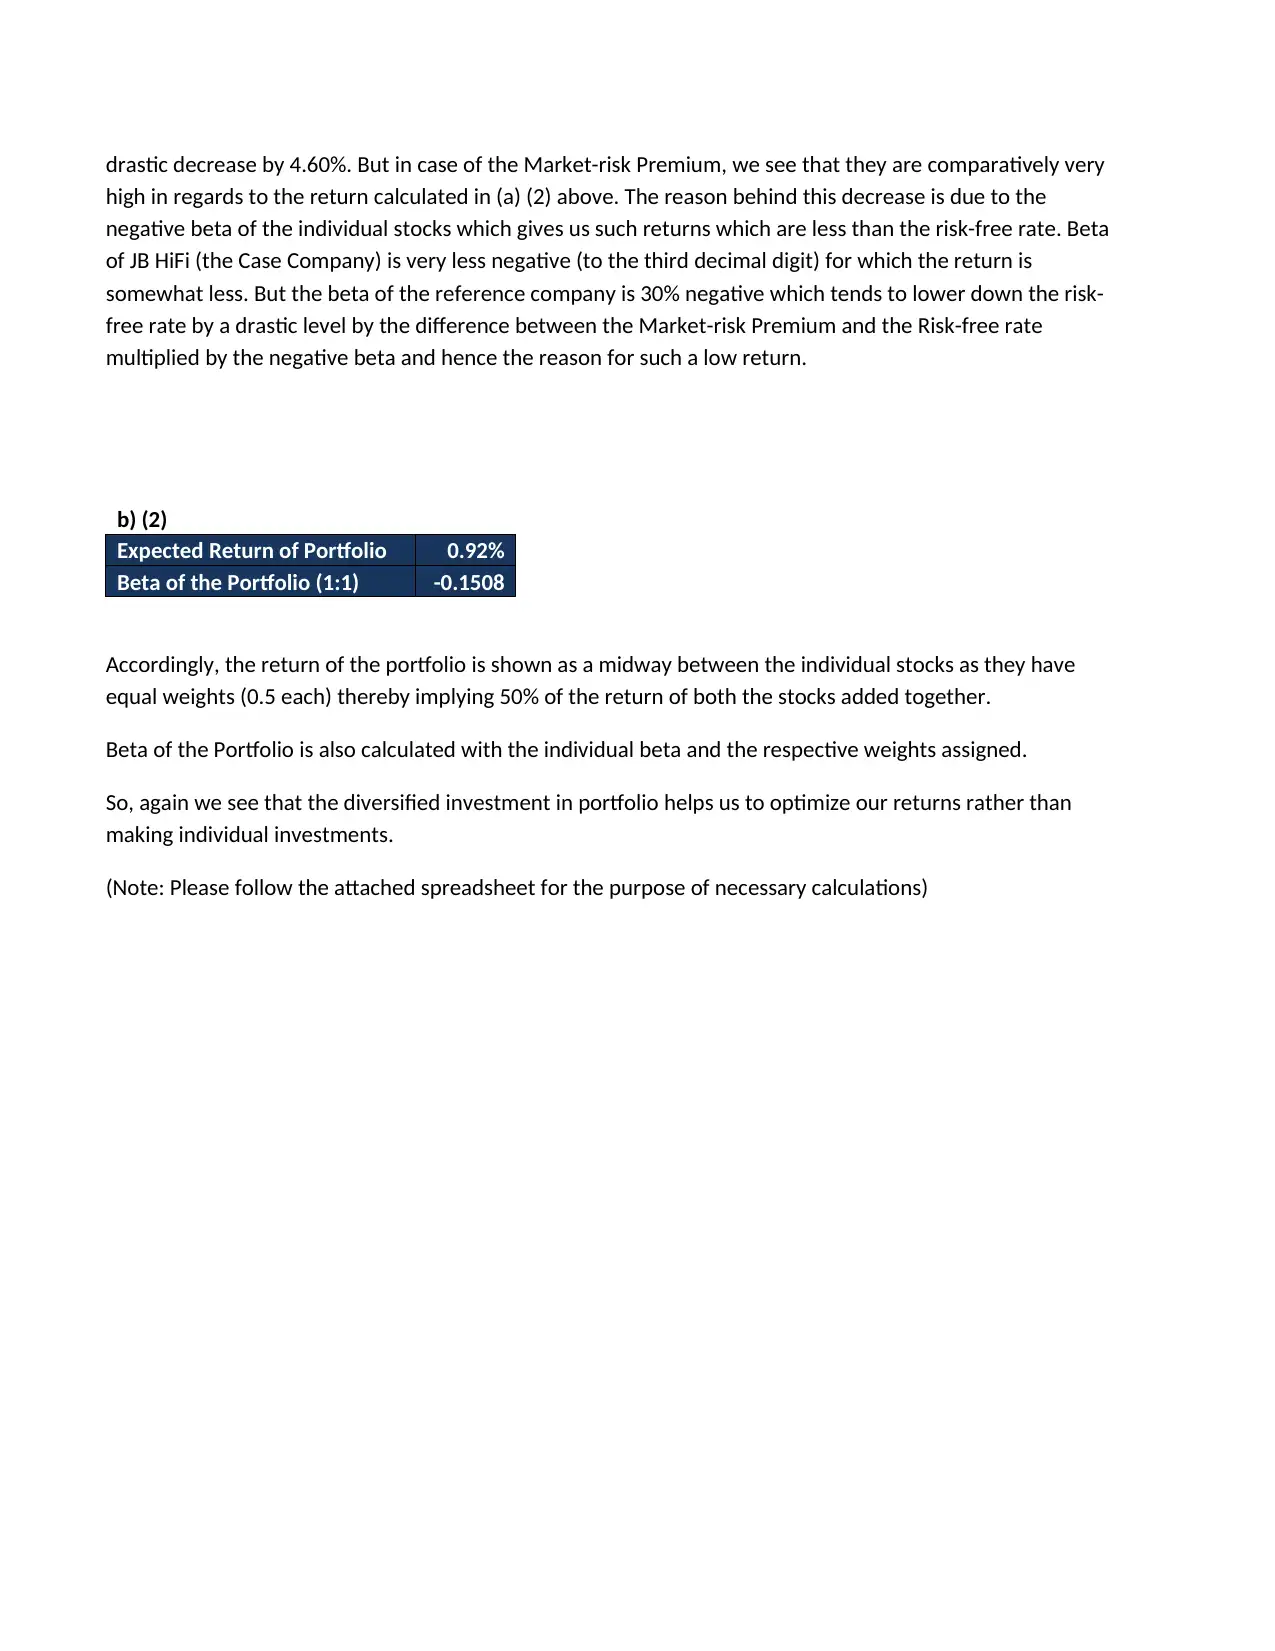
This case study analyzes a portfolio using historical market data for the company JB HiFi (JBH). It begins by calculating average returns and variances for several companies to select JB HiFi for further analysis. The study then calculates and interprets the covariance between JB HiFi and a reference company, along with statistical indicators like historical average rate of return and standard deviation for the case company, reference company, market index, and a 1:1 portfolio. The second part of the analysis applies the Capital Asset Pricing Model (CAPM) to determine expected returns, incorporating beta, risk-free rates, and market risk premium. The study calculates expected returns for individual stocks and a portfolio, highlighting the impact of beta on returns and the benefits of portfolio diversification in optimizing returns and minimizing risk. References from financial literature support the analysis.
Document Page
Portfolio Analysis
A portfolio is a set of securities allocated in such a way that ensures the maximum returns at the
minimum risk. Investors, nowadays, do not stick to one security in isolation for the highest gain. Rather
they choose to diversify their investments into various securities (or asset classes) so that when the
market is at boom, they gain a substantial amount of income as reward and when the market is at
downturn, they try to incur losses as least as possible.
While forming a portfolio, following are the factors that should be kept in mind:-
1) Expected Returns
As we all know that future is uncertain, we cannot be sure whether the market will grow or show a
declining trend and as such, we cannot say what will be the yield of our investments. Rather we can
only gauge based on the present economic situation combined with historical performance of that
particular security and based on this we make our own expectations concerning future returns.
The formula for an expected return of a Stock is:-
E [ R ] =
i=1
n
pi X Ri
Where,
E [R] = Expected Return of a Stock,
n = Number of situations,
pi = Probability of return of the stock in a particular state/situation,
Ri = Return of the stock in that state.
2) Variance
Every security comes with an associated risk in addition to returns. In simple words, we can say that
Risk is nothing but the variance of return. What return we expect from a security and what we get
in reality, the difference between the two is known as risk or variance. Therefore, a Variance may
be defined as the deviation of the actual returns of a security from its mean or expected returns.
The formula for calculating the variance of a Stock is:-
Var [ R ] =σ2 =
i=1
n
pi ( RiE [ R ] )2
Where,
n = Number of situations,
pi = Probability of return of the stock in a particular state/situation,
Ri = Return of the stock in that state,
E [R] = Expected Return of a Stock,
Additionally, the Standard Deviation may be calculated as,
tabler-icon-diamond-filled.svg

Secure Best Marks with AI Grader

Need help grading? Try our AI Grader for instant feedback on your assignments.
Document Page
Standard Deviation ( σ ) = Var (R)
3) Covariance
Covariance is another factor that determines the relationship between two or more securities in a
portfolio. While variance shows the deviation of returns of the stock that make up the portfolio,
covariance measures how the returns of one stock vary from the other and in what direction.
A positive value shows a positive relationship implying that both the stocks move in the same
direction while a negative value implies that they move in opposite directions, i.e., when one
increases, the other decreases and vice-versa. A value equal to zero implies that there is no
relationship between the two securities.
The formula for calculating the variance of a Stock is:-
Cov [ R1 , R2 ]=σ12=
i=1
n
pi ( R1 iE [ R1 ]) ¿ ¿
Where,
σ 12 = Covariance between the two stock returns,
n = Number of situations,
pi = Probability of return of the stock in a particular state/situation,
R1i = Return of stock 1 in that state,
E [R1] = Expected Return of Stock 1,
R2i = Return of stock 2 in that state,
E [R2] = Expected Return of Stock 2.
4) Beta (β)
Definition of a Beta is as follows:-
β= σ1 m
σm
2
Where,
σ 1m = Covariance between the stock returns and the market, and,
σm2 = Variance of the market portfolio.
Document Page
To Calculate the Expected Return and Variance of a Portfolio, the formulae are as follows:-
E [ Rpf ] =
i=1
n
Wi X E [R ¿¿ i]¿
Where,
E [Rpf] = Expected Return of the Portfolio,
n = Number of Stocks in the portfolio,
Wi = Weight of each stock in the portfolio.
E[Ri]= Expected Return of the stock in that state.
Variance of a 2-security Portfolio is calculated as,
Var pf =σ2=W 1
2 . Var ( R1 ) +W 2
2 .Var ( R2 ) +2 W 1 .W 2 . Cov(R1 , R2)
Where,
W1 = Weight of Security -1 in the portfolio,
Var(R1) = Variance of Security-1 in the portfolio,
W2 = Weight of Security -2 in the portfolio,
Var(R2) = Variance of Security-2 in the portfolio,
Cov(R1,R2) = Covariance between the two securities.
Now, on the basis of the above-mentioned theories, let us analyze the following case study:-
Month Boral (BLD) CSL (CSL) Cochlear (COH) JB HiFi (JBH) Bega Cheese (BGA)
Monthly returns Monthly returns Monthly returns Monthly returns Monthly returns
Oct-18
Nov-18 -9.09% -5.64% -4.67% 0.74% -0.67%
Dec-18 -3.14% 4.37% 2.53% -4.45% -16.86%
Jan-19 0.20% 5.16% 11.44% 1.04% 2.84%
Feb-19 0.61% -0.49% -11.85% 1.07% -6.11%
Mar-19 -5.22% 1.23% 2.54% 14.98% -2.84%
Avg. Return -3.33% 0.93% 0.00% 2.68% -4.73%
Variance 0.0013 0.0015 0.0061 0.0042 0.0045
We are given the monthly returns of various company stocks to choose from, for forming a portfolio
with the reference company mentioned below. After calculating the Average return and the Variance of
all the alternatives, we find that JB HiFi (JBH) has the highest return in comparison to the others and a
variance comparatively medium as well. Thus for the purpose of further assessment, we choose JB HiFi
(JBH) as our case company.
Document Page
Part- (a)
Month Reference Company a) (1) All Ords Total Returns
Monthly returns Month Closing Index Monthly Returns
Oct-18 59483.09
Nov-18 14.00% 58149.2 -2.24%
Dec-18 8.00% 57887.91 -0.45%
Jan-19 1.00% 60199.5 3.99%
Feb-19 -2.00% 63843.82 6.05%
Mar-19 3.00% 64292.24 0.70%
Avg. Return 4.80% 1.61%
Variance 0.0032 0.0009
Calculating the market returns from the Month Closing Index and subsequently the Average Return and
Variance, we find that the both the case and reference company stocks are experiencing a marginally
high returns with the reference company being three times the market return. Whereas the variance
shows a marginal deviation from the expectations with the Case Company stock showing a high degree
of variance as compared to the market deviation.
a) (2)
Covariance (Case & Reference) -0.00091248
Statistical Indicators (i) JB HiFi (JBH) (ii) Reference Company
Historical Average Rate of Return 2.68% 4.80%
Standard Deviation 0.0650 0.0564
To find the Expected Return and Standard Deviation of the Portfolio, we need to calculate the
Covariance between the expected returns of the Case and the Reference Company. As we can see
above, the calculated Covariance is negative; it implies that both the stock move in the opposite
direction, i.e., if the Case Company’s return is positive, then the Reference Company’s return will be
negative and by the above mentioned magnitude.
Statistical Indicators (iii) All Ordinaries (Market Index) (iv) Portfolio (Case : Reference = 1:1)
Historical Average Rate of Return 1.61% 3.74%
Standard Deviation 0.0301 0.0373
The Expected return of the Portfolio calculated appears to be a mid-way between the returns of the
individual company stocks whereas in case of deviations, it is minimum as compared to stocks taken in
tabler-icon-diamond-filled.svg

Secure Best Marks with AI Grader

Need help grading? Try our AI Grader for instant feedback on your assignments.
Document Page
isolation. So, as rightly said, Portfolio helps us to diversify our investments to ensure achieving maximum
gains and minimize risk as low as possible.
Part- (b)
CAPM Model
This model takes into consideration the sensitivity of an asset in regards to the risk that cannot be mitigated
or diversified (commonly known as the market risk). This non- diversifiable risk is known as beta. Also the
sensitivity is related to expected return of the market and the risk-free rate.
Following is the calculation of return of individual stocks and portfolio under the CAPM model.
b) (1)
Month JB HiFi (JBH) All Ords
Monthly returns Monthly Returns
Oct-18
Nov-18 0.74% -2.24%
Dec-18 -4.45% -0.45%
Jan-19 1.04% 3.99%
Feb-19 1.07% 6.05%
Mar-19 14.98% 0.70%
JB HiFi (JBH) Reference Company
Factor (Calculated) (Given)
Beta (β) -0.0015 -0.3
The beta of the Case Company- JB HiFi (JBH) has been calculated using the formula of Beta mentioned above.
Risk- Free Rate (YTM on 10- year Australian Govt. Bond as on 17th May, 2019)- Rf 1.65%
Market Risk Premium- Rm (Given) 6.50%
JB HiFi (JBH) Reference Company
Expected Return using CAPM model 1.64% 0.20%
Now, as we calculate the return of the individual stocks using the CAPM model, we see that the returns
decrease by 1% in case of JB HiFi (the Case Company) whereas in case of Reference Company, there is a
Document Page
drastic decrease by 4.60%. But in case of the Market-risk Premium, we see that they are comparatively very
high in regards to the return calculated in (a) (2) above. The reason behind this decrease is due to the
negative beta of the individual stocks which gives us such returns which are less than the risk-free rate. Beta
of JB HiFi (the Case Company) is very less negative (to the third decimal digit) for which the return is
somewhat less. But the beta of the reference company is 30% negative which tends to lower down the risk-
free rate by a drastic level by the difference between the Market-risk Premium and the Risk-free rate
multiplied by the negative beta and hence the reason for such a low return.
b) (2)
Expected Return of Portfolio 0.92%
Beta of the Portfolio (1:1) -0.1508
Accordingly, the return of the portfolio is shown as a midway between the individual stocks as they have
equal weights (0.5 each) thereby implying 50% of the return of both the stocks added together.
Beta of the Portfolio is also calculated with the individual beta and the respective weights assigned.
So, again we see that the diversified investment in portfolio helps us to optimize our returns rather than
making individual investments.
(Note: Please follow the attached spreadsheet for the purpose of necessary calculations)
Document Page
References
Alexander, G. and Francis, J. (2016). Portfolio analysis. Englewood Cliffs, N.J.: Prentice-Hall.
Collison, D. and Barnard, R. (2017). Share valuation handbook. Kingston-upon-Thames: CCH.
Chandra, P. (2017). Investment analysis and portfolio management. New Delhi: Tata McGraw-Hill
Education.
chevron_up_icon
1 out of 7
circle_padding
hide_on_mobile
zoom_out_icon
logo.png

Your All-in-One AI-Powered Toolkit for Academic Success.

Available 24*7 on WhatsApp / Email

[object Object]