Financial Portfolio Analysis: Assessing Risk, Return, and Cost
VerifiedAdded on 2023/06/15
|11
|2993
|329
Report
AI Summary
This report conducts a portfolio analysis of Accenture (ACN) and Ameriprise Financial (AMP), representing the IT and Financial sectors, respectively. Using six years of stock price data (2016-2021), the analysis forms an equally weighted portfolio to determine risk and return dynamics, calculating monthly returns, average returns, and standard deviation. The report then explores optimal portfolio construction through various stock combinations, evaluating risk-return trade-offs. Furthermore, it estimates the equity cost of capital for both companies, considering beta, risk-free rate, and average stock return, and discusses the impact of economic conditions on the weighted average cost of capital (WACC). The report concludes by highlighting the benefits of portfolio diversification and the importance of managing risk to achieve optimal returns. Desklib provides access to past papers and solved assignments for students seeking further assistance.

PORTFOLIO ANALYSIS
Paraphrase This Document
Need a fresh take? Get an instant paraphrase of this document with our AI Paraphraser
Table of Contents
COMPANY BACKGROUND........................................................................................................3
SECTION A – Two Asset Portfolio................................................................................................3
Forming an equally weighted portfolio to determine risk and return dynamics..........................3
SECTION B – Optimal Portfolio....................................................................................................5
Average annual returns and standard deviation of various portfolios (Combination of two
stocks)..........................................................................................................................................5
SECTION C – Cost of Capital.........................................................................................................7
Estimation of equity cost of capital.............................................................................................7
CONCLUSION................................................................................................................................9
REFERENCES..............................................................................................................................10
COMPANY BACKGROUND
The present report will be based on Accenture and Ameriprise Financial Plc which are belonging
from two distinct sectors of the economy that is, IT and Financial sector. Accenture is a
specialized MNC basically into providing consultation and IT services based in Ireland. In
addition to this, Ameriprise Financial is a bank holding and diversified financial services
company based in Minneapolis, Minnesota (Narayan and Rehman, 2020).
Accenture and Ameriprise Financial, both are the companies forming part of S&P 500
index for which stock price data has been obtained for the last six years beginning from 1st
September 2016 to 31st August 2021. These companies are belonging from two distinct sectors as
per the industrial classification done by GICS (Global Industry Classification Standards).
Accenture belongs from Information Technology sector whose industry group, industry and sub
– industry is software and services, IT services and IT consulting and other services respectively
(Li and et.al., 2019). On the other hand, Ameriprise Financial belongs from financial sector
whose industry group, industry and sub – industry is diversified financial, capital markets and
Asset management & custody banks respectively.
SECTION A – Two Asset Portfolio
Forming an equally weighted portfolio to determine risk and return dynamics
Therefore, if equally weighted portfolio will be formed for these two stocks, then 50:50
proportion will be given to both of these portfolios. To determine the monthly returns of these
stocks individually, their current month closing price has been subtracted from the closing price
of the previous months and the result so derived has been divided by the previous month’s
closing price. In this way, monthly returns have been obtained for each of these two stocks
(Balcilar, Ozdemir and Ozdemir, 2021). Accordingly, average of these monthly returns has been
calculated for both of these stocks to determine the individual average return of each stock. Also,
to determine the risk of these stocks, standard deviation has been calculated on the basis of
monthly returns of the stock through excel formula. Further, to determine the risk and return
associated with the portfolio comprising of these two stock in equal proportion, the following
calculations has been done:
⊘ This is a preview!⊘
Do you want full access?
Subscribe today to unlock all pages.
Trusted by 1+ million students worldwide
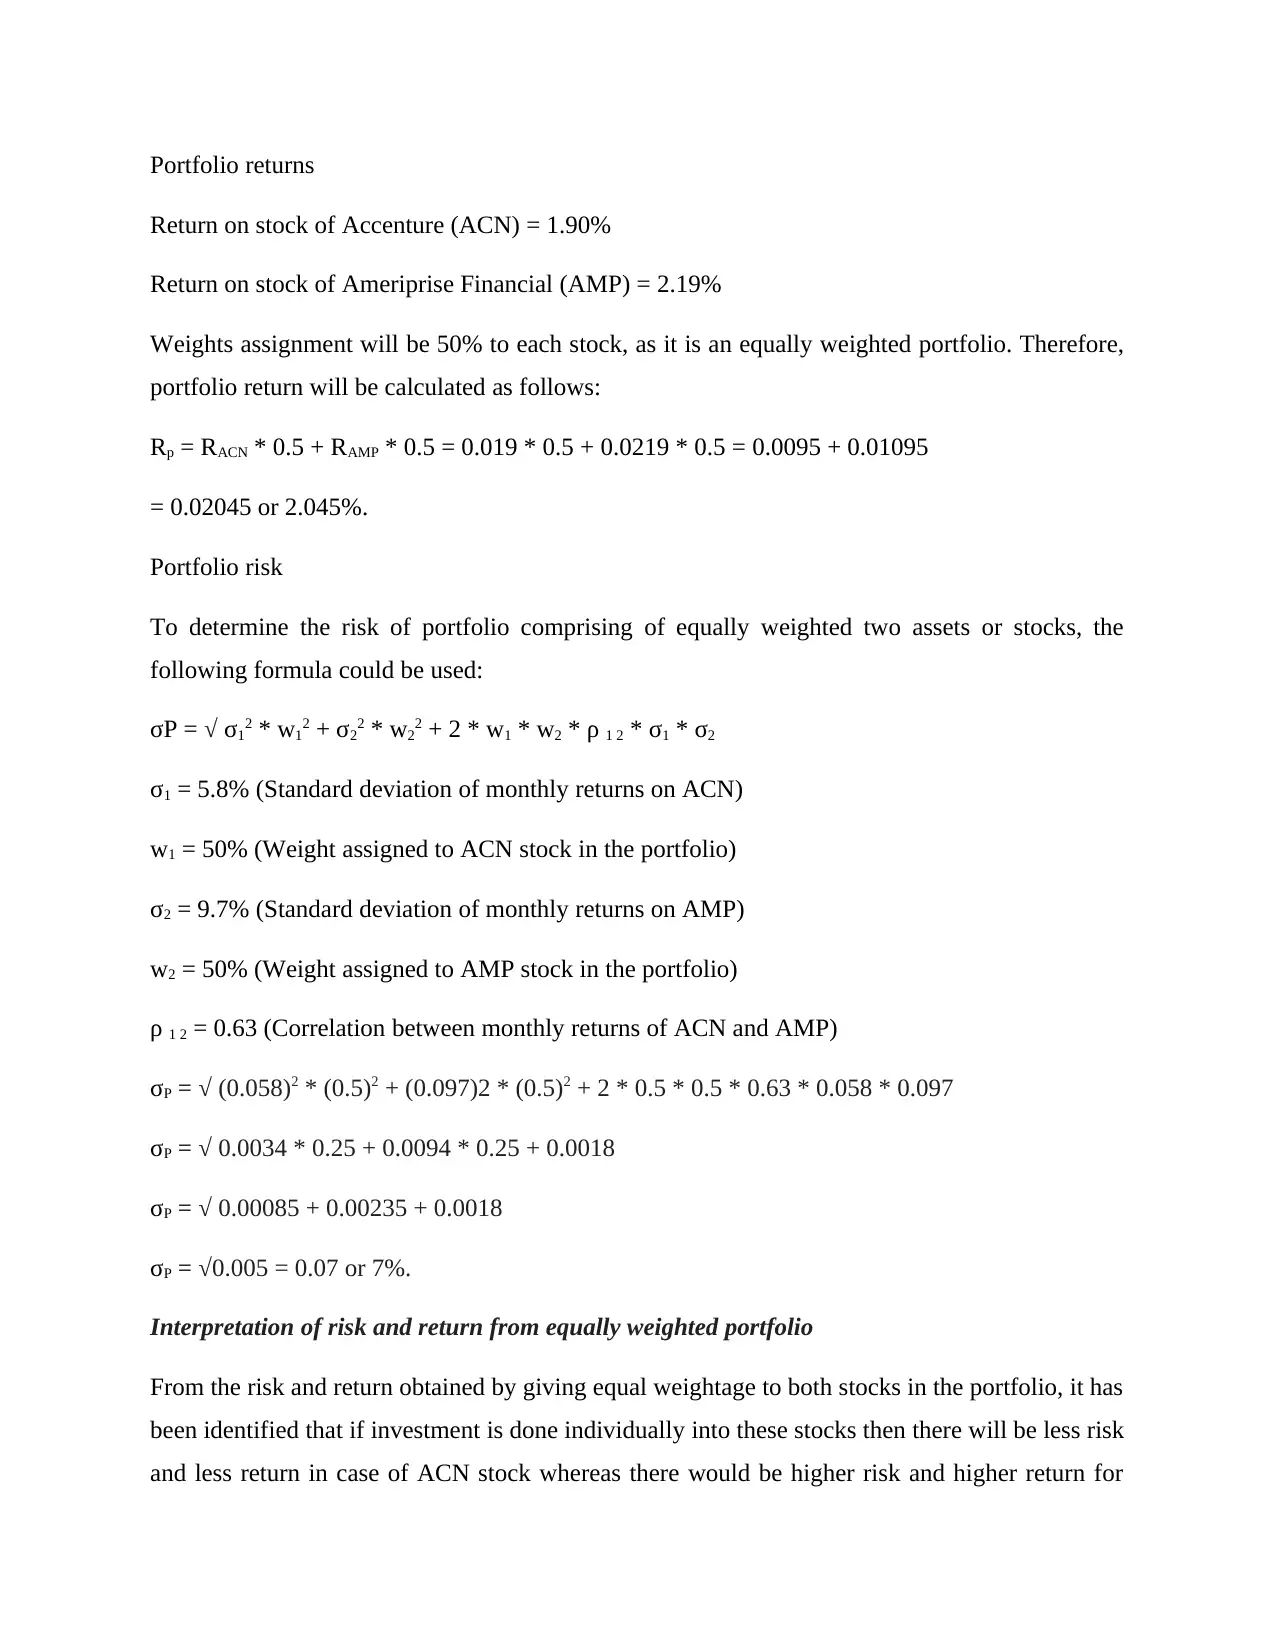
Portfolio returns
Return on stock of Accenture (ACN) = 1.90%
Return on stock of Ameriprise Financial (AMP) = 2.19%
Weights assignment will be 50% to each stock, as it is an equally weighted portfolio. Therefore,
portfolio return will be calculated as follows:
Rp = RACN * 0.5 + RAMP * 0.5 = 0.019 * 0.5 + 0.0219 * 0.5 = 0.0095 + 0.01095
= 0.02045 or 2.045%.
Portfolio risk
To determine the risk of portfolio comprising of equally weighted two assets or stocks, the
following formula could be used:
σP = √ σ12 * w12 + σ22 * w22 + 2 * w1 * w2 * ρ 1 2 * σ1 * σ2
σ1 = 5.8% (Standard deviation of monthly returns on ACN)
w1 = 50% (Weight assigned to ACN stock in the portfolio)
σ2 = 9.7% (Standard deviation of monthly returns on AMP)
w2 = 50% (Weight assigned to AMP stock in the portfolio)
ρ 1 2 = 0.63 (Correlation between monthly returns of ACN and AMP)
σP = √ (0.058)2 * (0.5)2 + (0.097)2 * (0.5)2 + 2 * 0.5 * 0.5 * 0.63 * 0.058 * 0.097
σP = √ 0.0034 * 0.25 + 0.0094 * 0.25 + 0.0018
σP = √ 0.00085 + 0.00235 + 0.0018
σP = √0.005 = 0.07 or 7%.
Interpretation of risk and return from equally weighted portfolio
From the risk and return obtained by giving equal weightage to both stocks in the portfolio, it has
been identified that if investment is done individually into these stocks then there will be less risk
and less return in case of ACN stock whereas there would be higher risk and higher return for
Paraphrase This Document
Need a fresh take? Get an instant paraphrase of this document with our AI Paraphraser
AMP stock (Fang, Tan and Wirjanto, 2019). However, by forming a portfolio of stocks, risks can
be diversified and at a lower risk of 7%, there would be approximately 2% returns that could be
generated by investing equally into each of the two stocks (Vamvakaris, Pantelous and Zuev,
2018). It can be seen that, if a risk averse investor who want to earn higher returns by taking
lower risks he can be go for investing forming portfolio of two stocks as higher risk attached
with AMP’s stock can be easily diversified through including different sector’s stock in the
portfolio.
Critical discussion of value of portfolio diversification
Portfolio diversification refers to the minimization of overall risk involved in the portfolio of
assets or stocks by making investment in different securities and asset classes. The most basic
purpose for which portfolio diversification is done is to reduce the risk associated with a specific
market segment or company (Narayan and Rehman, 2018). There are various benefits that could
be enjoyed by a risk averse investor by diversifying his portfolio such as impact of market
volatility and time spent on portfolio monitoring can be reduced along with taking advantage of
various investible instruments.
However, portfolio diversification has been criticized on various grounds such as it limits
higher returns associated with single security by including lower return security in the portfolio
as can be seen in the above case where ACN having comparatively lower returns than AMP has
been included in the portfolio (Li and et.al., 2019).
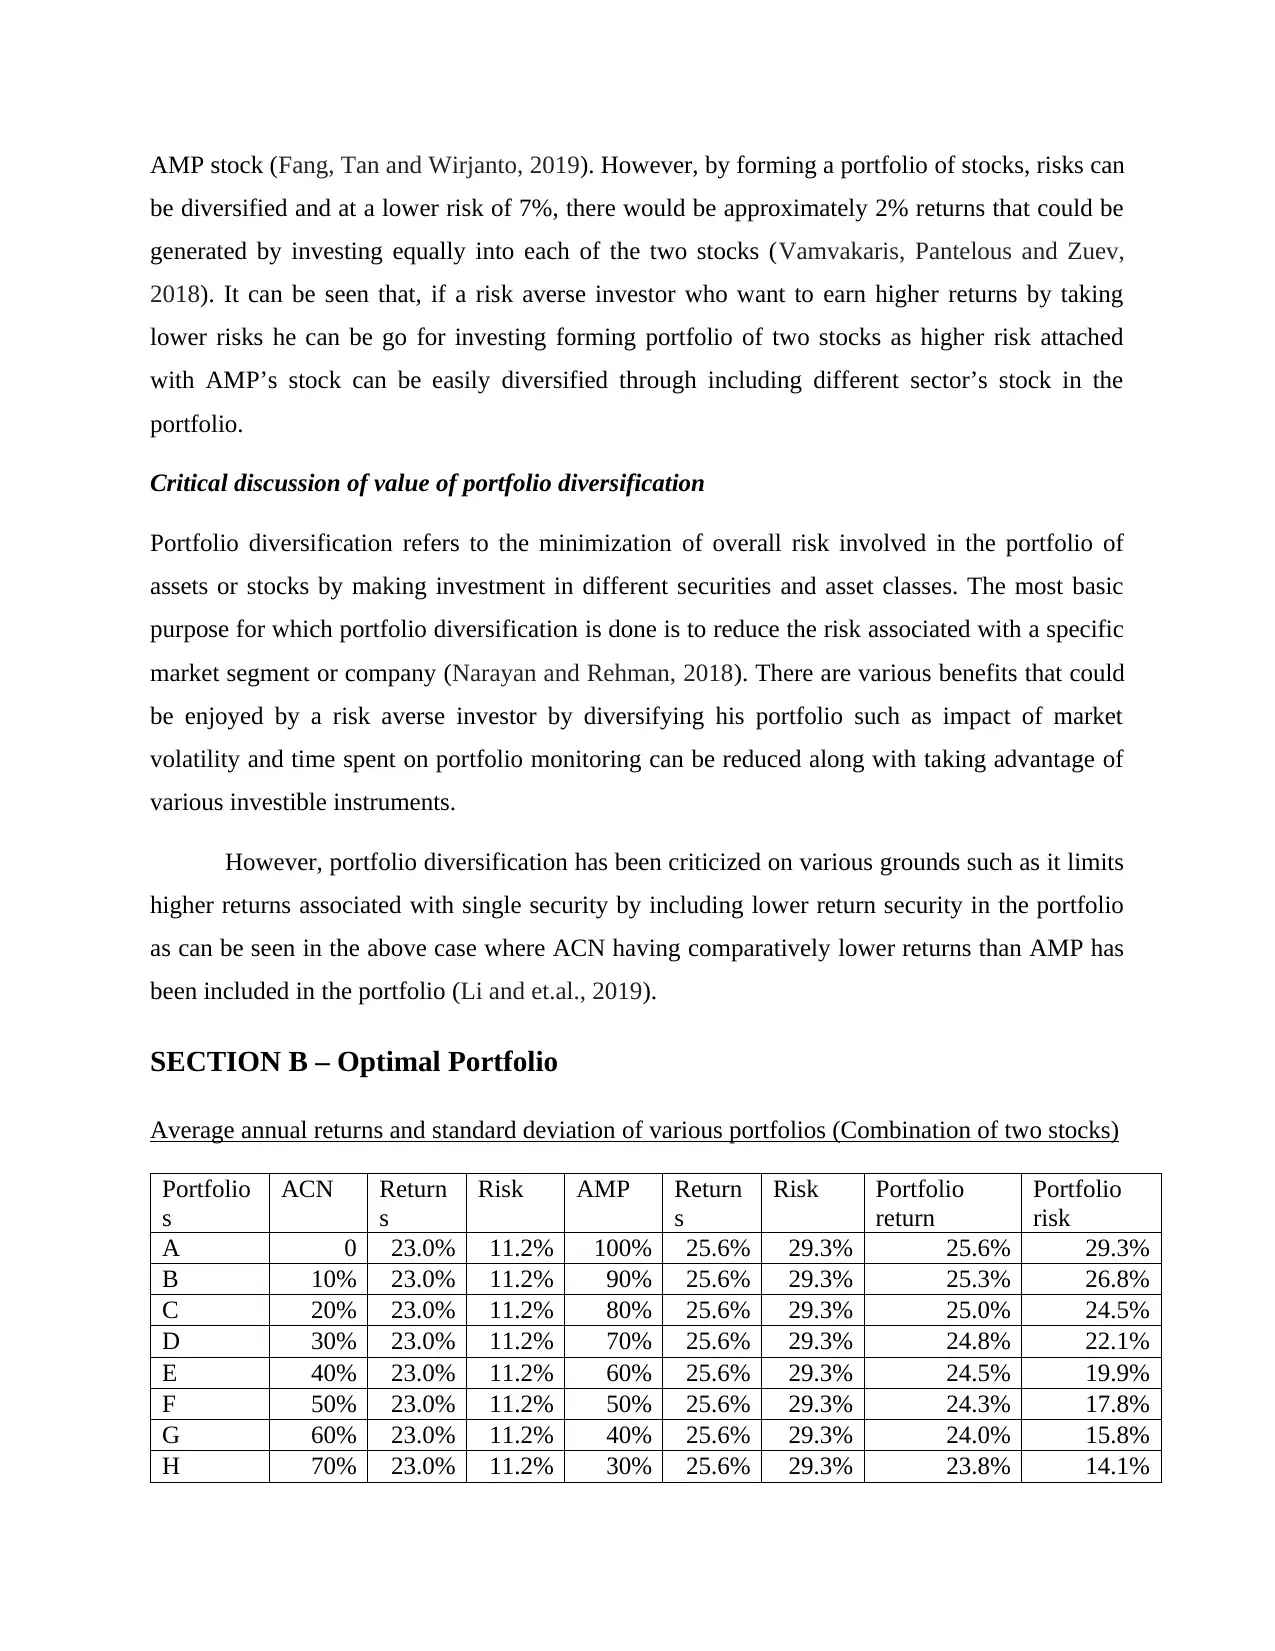
SECTION B – Optimal Portfolio
Average annual returns and standard deviation of various portfolios (Combination of two stocks)
Portfolio
s
ACN Return
s
Risk AMP Return
s
Risk Portfolio
return
Portfolio
risk
A 0 23.0% 11.2% 100% 25.6% 29.3% 25.6% 29.3%
B 10% 23.0% 11.2% 90% 25.6% 29.3% 25.3% 26.8%
C 20% 23.0% 11.2% 80% 25.6% 29.3% 25.0% 24.5%
D 30% 23.0% 11.2% 70% 25.6% 29.3% 24.8% 22.1%
E 40% 23.0% 11.2% 60% 25.6% 29.3% 24.5% 19.9%
F 50% 23.0% 11.2% 50% 25.6% 29.3% 24.3% 17.8%
G 60% 23.0% 11.2% 40% 25.6% 29.3% 24.0% 15.8%
H 70% 23.0% 11.2% 30% 25.6% 29.3% 23.8% 14.1%
be diversified and at a lower risk of 7%, there would be approximately 2% returns that could be
generated by investing equally into each of the two stocks (Vamvakaris, Pantelous and Zuev,
2018). It can be seen that, if a risk averse investor who want to earn higher returns by taking
lower risks he can be go for investing forming portfolio of two stocks as higher risk attached
with AMP’s stock can be easily diversified through including different sector’s stock in the
portfolio.
Critical discussion of value of portfolio diversification
Portfolio diversification refers to the minimization of overall risk involved in the portfolio of
assets or stocks by making investment in different securities and asset classes. The most basic
purpose for which portfolio diversification is done is to reduce the risk associated with a specific
market segment or company (Narayan and Rehman, 2018). There are various benefits that could
be enjoyed by a risk averse investor by diversifying his portfolio such as impact of market
volatility and time spent on portfolio monitoring can be reduced along with taking advantage of
various investible instruments.
However, portfolio diversification has been criticized on various grounds such as it limits
higher returns associated with single security by including lower return security in the portfolio
as can be seen in the above case where ACN having comparatively lower returns than AMP has
been included in the portfolio (Li and et.al., 2019).
SECTION B – Optimal Portfolio
Average annual returns and standard deviation of various portfolios (Combination of two stocks)
Portfolio
s
ACN Return
s
Risk AMP Return
s
Risk Portfolio
return
Portfolio
risk
A 0 23.0% 11.2% 100% 25.6% 29.3% 25.6% 29.3%
B 10% 23.0% 11.2% 90% 25.6% 29.3% 25.3% 26.8%
C 20% 23.0% 11.2% 80% 25.6% 29.3% 25.0% 24.5%
D 30% 23.0% 11.2% 70% 25.6% 29.3% 24.8% 22.1%
E 40% 23.0% 11.2% 60% 25.6% 29.3% 24.5% 19.9%
F 50% 23.0% 11.2% 50% 25.6% 29.3% 24.3% 17.8%
G 60% 23.0% 11.2% 40% 25.6% 29.3% 24.0% 15.8%
H 70% 23.0% 11.2% 30% 25.6% 29.3% 23.8% 14.1%
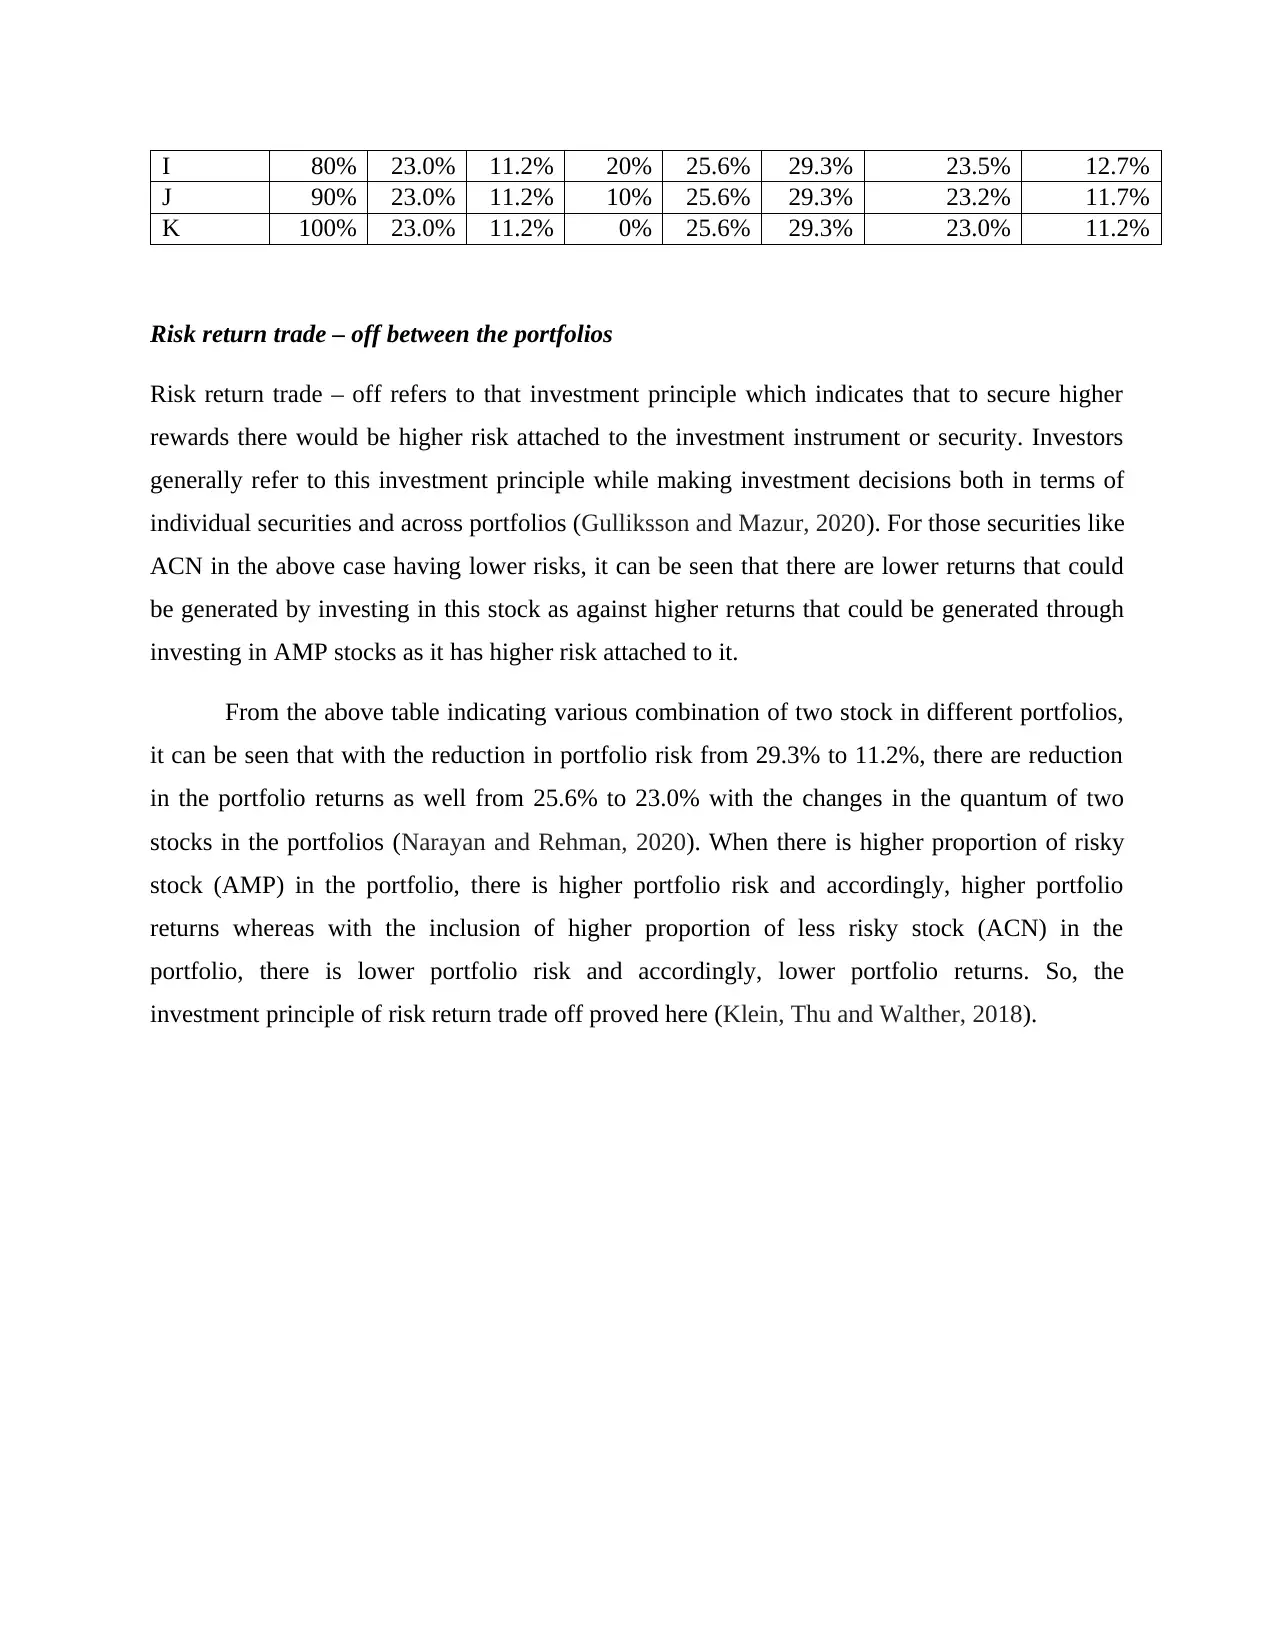
I 80% 23.0% 11.2% 20% 25.6% 29.3% 23.5% 12.7%
J 90% 23.0% 11.2% 10% 25.6% 29.3% 23.2% 11.7%
K 100% 23.0% 11.2% 0% 25.6% 29.3% 23.0% 11.2%
Risk return trade – off between the portfolios
Risk return trade – off refers to that investment principle which indicates that to secure higher
rewards there would be higher risk attached to the investment instrument or security. Investors
generally refer to this investment principle while making investment decisions both in terms of
individual securities and across portfolios (Gulliksson and Mazur, 2020). For those securities like
ACN in the above case having lower risks, it can be seen that there are lower returns that could
be generated by investing in this stock as against higher returns that could be generated through
investing in AMP stocks as it has higher risk attached to it.
From the above table indicating various combination of two stock in different portfolios,
it can be seen that with the reduction in portfolio risk from 29.3% to 11.2%, there are reduction
in the portfolio returns as well from 25.6% to 23.0% with the changes in the quantum of two
stocks in the portfolios (Narayan and Rehman, 2020). When there is higher proportion of risky
stock (AMP) in the portfolio, there is higher portfolio risk and accordingly, higher portfolio
returns whereas with the inclusion of higher proportion of less risky stock (ACN) in the
portfolio, there is lower portfolio risk and accordingly, lower portfolio returns. So, the
investment principle of risk return trade off proved here (Klein, Thu and Walther, 2018).
⊘ This is a preview!⊘
Do you want full access?
Subscribe today to unlock all pages.
Trusted by 1+ million students worldwide
1 2 3 4 5 6 7 8 9 10 11
0.0%
5.0%
10.0%
15.0%
20.0%
25.0%
30.0%
35.0%
Risk Return trade off
Portfolio return Portfolio risk
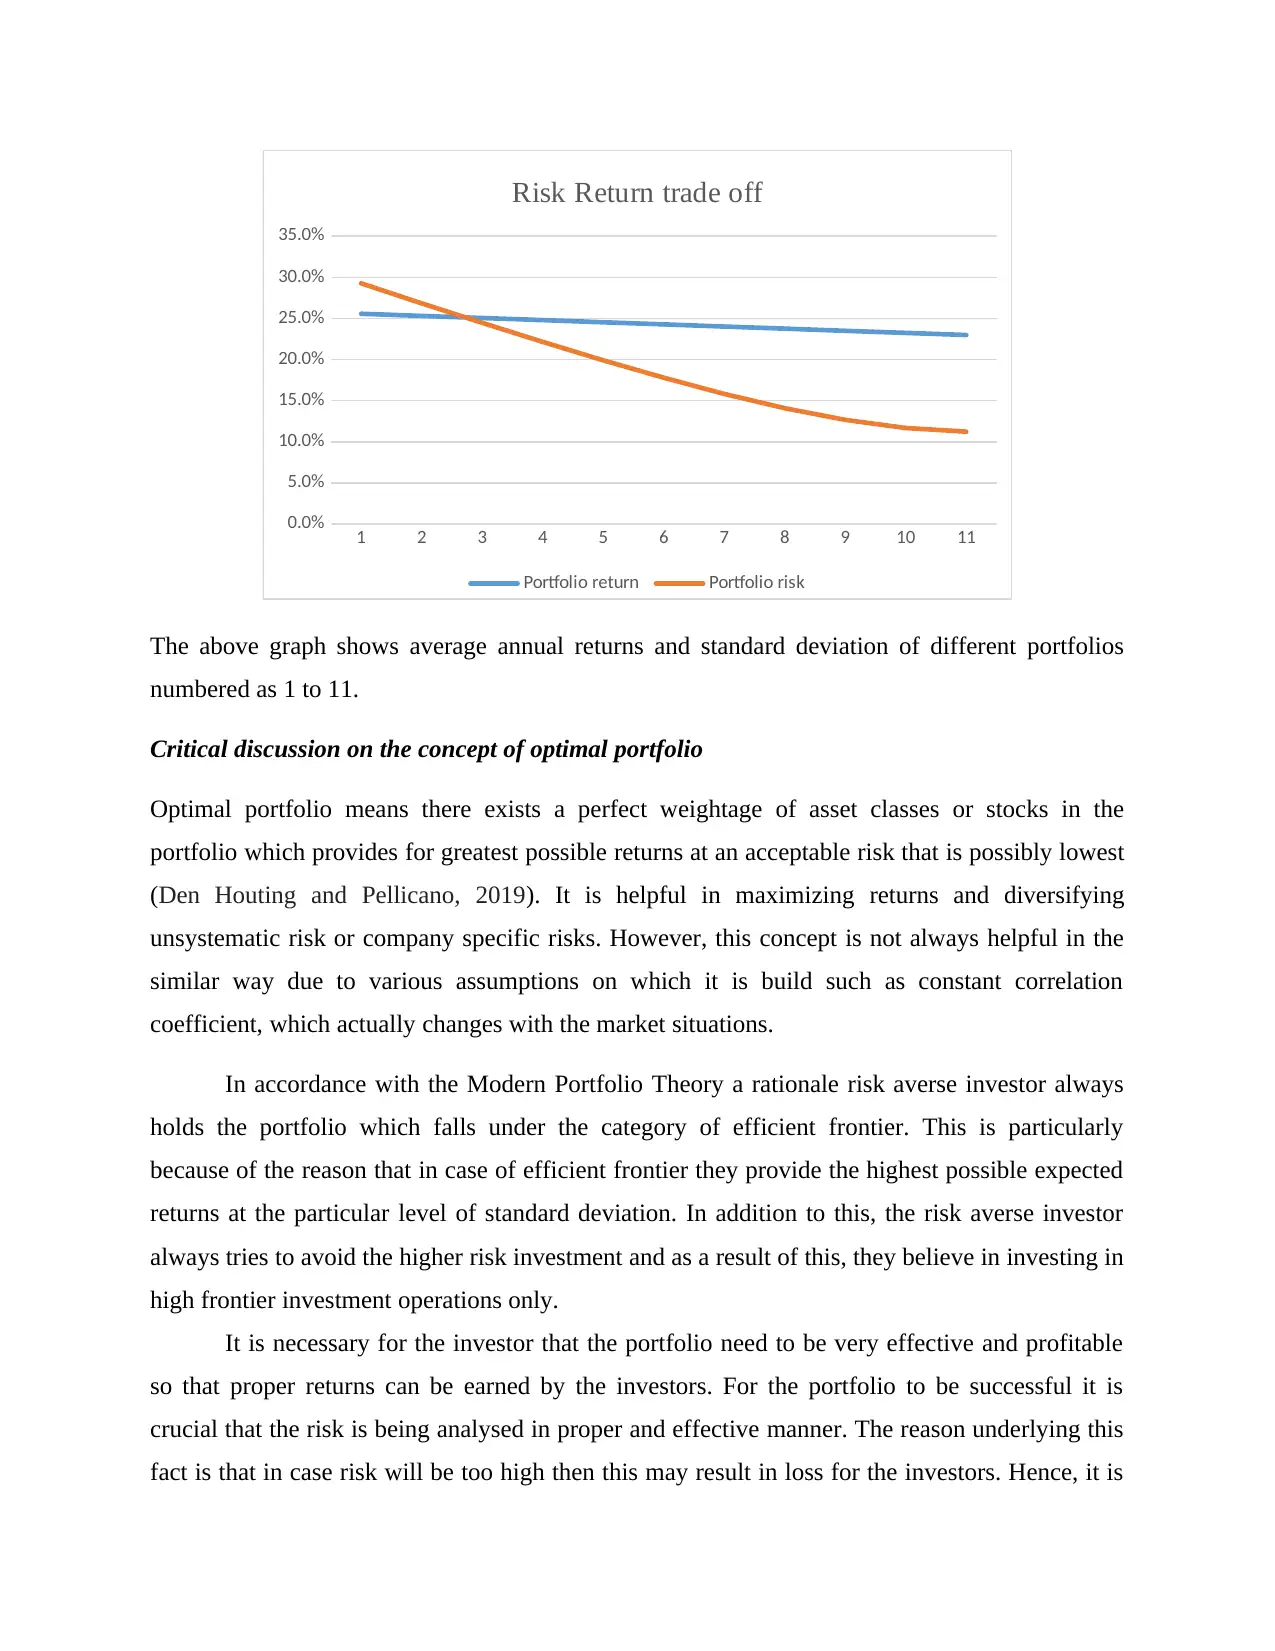
The above graph shows average annual returns and standard deviation of different portfolios
numbered as 1 to 11.
Critical discussion on the concept of optimal portfolio
Optimal portfolio means there exists a perfect weightage of asset classes or stocks in the
portfolio which provides for greatest possible returns at an acceptable risk that is possibly lowest
(Den Houting and Pellicano, 2019). It is helpful in maximizing returns and diversifying
unsystematic risk or company specific risks. However, this concept is not always helpful in the
similar way due to various assumptions on which it is build such as constant correlation
coefficient, which actually changes with the market situations.
In accordance with the Modern Portfolio Theory a rationale risk averse investor always
holds the portfolio which falls under the category of efficient frontier. This is particularly
because of the reason that in case of efficient frontier they provide the highest possible expected
returns at the particular level of standard deviation. In addition to this, the risk averse investor
always tries to avoid the higher risk investment and as a result of this, they believe in investing in
high frontier investment operations only.
It is necessary for the investor that the portfolio need to be very effective and profitable
so that proper returns can be earned by the investors. For the portfolio to be successful it is
crucial that the risk is being analysed in proper and effective manner. The reason underlying this
fact is that in case risk will be too high then this may result in loss for the investors. Hence, it is
0.0%
5.0%
10.0%
15.0%
20.0%
25.0%
30.0%
35.0%
Risk Return trade off
Portfolio return Portfolio risk
The above graph shows average annual returns and standard deviation of different portfolios
numbered as 1 to 11.
Critical discussion on the concept of optimal portfolio
Optimal portfolio means there exists a perfect weightage of asset classes or stocks in the
portfolio which provides for greatest possible returns at an acceptable risk that is possibly lowest
(Den Houting and Pellicano, 2019). It is helpful in maximizing returns and diversifying
unsystematic risk or company specific risks. However, this concept is not always helpful in the
similar way due to various assumptions on which it is build such as constant correlation
coefficient, which actually changes with the market situations.
In accordance with the Modern Portfolio Theory a rationale risk averse investor always
holds the portfolio which falls under the category of efficient frontier. This is particularly
because of the reason that in case of efficient frontier they provide the highest possible expected
returns at the particular level of standard deviation. In addition to this, the risk averse investor
always tries to avoid the higher risk investment and as a result of this, they believe in investing in
high frontier investment operations only.
It is necessary for the investor that the portfolio need to be very effective and profitable
so that proper returns can be earned by the investors. For the portfolio to be successful it is
crucial that the risk is being analysed in proper and effective manner. The reason underlying this
fact is that in case risk will be too high then this may result in loss for the investors. Hence, it is
Paraphrase This Document
Need a fresh take? Get an instant paraphrase of this document with our AI Paraphraser
very crucial for them to ensure that the risk involved within the portfolio falls under the category
of tolerance so that profitability is not affected to a great extent.
SECTION C – Cost of Capital
Estimation of equity cost of capital
Equity cost of capital of capital of ACN
Beta of the stock = 1.13
Risk free rate of return = 1.46%
Average monthly return of stock = 1.9%
Formula = Risk free return + [Beta * (Average stock return – risk free return)]
Equity cost of capital = 1.46% + [1.13 * (1.9% – 1.46%)] = 1.46% + 0.4972 = 1.9572%
Equity cost of capital of capital of AMP
Beta of the stock = 1.61
Risk free rate of return = 1.46%
Average monthly return of stock = 2.19%
Equity cost of capital = 1.46% + [1.61 * (2.19% – 1.46%)] = 1.46% + 1.1753 = 2.6353%
The weighted average cost of capital is defined as the average of all the cost relating to
external funding which company uses in order to operate. This is very important for the company
because in case the capital will not be taken in proper manner then this will be affecting the
working efficiency of the company. Thus, according to Steffen (2020) the primary driver of
WACC that is weighted average cost of capital is cost of equity and the cost of debt. In addition
to this, there are many different types of factors which can affect the WACC to a great extent.
This is particularly because of the reason that cost is being defined by the market rate and it is
not necessary that the cost of capital is static because there are many changes within the external
environment.
In addition to this cost, another key driver of WACC is that economic condition. This is
also a driver of WACC because in case the economic condition is not good and there is increase
in interest rate. As per the views of Vartiainen and et.al., (2020) then this will result in increase
in cost of debt which in turn will increase overall cost of capital for the company. Hence, it is
necessary for the both the companies that is Accenture and Ameriprise Financial to take of the
economic condition before finalising the balance of both equity and debt. In case the interest rate
will be low then companies can take more debt at lower rate and this will result in increase in
balance of debt within the company.
Along with this another driver of cost of capital is the market condition that is inflation of
recession. In case there is inflation then all the working of the company will be affected as
everything will be having high cost. Thus, for getting successful both the companies need to
analyse all the drivers in better way so that proper decision can be taken.
CONCLUSION
From the above report it has been concluded that by forming a portfolio of stock
belonging from different sectors, a risk averse investor can be benefitted from maximum returns
and minimum risks. In this report, it has been evaluated that how by equally weighing stocks
from different sectors higher returns could be generated at a lower acceptable risk as against
investing individually in single stocks which results in comparatively higher risks and lower
returns as a whole. Also, it has been evaluated that how by optimally weighing different stocks in
the portfolio higher returns could be ensured at a minimum possible risks through following risk
return trade off principle of investment. At last, equity cost of capital has been estimated for the
stocks of two different sector that is ACN from IT sector and AMP from financial sector which
are listed companies on S&P 500 index along with discussing various drivers of firm’s WACC.
⊘ This is a preview!⊘
Do you want full access?
Subscribe today to unlock all pages.
Trusted by 1+ million students worldwide
REFERENCES
Balcilar, M., Ozdemir, Z. A. and Ozdemir, H., 2021. Dynamic return and volatility spillovers
among S&P 500, crude oil, and gold. International Journal of Finance & Economics, 26(1),
pp.153-170.
Den Houting, J. and Pellicano, E., 2019. A portfolio analysis of autism research funding in
Australia, 2008–2017. Journal of autism and developmental disorders, 49(11),
pp.4400-4408.
Fang, M., Tan, K. S. and Wirjanto, T. S., 2019. Sustainable portfolio management under climate
change. Journal of Sustainable Finance & Investment, 9(1), pp.45-67.
Gulliksson, M. and Mazur, S., 2020. An iterative approach to ill-conditioned optimal portfolio
selection. Computational Economics, 56(4), pp.773-794.
Klein, T., Thu, H. P. and Walther, T., 2018. Bitcoin is not the New Gold–A comparison of
volatility, correlation, and portfolio performance. International Review of Financial
Analysis, 59, pp.105-116.
Li, Y., and et.al., 2019. Portfolio optimization based on network topology. Physica A: Statistical
Mechanics and its Applications, 515, pp.671-681.
Narayan, S. and Rehman, M. U., 2020. International portfolio strategies and opportunities: the
case of the US, Japan and Asia. Finance Research Letters, 37, p.101358.
Narayan, S. W. and Rehman, M. U., 2018. Portfolio diversification opportunities within
emerging and frontier stock markets: evidence from ten Asian countries. Buletin
Ekonomi Moneter dan Perbankan, 21(1), pp.1-22.
Steffen, B., 2020. Estimating the cost of capital for renewable energy projects. Energy
Economics. 88. p.104783.
Vamvakaris, M. D., Pantelous, A. A. and Zuev, K. M., 2018. Time series analysis of S&P 500
index: A horizontal visibility graph approach. Physica A: Statistical Mechanics and its
Applications, 497, pp.41-51.
Paraphrase This Document
Need a fresh take? Get an instant paraphrase of this document with our AI Paraphraser

Vartiainen, E., and et.al., 2020. Impact of weighted average cost of capital, capital expenditure,
and other parameters on future utility‐scale PV levelised cost of electricity. Progress in
photovoltaics: research and applications. 28(6). pp.439-453.
and other parameters on future utility‐scale PV levelised cost of electricity. Progress in
photovoltaics: research and applications. 28(6). pp.439-453.
1 out of 11
Related Documents


Your All-in-One AI-Powered Toolkit for Academic Success.
+13062052269
info@desklib.com
Available 24*7 on WhatsApp / Email
![[object Object]](/_next/static/media/star-bottom.7253800d.svg)
Unlock your academic potential
Copyright © 2020–2026 A2Z Services. All Rights Reserved. Developed and managed by ZUCOL.