Portfolio Management: Investment Strategy, Risk & Return Analysis
VerifiedAdded on 2023/06/12
|28
|6460
|199
Report
AI Summary
This report provides a detailed analysis of portfolio management and theory, focusing on developing an optimal portfolio for Jack and Gloria to support their retirement expenses. It includes an investment policy statement, evaluating their risk and return objectives, and considering investment constraints. The report analyzes various ASX market indices to identify suitable stocks, examines momentum trading strategies, and conducts a top-down analysis of Telstra and AGL, considering economic and industry factors. The findings suggest that a combination of ASX200I, ASXM50I, and S&PCOMP stocks could provide adequate returns, while cautioning against momentum trading strategies and investments in the energy and telecommunication sectors due to volatility.
Running head: PORTFOLIO MANAGEMENT AND THEORY
Portfolio Management and Theory
Name of the Student:
Name of the University:
Authors Note:
Portfolio Management and Theory
Name of the Student:
Name of the University:
Authors Note:
Paraphrase This Document
Need a fresh take? Get an instant paraphrase of this document with our AI Paraphraser
PORTFOLIO MANAGEMENT AND THEORY
1
Table of Contents
Executive Summary:..................................................................................................................3
Introduction:...............................................................................................................................4
Part 1 Investment policy Statement:..........................................................................................4
1.1 Return objective:..................................................................................................................4
1.2 Risk objective:......................................................................................................................5
1.3 Investment constraints:.........................................................................................................5
1.4 Standards for performance evaluation:................................................................................6
1.5 Analysis of market indices:..................................................................................................6
1.5.1 Providing summary statistics and analysing the performance, while discussing the role
of each asset class:.....................................................................................................................6
1.5.2 Evaluating the risk and return provisions of the security market indices:........................7
1.6 Recommendations:...............................................................................................................9
Part 2 Active Portfolio:..............................................................................................................9
2.1 Research on momentum strategies:......................................................................................9
2.2 Portfolio construction:........................................................................................................11
2.3 Analysis of the portfolio performance:..............................................................................14
2.3.1 Identifying whether winner stock outperform past loser stocks on average:..................14
2.3.2 Stating whether winner stock outperform average return of the 100 stocks:..................14
2.3.3 Recommending whether momentum strategy is good based on the analysis:................15
2.3.4 Changing he weightage calculation for detecting the change in performance of the
portfolio:...................................................................................................................................15
Part 3 Top-Down Analysis:......................................................................................................17
3.1 Economic Analysis:...........................................................................................................17
3.2 Industry Analysis:..............................................................................................................19

PORTFOLIO MANAGEMENT AND THEORY
2
3.3 Security Outlook:...............................................................................................................21
Conclusion:..............................................................................................................................22
Reference and Bibliography:....................................................................................................24
⊘ This is a preview!⊘
Do you want full access?
Subscribe today to unlock all pages.
Trusted by 1+ million students worldwide
PORTFOLIO MANAGEMENT AND THEORY
3
Executive Summary:
The report directly focuses on detecting the adequate portfolio for Jack and Gloria, which
could eventually help them to generate higher rate of returns from investment to support their
retirement expenses. the relevant evaluation is conducted on different risk and return
attributes of Gloria and Jack to identify the minimum returns requirement and risk viability to
support the investment scope. the analysis of different sectors of ASX index is conducted,
which relatively helps in identifying the stocks that could be taken into consideration for
improving profitability of the superannuation fund. The advantages and disadvantages of
momentum analysis is also conducted to identify the minimum level of returns that could be
generated from an investment. however, the analysis of momentum trading strategy depicted
a negative Outlook, which relatively indicates that the ignorance of the trading strategy is
much more profitable for the investors, as it does not evaluate the stocks on the basis of
value. The different significant valuation of the momentum analysis is being conducted by
deriving different portfolios, which could support the recommendations for Jack and Gloria.
Furthermore, the evaluation of Telstra and AGL with the industry and country analysis
relatively indicate a low investment opportunity for the investors on the companies due to the
high volatility in effective. This relatively represents that ignoring the current investments
and energy and telecommunication sector would eventually allow the investors to generate
higher rate of returns from investment.
Paraphrase This Document
Need a fresh take? Get an instant paraphrase of this document with our AI Paraphraser
PORTFOLIO MANAGEMENT AND THEORY
4
Introduction:
The overall assessment focuses on identifying the overall portfolio for Jack and
Gloria, which could help them through the superannuation period. In addition, the investment
policy statement of Jack and Gloria is mainly conducted in the assessment to identify the
return and risk attributes of the individuals. In addition, the evaluation of investment return is
conducted while identifying the standard got performance evaluation. Moreover, analysis of
the market indices is conducted to identify the performance of different asset classes listed in
ASX index. The portfolio construction is also conducted with the help of momentum analysis
to identify the best possible investment stocks for Jack and Gloria. Lastly, the security
analysis is mainly conducted on Telstra and AGL, while evaluating the economic and sundry
conduction in which the organisation was operating.
Part 1 Investment policy Statement:
1.1 Return objective:
The main objective of the investment policy statement is to generate adequate return
for supporting the retirement fund of Jack and Gloria. In addition, Jack and Gloria wants to
grow their current superannuation fund by inputting new financial instruments that is present
within the Australian stock market. The return needs to be calculated based on expenses,
which will Jack and Gloria incur after the retirement. The main retirement age for both the
couples is at the age of 65 years, where there will be no expenses regarding Mortgage
payments, as the loan would eventually mature in 30 years. The minimum return of $18,000
needs to be earned by the couple for supporting their expenses after retirement.
PORTFOLIO MANAGEMENT AND THEORY
5
1.2 Risk objective:
The current superannuation portfolio that is maintained by Andrews is a Growth
Fund, which relatively increases the returns and grows portfolio fund in future. This
maintenance of Growth Fund mainly forces the individual to invest 85% of the overall
investments in growth assets, while the 15% will be invested in defensive assets. This
composition of the Growth Fund would eventually help in minimizing the risk attributes of
the portfolio. Moreover, the use of Growth Fund could eventually allow the couple to
generate the required funds to support their expenses after retirement.
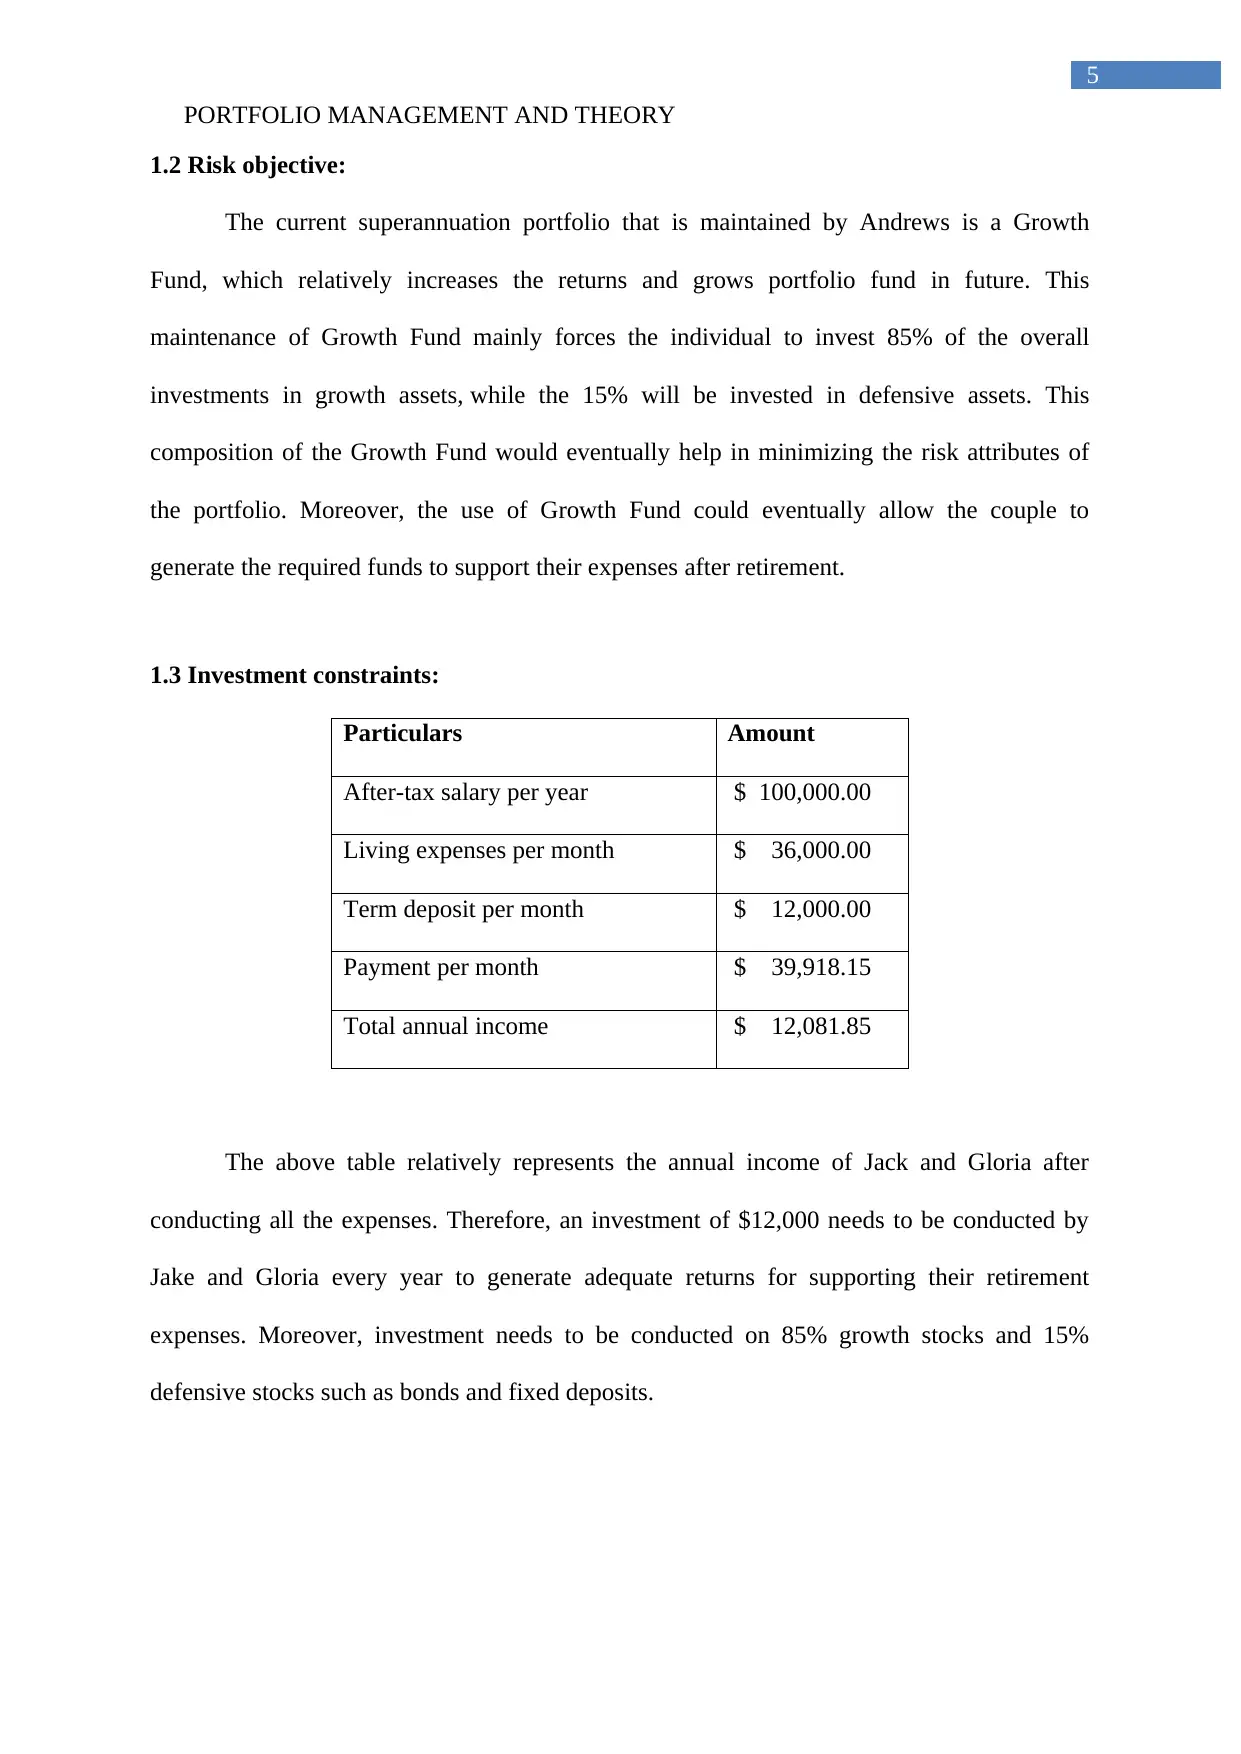
1.3 Investment constraints:
Particulars Amount
After-tax salary per year $ 100,000.00
Living expenses per month $ 36,000.00
Term deposit per month $ 12,000.00
Payment per month $ 39,918.15
Total annual income $ 12,081.85
The above table relatively represents the annual income of Jack and Gloria after
conducting all the expenses. Therefore, an investment of $12,000 needs to be conducted by
Jake and Gloria every year to generate adequate returns for supporting their retirement
expenses. Moreover, investment needs to be conducted on 85% growth stocks and 15%
defensive stocks such as bonds and fixed deposits.
5
1.2 Risk objective:
The current superannuation portfolio that is maintained by Andrews is a Growth
Fund, which relatively increases the returns and grows portfolio fund in future. This
maintenance of Growth Fund mainly forces the individual to invest 85% of the overall
investments in growth assets, while the 15% will be invested in defensive assets. This
composition of the Growth Fund would eventually help in minimizing the risk attributes of
the portfolio. Moreover, the use of Growth Fund could eventually allow the couple to
generate the required funds to support their expenses after retirement.
1.3 Investment constraints:
Particulars Amount
After-tax salary per year $ 100,000.00
Living expenses per month $ 36,000.00
Term deposit per month $ 12,000.00
Payment per month $ 39,918.15
Total annual income $ 12,081.85
The above table relatively represents the annual income of Jack and Gloria after
conducting all the expenses. Therefore, an investment of $12,000 needs to be conducted by
Jake and Gloria every year to generate adequate returns for supporting their retirement
expenses. Moreover, investment needs to be conducted on 85% growth stocks and 15%
defensive stocks such as bonds and fixed deposits.
⊘ This is a preview!⊘
Do you want full access?
Subscribe today to unlock all pages.
Trusted by 1+ million students worldwide
PORTFOLIO MANAGEMENT AND THEORY
6
1.4 Standards for performance evaluation:
After identifying the return address requirements of Jake and Gloria the overall
standard performance evaluation can be identified. The portfolio that needs be created for the
couple will provide Adequate Returns, which would eventually help in growing the portfolio
value. The stocks selected for the portfolio needs to provide a continuous growth and return,
which is why the momentum analysis is needed. This would eventually segregate the stocks
that have Momentum with the stocks that do not have Momentum in their price action. The
stocks with positive Momentum will mainly be added to the portfolio for generating higher
rate of returns from investment.
1.5 Analysis of market indices:
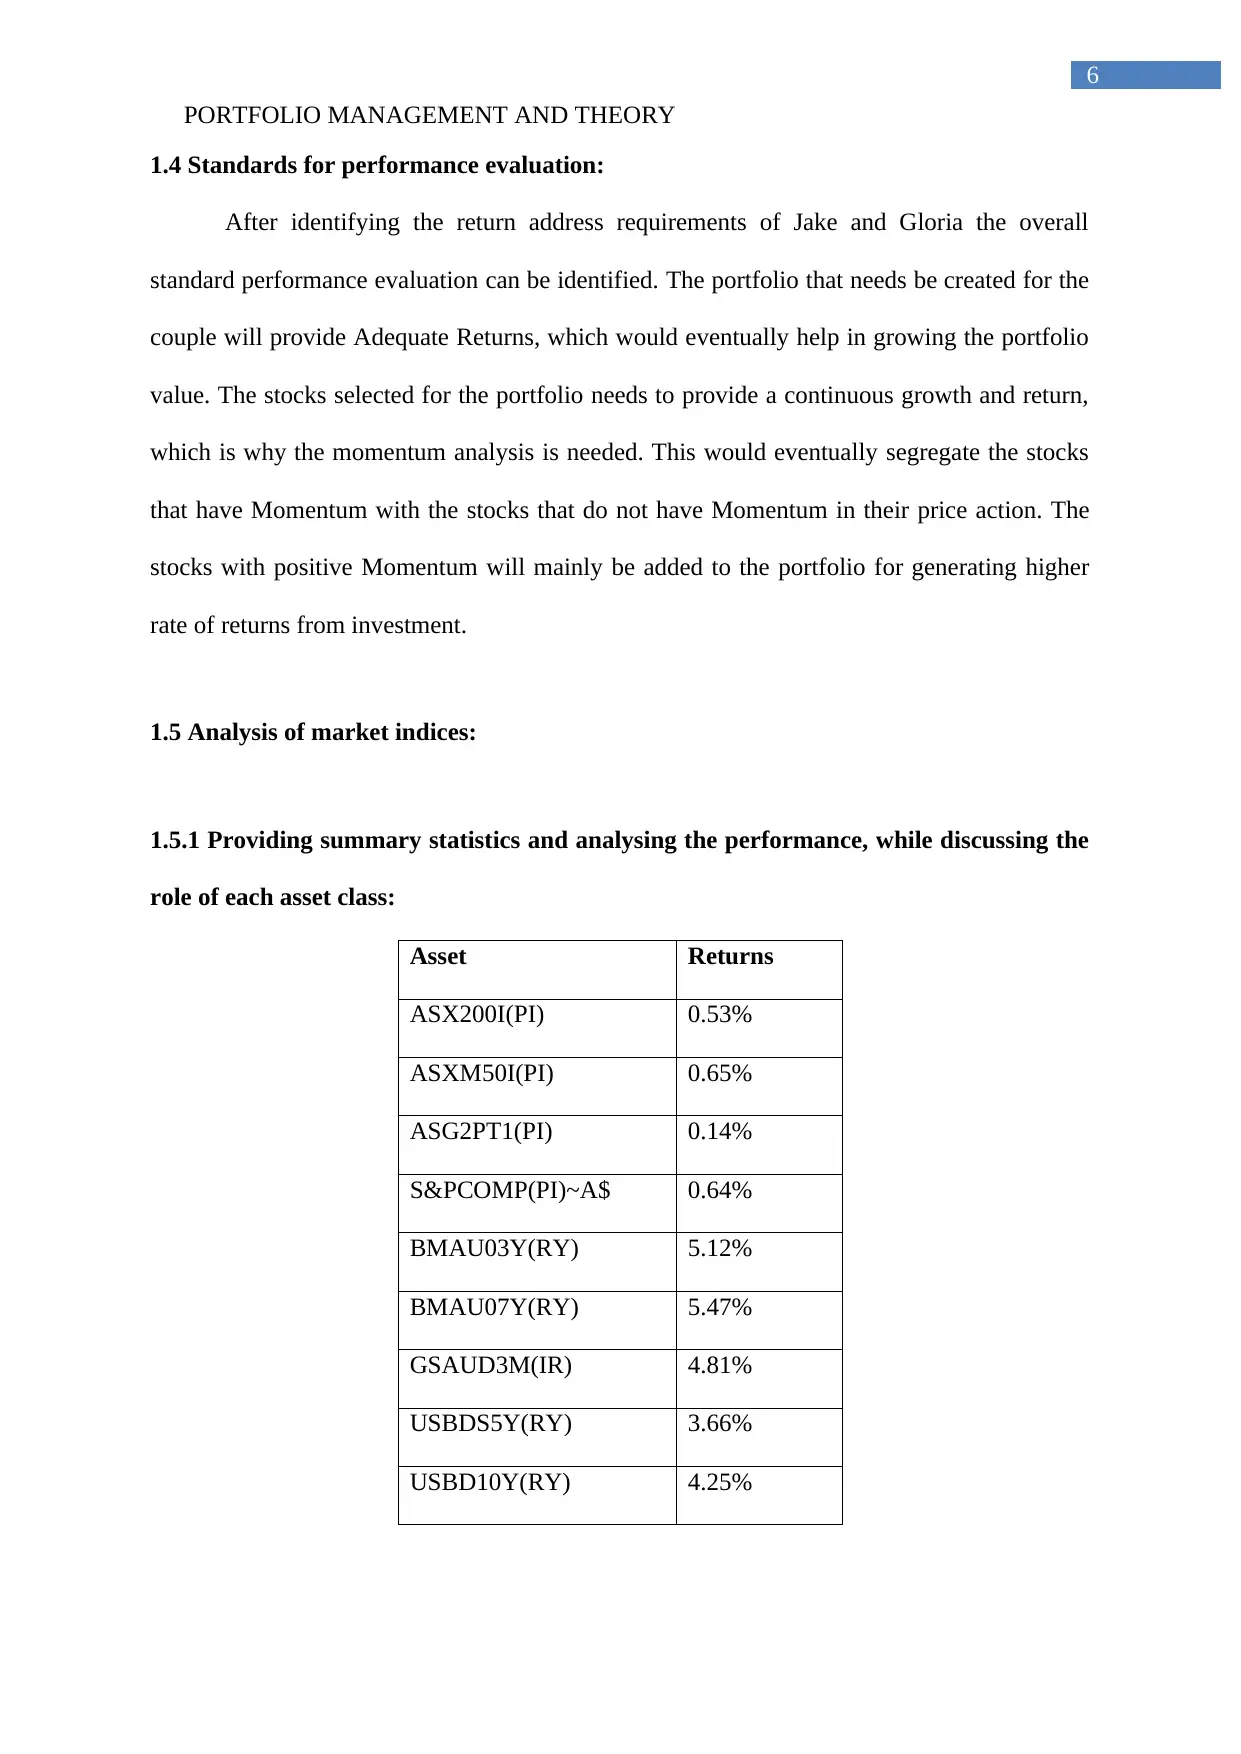
1.5.1 Providing summary statistics and analysing the performance, while discussing the
role of each asset class:
Asset Returns
ASX200I(PI) 0.53%
ASXM50I(PI) 0.65%
ASG2PT1(PI) 0.14%
S&PCOMP(PI)~A$ 0.64%
BMAU03Y(RY) 5.12%
BMAU07Y(RY) 5.47%
GSAUD3M(IR) 4.81%
USBDS5Y(RY) 3.66%
USBD10Y(RY) 4.25%
6
1.4 Standards for performance evaluation:
After identifying the return address requirements of Jake and Gloria the overall
standard performance evaluation can be identified. The portfolio that needs be created for the
couple will provide Adequate Returns, which would eventually help in growing the portfolio
value. The stocks selected for the portfolio needs to provide a continuous growth and return,
which is why the momentum analysis is needed. This would eventually segregate the stocks
that have Momentum with the stocks that do not have Momentum in their price action. The
stocks with positive Momentum will mainly be added to the portfolio for generating higher
rate of returns from investment.
1.5 Analysis of market indices:
1.5.1 Providing summary statistics and analysing the performance, while discussing the
role of each asset class:
Asset Returns
ASX200I(PI) 0.53%
ASXM50I(PI) 0.65%
ASG2PT1(PI) 0.14%
S&PCOMP(PI)~A$ 0.64%
BMAU03Y(RY) 5.12%
BMAU07Y(RY) 5.47%
GSAUD3M(IR) 4.81%
USBDS5Y(RY) 3.66%
USBD10Y(RY) 4.25%
Paraphrase This Document
Need a fresh take? Get an instant paraphrase of this document with our AI Paraphraser
PORTFOLIO MANAGEMENT AND THEORY
7
And the overall evaluation performance of S&PCOMP(PI)~A$, ASXM50I(PI) and
ASX200I(PI) is identified to be the highest among the Asset class. However, the equity
section and bond section are a relevant part of the portfolio, as it helps in divesting the risky
stocks, while improving the returns from investment. Equity class a relatively provides high
growth and return generation capacity to the investors while having higher risk involvement
in Investments. However, the bond and treasury class a relatively provide a stable returns
with no risk, which in turn helps the investors to minimize the risk in their portfolio while
generating higher returns from investment (Szego, 2014).
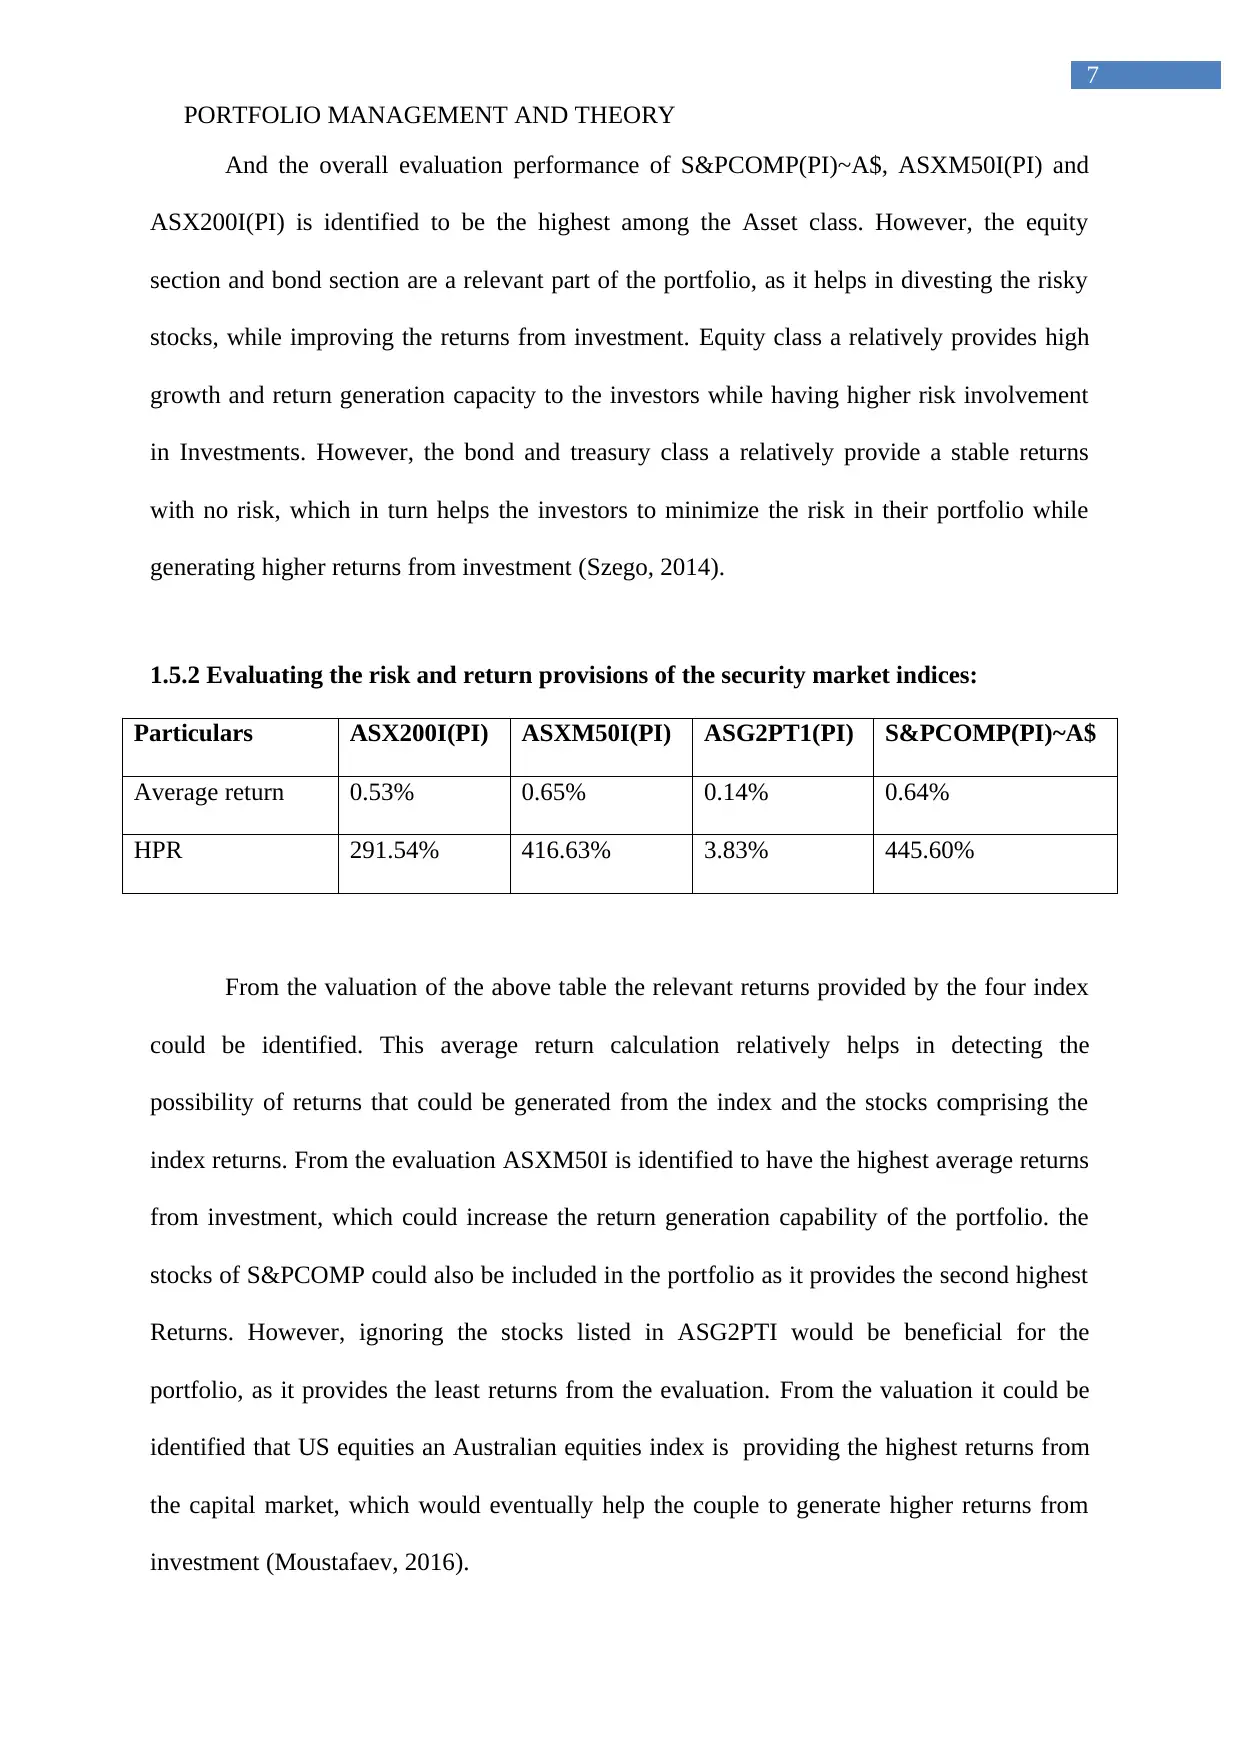
1.5.2 Evaluating the risk and return provisions of the security market indices:
Particulars ASX200I(PI) ASXM50I(PI) ASG2PT1(PI) S&PCOMP(PI)~A$
Average return 0.53% 0.65% 0.14% 0.64%
HPR 291.54% 416.63% 3.83% 445.60%
From the valuation of the above table the relevant returns provided by the four index
could be identified. This average return calculation relatively helps in detecting the
possibility of returns that could be generated from the index and the stocks comprising the
index returns. From the evaluation ASXM50I is identified to have the highest average returns
from investment, which could increase the return generation capability of the portfolio. the
stocks of S&PCOMP could also be included in the portfolio as it provides the second highest
Returns. However, ignoring the stocks listed in ASG2PTI would be beneficial for the
portfolio, as it provides the least returns from the evaluation. From the valuation it could be
identified that US equities an Australian equities index is providing the highest returns from
the capital market, which would eventually help the couple to generate higher returns from
investment (Moustafaev, 2016).
7
And the overall evaluation performance of S&PCOMP(PI)~A$, ASXM50I(PI) and
ASX200I(PI) is identified to be the highest among the Asset class. However, the equity
section and bond section are a relevant part of the portfolio, as it helps in divesting the risky
stocks, while improving the returns from investment. Equity class a relatively provides high
growth and return generation capacity to the investors while having higher risk involvement
in Investments. However, the bond and treasury class a relatively provide a stable returns
with no risk, which in turn helps the investors to minimize the risk in their portfolio while
generating higher returns from investment (Szego, 2014).
1.5.2 Evaluating the risk and return provisions of the security market indices:
Particulars ASX200I(PI) ASXM50I(PI) ASG2PT1(PI) S&PCOMP(PI)~A$
Average return 0.53% 0.65% 0.14% 0.64%
HPR 291.54% 416.63% 3.83% 445.60%
From the valuation of the above table the relevant returns provided by the four index
could be identified. This average return calculation relatively helps in detecting the
possibility of returns that could be generated from the index and the stocks comprising the
index returns. From the evaluation ASXM50I is identified to have the highest average returns
from investment, which could increase the return generation capability of the portfolio. the
stocks of S&PCOMP could also be included in the portfolio as it provides the second highest
Returns. However, ignoring the stocks listed in ASG2PTI would be beneficial for the
portfolio, as it provides the least returns from the evaluation. From the valuation it could be
identified that US equities an Australian equities index is providing the highest returns from
the capital market, which would eventually help the couple to generate higher returns from
investment (Moustafaev, 2016).
PORTFOLIO MANAGEMENT AND THEORY
8
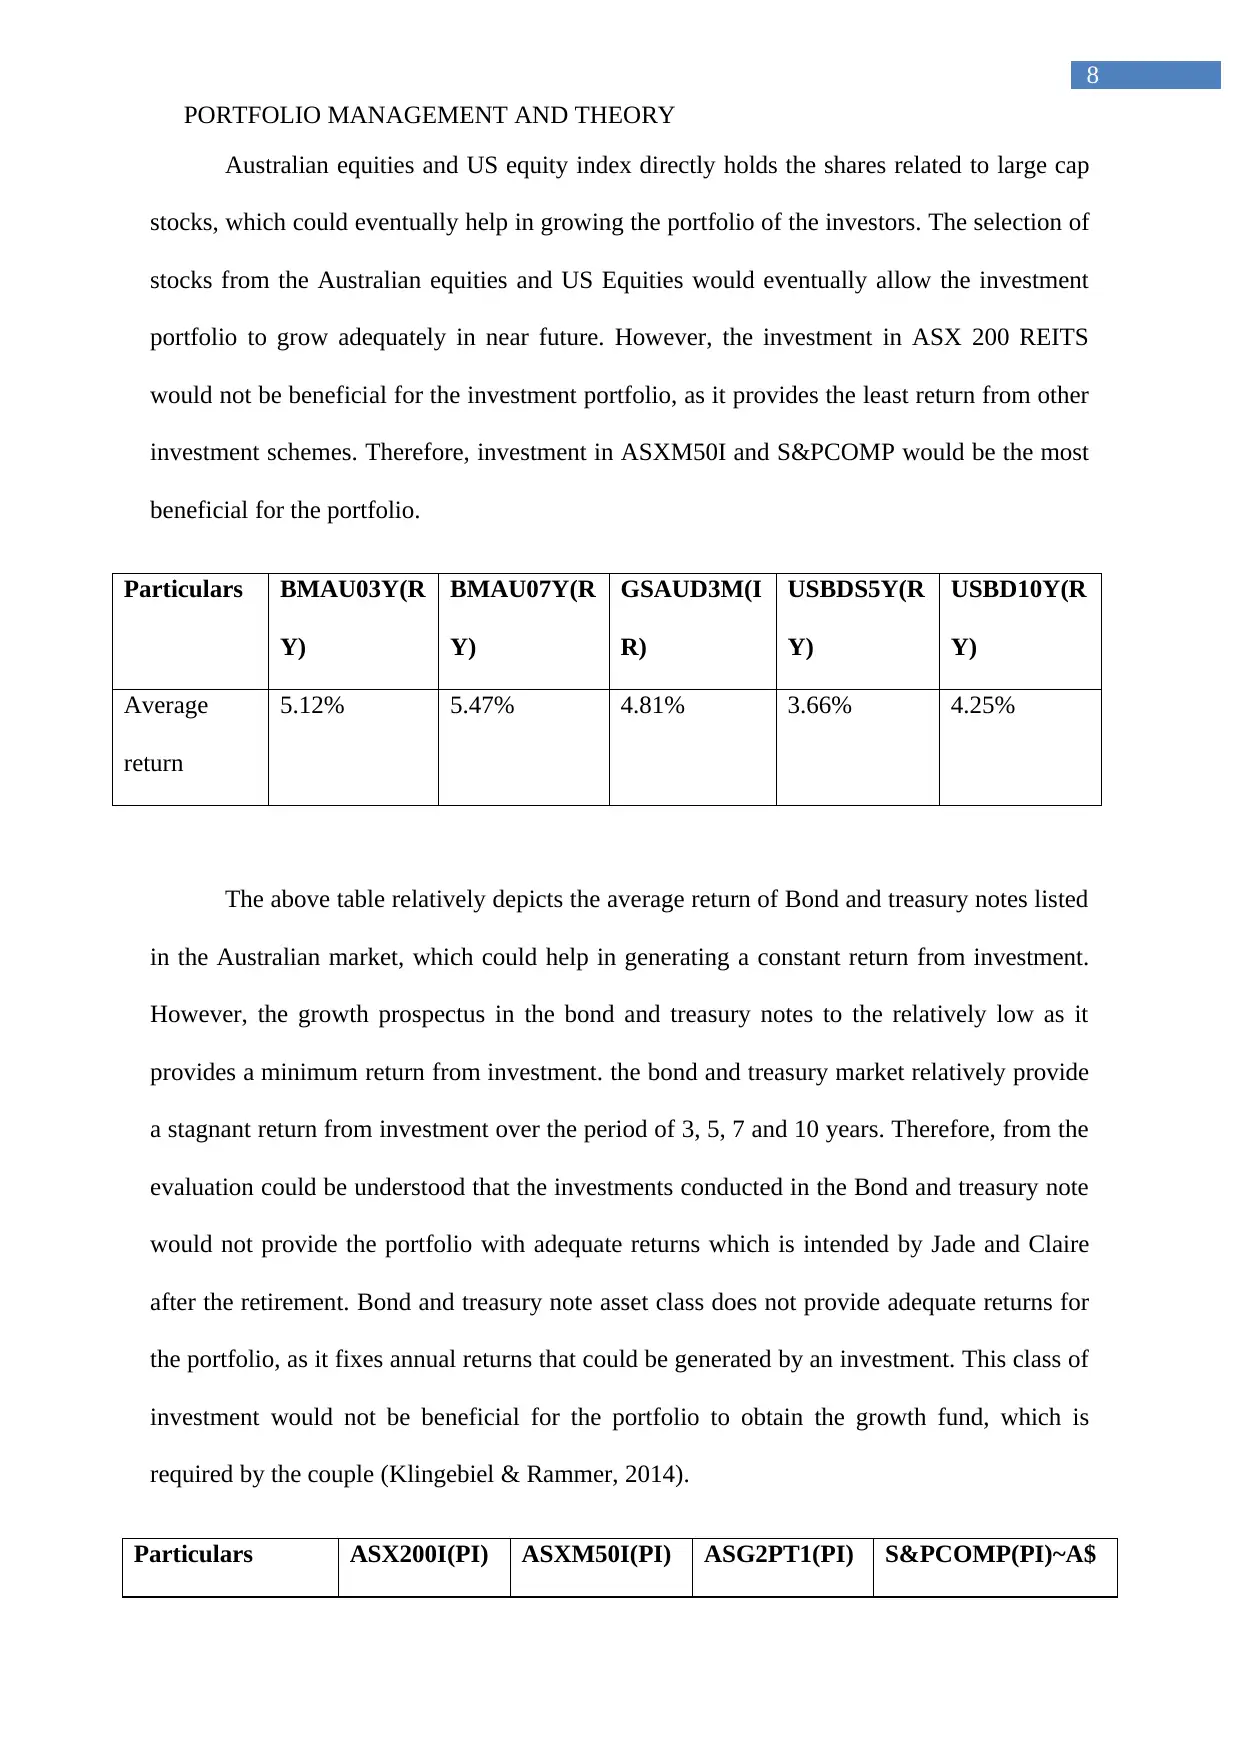
Australian equities and US equity index directly holds the shares related to large cap
stocks, which could eventually help in growing the portfolio of the investors. The selection of
stocks from the Australian equities and US Equities would eventually allow the investment
portfolio to grow adequately in near future. However, the investment in ASX 200 REITS
would not be beneficial for the investment portfolio, as it provides the least return from other
investment schemes. Therefore, investment in ASXM50I and S&PCOMP would be the most
beneficial for the portfolio.
Particulars BMAU03Y(R
Y)
BMAU07Y(R
Y)
GSAUD3M(I
R)
USBDS5Y(R
Y)
USBD10Y(R
Y)
Average
return
5.12% 5.47% 4.81% 3.66% 4.25%
The above table relatively depicts the average return of Bond and treasury notes listed
in the Australian market, which could help in generating a constant return from investment.
However, the growth prospectus in the bond and treasury notes to the relatively low as it
provides a minimum return from investment. the bond and treasury market relatively provide
a stagnant return from investment over the period of 3, 5, 7 and 10 years. Therefore, from the
evaluation could be understood that the investments conducted in the Bond and treasury note
would not provide the portfolio with adequate returns which is intended by Jade and Claire
after the retirement. Bond and treasury note asset class does not provide adequate returns for
the portfolio, as it fixes annual returns that could be generated by an investment. This class of
investment would not be beneficial for the portfolio to obtain the growth fund, which is
required by the couple (Klingebiel & Rammer, 2014).
Particulars ASX200I(PI) ASXM50I(PI) ASG2PT1(PI) S&PCOMP(PI)~A$
8
Australian equities and US equity index directly holds the shares related to large cap
stocks, which could eventually help in growing the portfolio of the investors. The selection of
stocks from the Australian equities and US Equities would eventually allow the investment
portfolio to grow adequately in near future. However, the investment in ASX 200 REITS
would not be beneficial for the investment portfolio, as it provides the least return from other
investment schemes. Therefore, investment in ASXM50I and S&PCOMP would be the most
beneficial for the portfolio.
Particulars BMAU03Y(R
Y)
BMAU07Y(R
Y)
GSAUD3M(I
R)
USBDS5Y(R
Y)
USBD10Y(R
Y)
Average
return
5.12% 5.47% 4.81% 3.66% 4.25%
The above table relatively depicts the average return of Bond and treasury notes listed
in the Australian market, which could help in generating a constant return from investment.
However, the growth prospectus in the bond and treasury notes to the relatively low as it
provides a minimum return from investment. the bond and treasury market relatively provide
a stagnant return from investment over the period of 3, 5, 7 and 10 years. Therefore, from the
evaluation could be understood that the investments conducted in the Bond and treasury note
would not provide the portfolio with adequate returns which is intended by Jade and Claire
after the retirement. Bond and treasury note asset class does not provide adequate returns for
the portfolio, as it fixes annual returns that could be generated by an investment. This class of
investment would not be beneficial for the portfolio to obtain the growth fund, which is
required by the couple (Klingebiel & Rammer, 2014).
Particulars ASX200I(PI) ASXM50I(PI) ASG2PT1(PI) S&PCOMP(PI)~A$
⊘ This is a preview!⊘
Do you want full access?
Subscribe today to unlock all pages.
Trusted by 1+ million students worldwide
PORTFOLIO MANAGEMENT AND THEORY
9
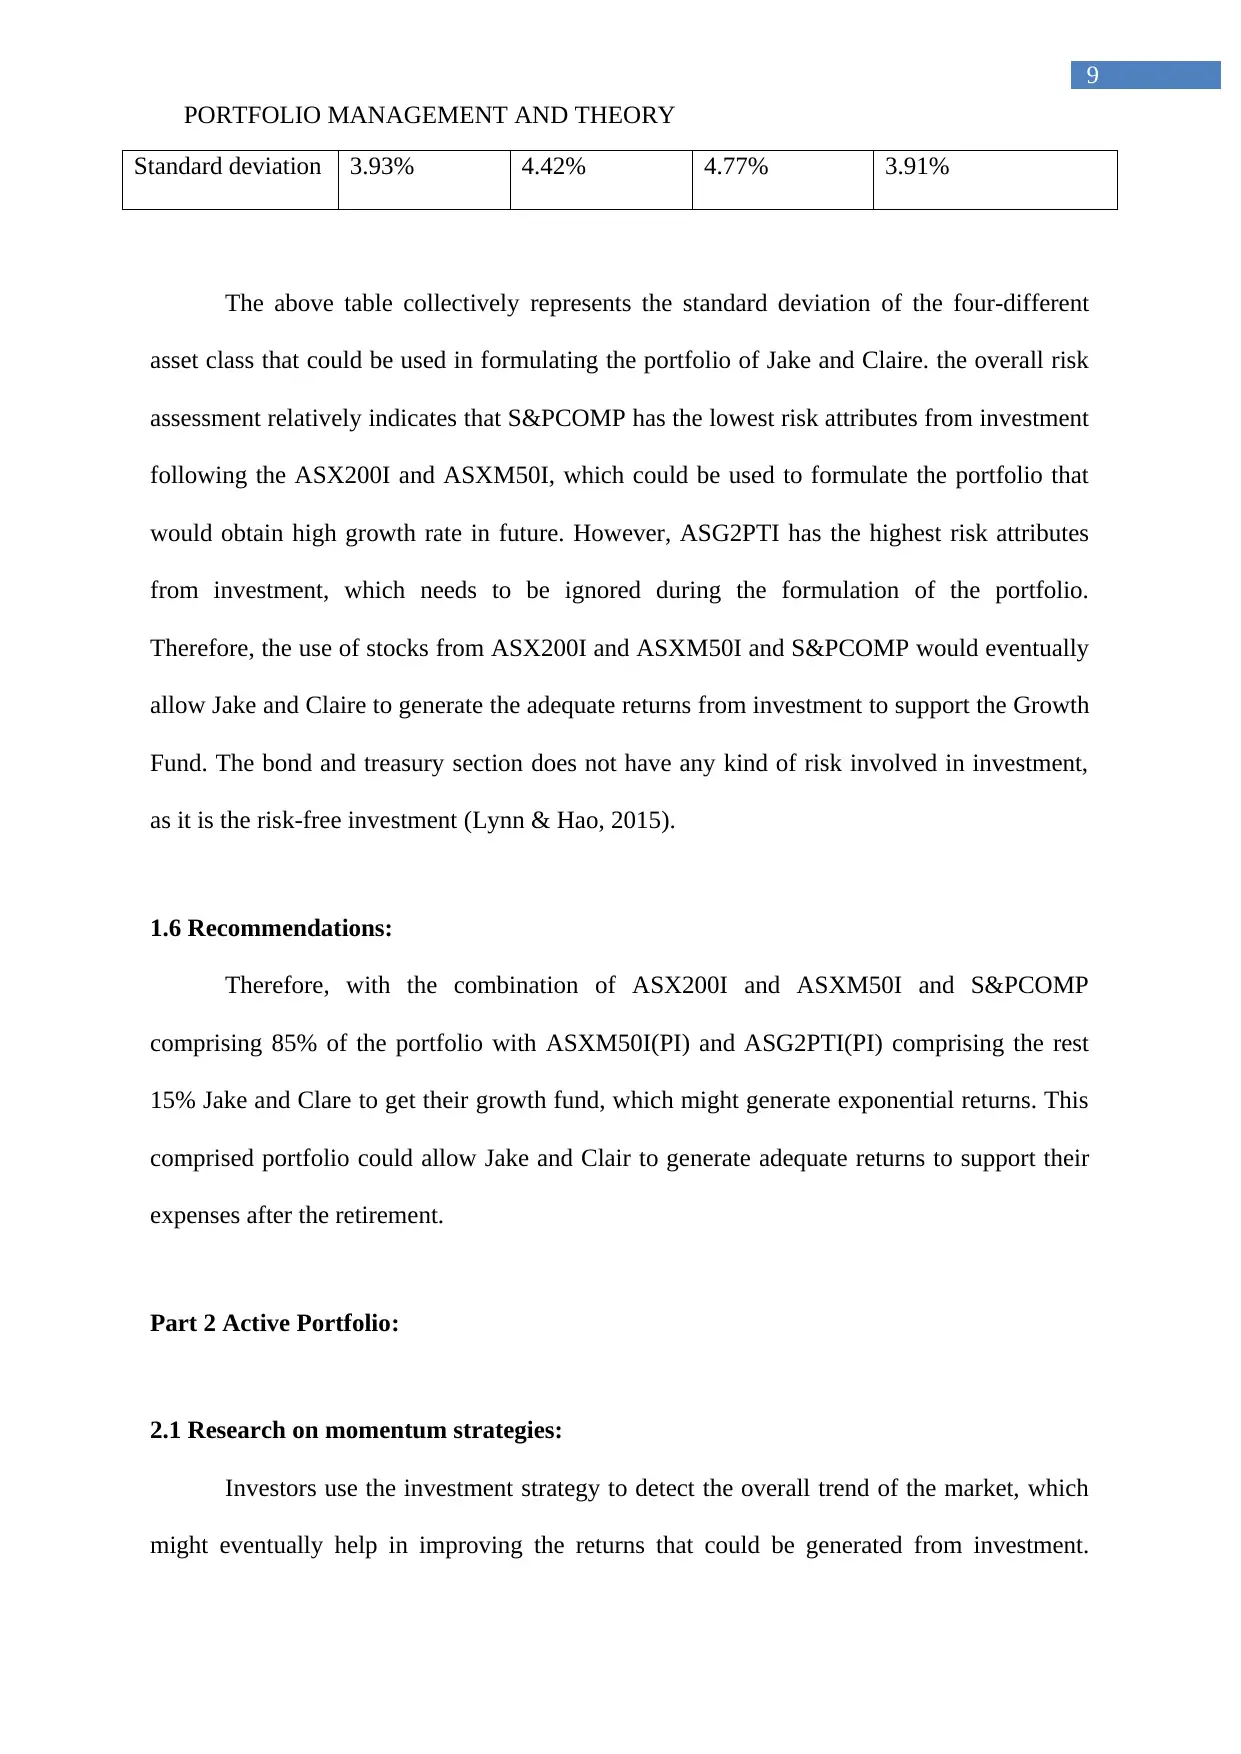
Standard deviation 3.93% 4.42% 4.77% 3.91%
The above table collectively represents the standard deviation of the four-different
asset class that could be used in formulating the portfolio of Jake and Claire. the overall risk
assessment relatively indicates that S&PCOMP has the lowest risk attributes from investment
following the ASX200I and ASXM50I, which could be used to formulate the portfolio that
would obtain high growth rate in future. However, ASG2PTI has the highest risk attributes
from investment, which needs to be ignored during the formulation of the portfolio.
Therefore, the use of stocks from ASX200I and ASXM50I and S&PCOMP would eventually
allow Jake and Claire to generate the adequate returns from investment to support the Growth
Fund. The bond and treasury section does not have any kind of risk involved in investment,
as it is the risk-free investment (Lynn & Hao, 2015).
1.6 Recommendations:
Therefore, with the combination of ASX200I and ASXM50I and S&PCOMP
comprising 85% of the portfolio with ASXM50I(PI) and ASG2PTI(PI) comprising the rest
15% Jake and Clare to get their growth fund, which might generate exponential returns. This
comprised portfolio could allow Jake and Clair to generate adequate returns to support their
expenses after the retirement.
Part 2 Active Portfolio:
2.1 Research on momentum strategies:
Investors use the investment strategy to detect the overall trend of the market, which
might eventually help in improving the returns that could be generated from investment.
9
Standard deviation 3.93% 4.42% 4.77% 3.91%
The above table collectively represents the standard deviation of the four-different
asset class that could be used in formulating the portfolio of Jake and Claire. the overall risk
assessment relatively indicates that S&PCOMP has the lowest risk attributes from investment
following the ASX200I and ASXM50I, which could be used to formulate the portfolio that
would obtain high growth rate in future. However, ASG2PTI has the highest risk attributes
from investment, which needs to be ignored during the formulation of the portfolio.
Therefore, the use of stocks from ASX200I and ASXM50I and S&PCOMP would eventually
allow Jake and Claire to generate the adequate returns from investment to support the Growth
Fund. The bond and treasury section does not have any kind of risk involved in investment,
as it is the risk-free investment (Lynn & Hao, 2015).
1.6 Recommendations:
Therefore, with the combination of ASX200I and ASXM50I and S&PCOMP
comprising 85% of the portfolio with ASXM50I(PI) and ASG2PTI(PI) comprising the rest
15% Jake and Clare to get their growth fund, which might generate exponential returns. This
comprised portfolio could allow Jake and Clair to generate adequate returns to support their
expenses after the retirement.
Part 2 Active Portfolio:
2.1 Research on momentum strategies:
Investors use the investment strategy to detect the overall trend of the market, which
might eventually help in improving the returns that could be generated from investment.
Paraphrase This Document
Need a fresh take? Get an instant paraphrase of this document with our AI Paraphraser
PORTFOLIO MANAGEMENT AND THEORY
10
Moreover, the momentum investing strategy directly involve long term trading provisions,
which needs to be conducted by individuals to generate higher rate of return from investment.
The strategy relatively focuses on identifying the upper trending stocks, which could be used
during the portfolio creation. However, the momentum strategy does not provide adequate
knowledge regarding the risk and return attributes of the stock, which can be identified as its
major disadvantage. Moreover, the investment strategy Relatively focuses on establishing or
detecting a relevant Trend which could be used in maximizing the profits of the investors
(Asparouhova et al., 2014).
Moreover, with the help of momentum investing strategy investors can detect price
movement is for the trend moving gives the trend identified by the strategy. this relatively
close the investors to detect major reversals, which could reduce the losses from investment,
while providing an adequate investment opportunity to the investors. Moreover, Momentum
is identified to be a short-term strategy indicator, which relatively focuses on short duration
of historical price to determine the actual and current position of the stocks. Furthermore,
Momentum strategy is not concerned with the operational performance of the stock it directly
focuses on the changing trend value of a stock to determine the investment opportunity. In
addition, the momentum strategy can be identified as an indicator which thrives on investor
emotions, which would eventually help in detecting the investment opportunity for the
investors (Stettina & Horz, 2015).
The momentum trading utilizes changes in price which is conducted by stocks
overtime, while providing an adequate investment opportunity to the investors. the evaluation
of price change is derived by moving averages, which could eventually help investors in
detecting the trend of the stock. this trend detection is the momentum indicator which allows
investors to identify whether the trend is positive or negative. Investors utilize the
PORTFOLIO MANAGEMENT AND THEORY
11
information for short term trades and identify major reversals, which could provide the
maximum returns from their investment (Gutiérrez & Magnusson, 2014).
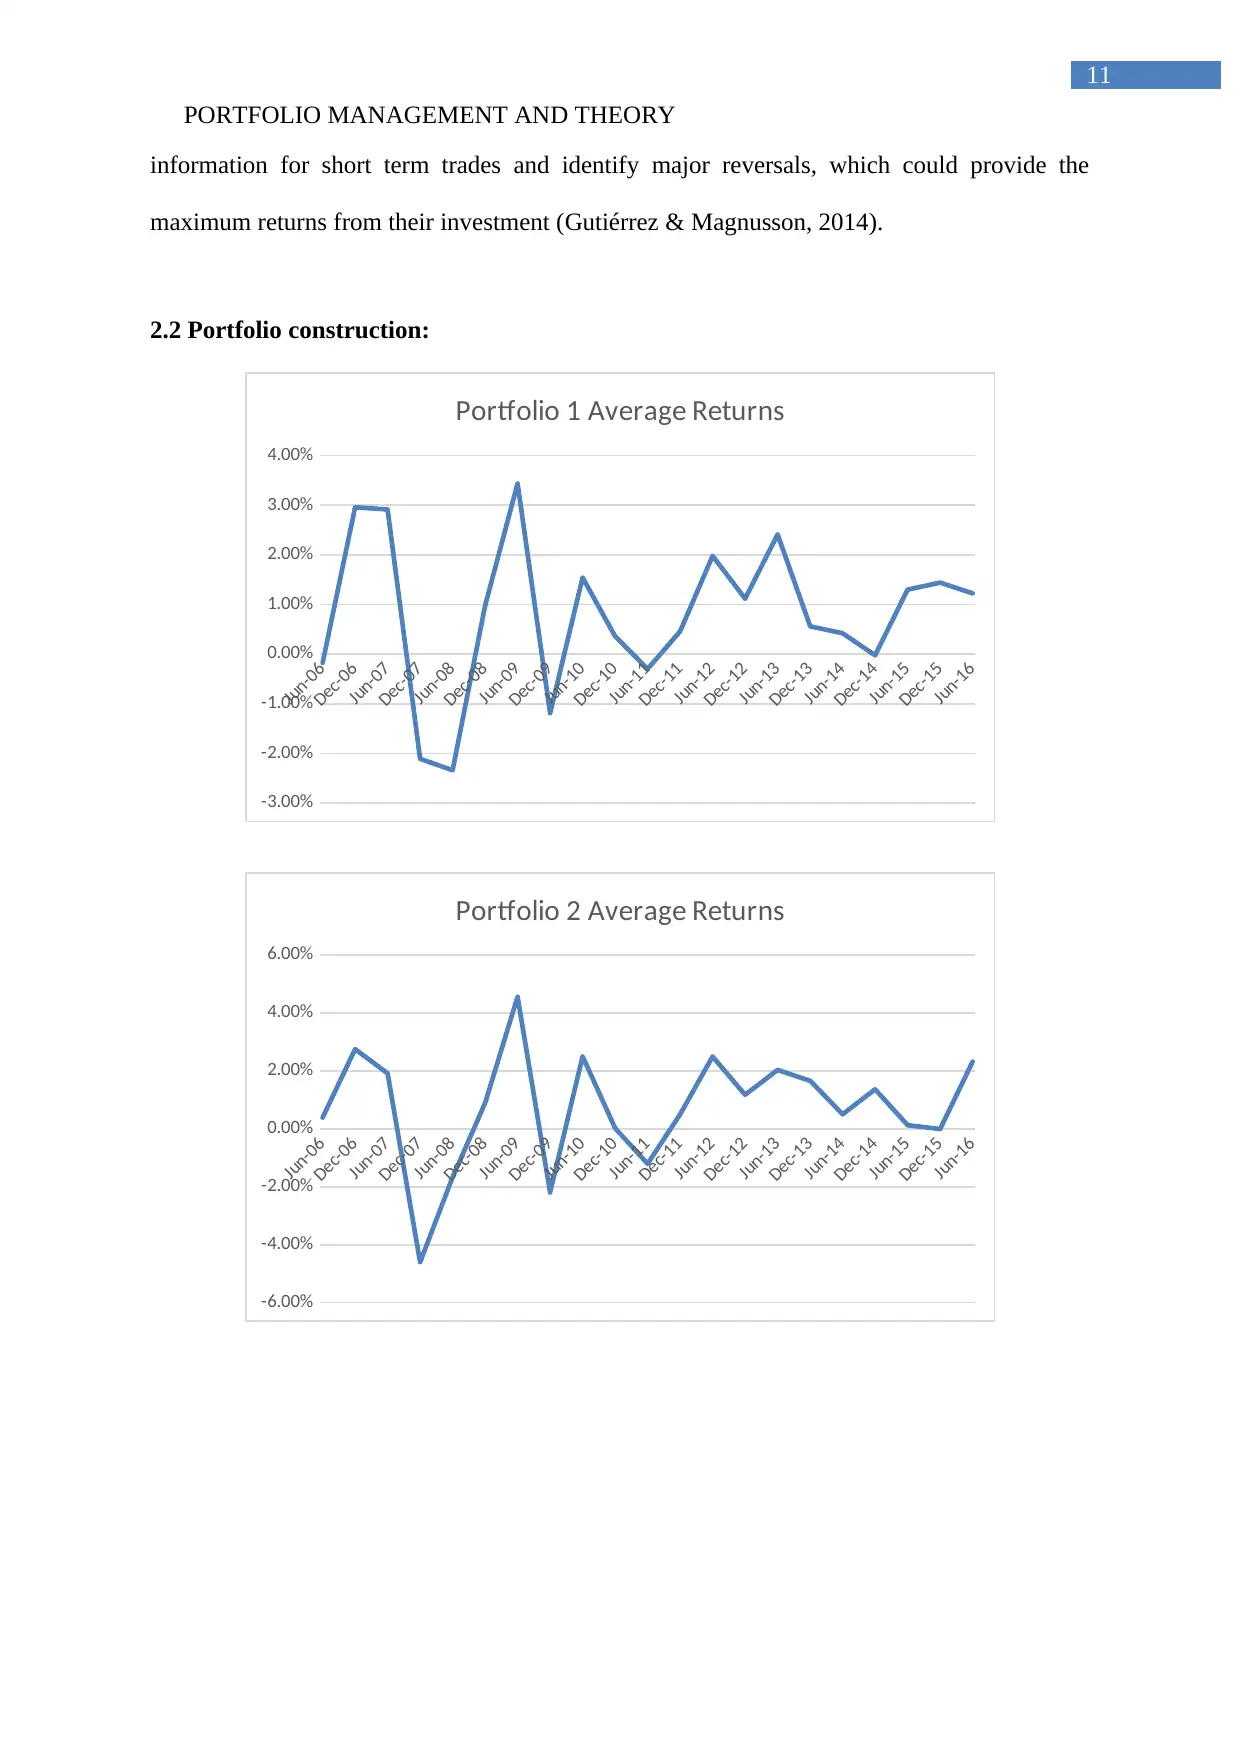
2.2 Portfolio construction:
Jun-06
Dec-06
Jun-07
Dec-07
Jun-08
Dec-08
Jun-09
Dec-09
Jun-10
Dec-10
Jun-11
Dec-11
Jun-12
Dec-12
Jun-13
Dec-13
Jun-14
Dec-14
Jun-15
Dec-15
Jun-16
-3.00%
-2.00%
-1.00%
0.00%
1.00%
2.00%
3.00%
4.00%
Portfolio 1 Average Returns
Jun-06
Dec-06
Jun-07
Dec-07
Jun-08
Dec-08
Jun-09
Dec-09
Jun-10
Dec-10
Jun-11
Dec-11
Jun-12
Dec-12
Jun-13
Dec-13
Jun-14
Dec-14
Jun-15
Dec-15
Jun-16
-6.00%
-4.00%
-2.00%
0.00%
2.00%
4.00%
6.00%
Portfolio 2 Average Returns
11
information for short term trades and identify major reversals, which could provide the
maximum returns from their investment (Gutiérrez & Magnusson, 2014).
2.2 Portfolio construction:
Jun-06
Dec-06
Jun-07
Dec-07
Jun-08
Dec-08
Jun-09
Dec-09
Jun-10
Dec-10
Jun-11
Dec-11
Jun-12
Dec-12
Jun-13
Dec-13
Jun-14
Dec-14
Jun-15
Dec-15
Jun-16
-3.00%
-2.00%
-1.00%
0.00%
1.00%
2.00%
3.00%
4.00%
Portfolio 1 Average Returns
Jun-06
Dec-06
Jun-07
Dec-07
Jun-08
Dec-08
Jun-09
Dec-09
Jun-10
Dec-10
Jun-11
Dec-11
Jun-12
Dec-12
Jun-13
Dec-13
Jun-14
Dec-14
Jun-15
Dec-15
Jun-16
-6.00%
-4.00%
-2.00%
0.00%
2.00%
4.00%
6.00%
Portfolio 2 Average Returns
⊘ This is a preview!⊘
Do you want full access?
Subscribe today to unlock all pages.
Trusted by 1+ million students worldwide
1 out of 28
Related Documents


Your All-in-One AI-Powered Toolkit for Academic Success.
+13062052269
info@desklib.com
Available 24*7 on WhatsApp / Email
![[object Object]](/_next/static/media/star-bottom.7253800d.svg)
Unlock your academic potential
Copyright © 2020–2026 A2Z Services. All Rights Reserved. Developed and managed by ZUCOL.