FIN201 Assignment: Portfolio Optimization, CAPM, and Dividend Analysis
VerifiedAdded on 2023/06/13
|12
|1474
|202
Homework Assignment
AI Summary
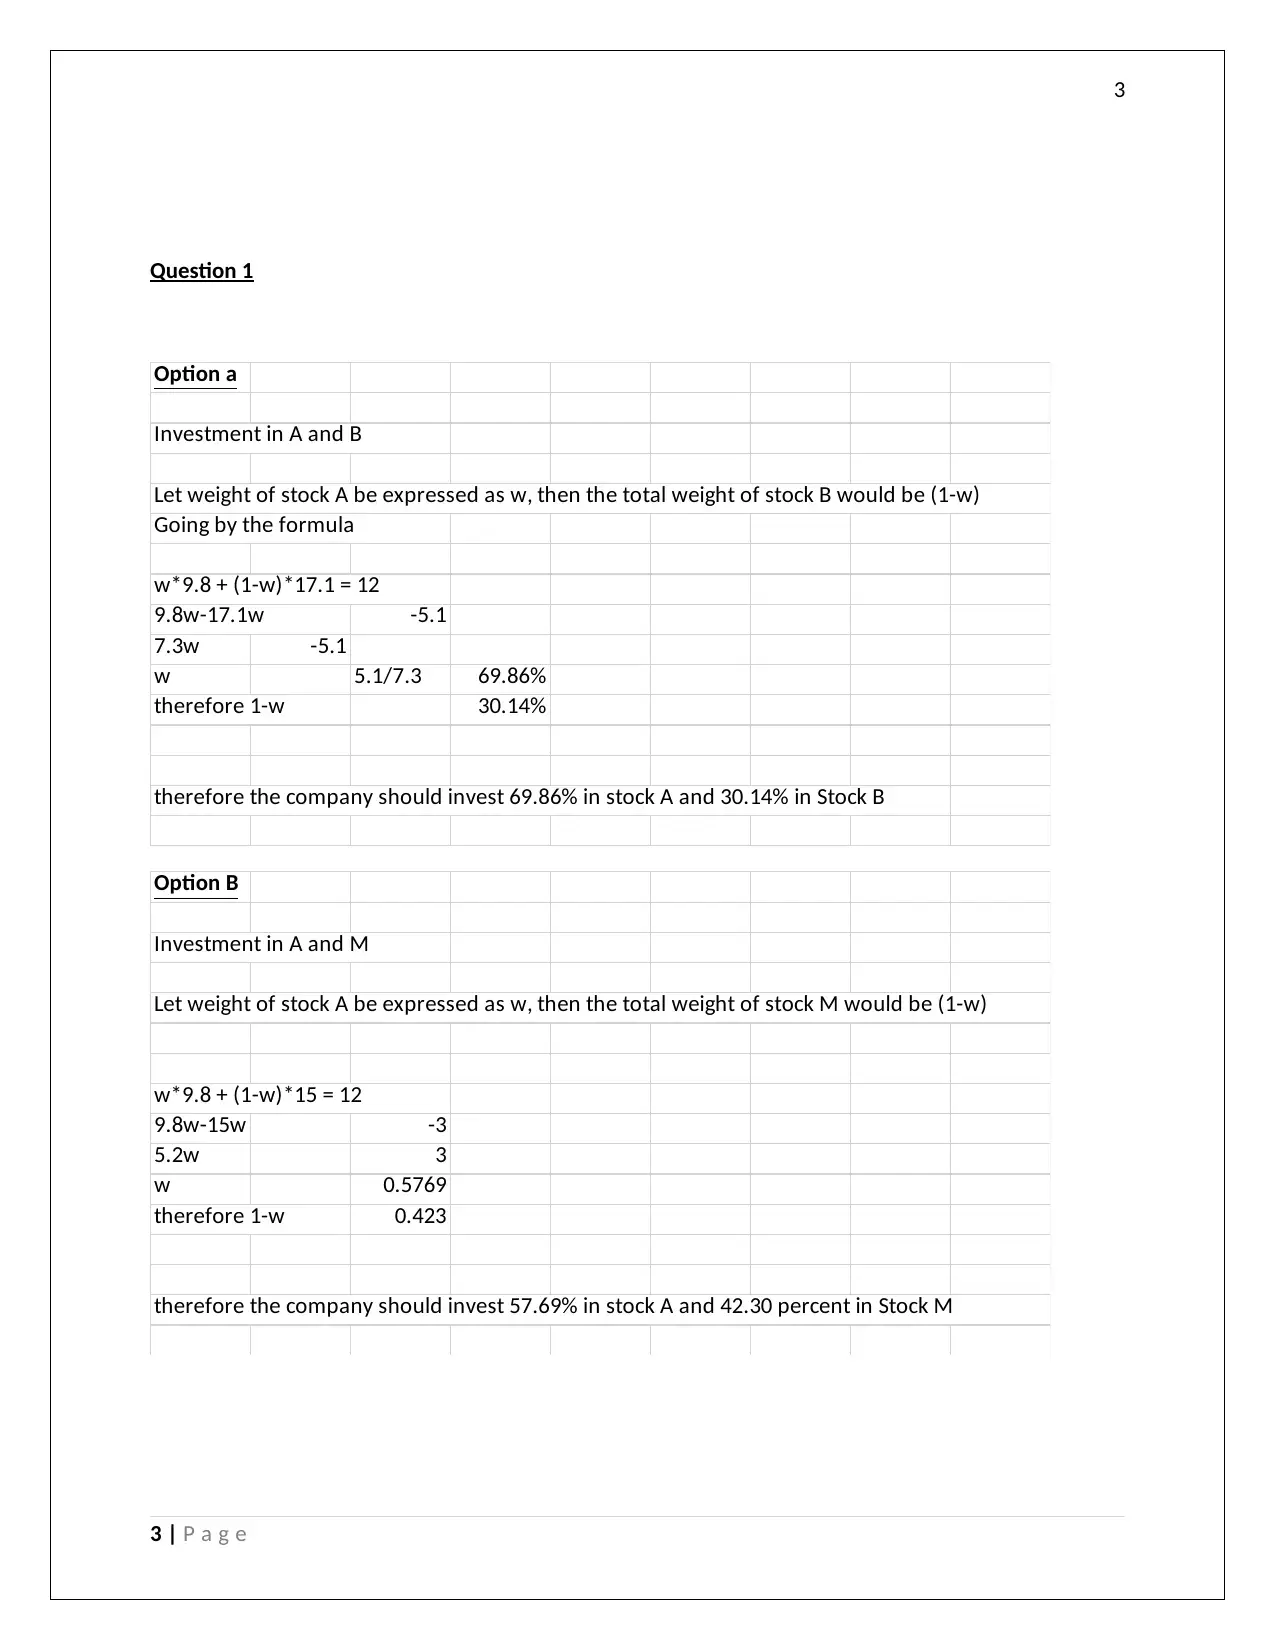
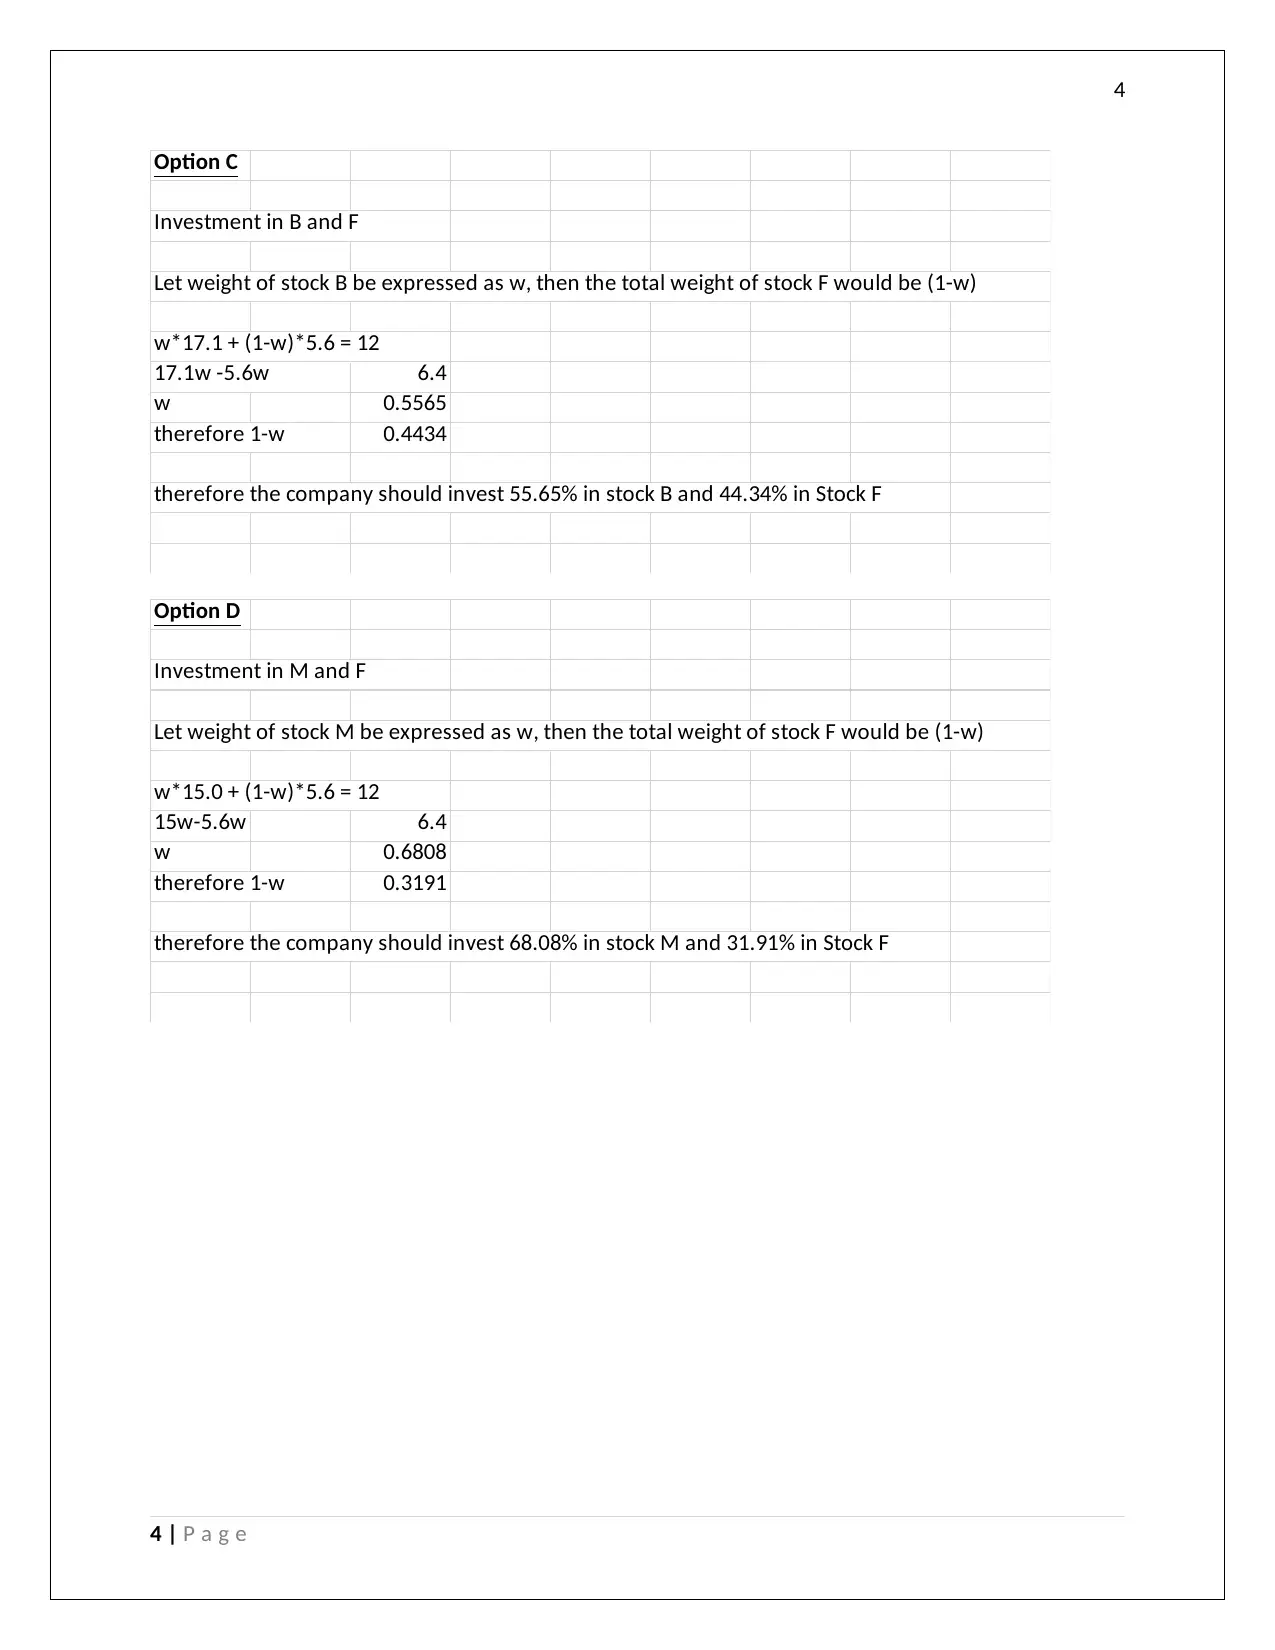
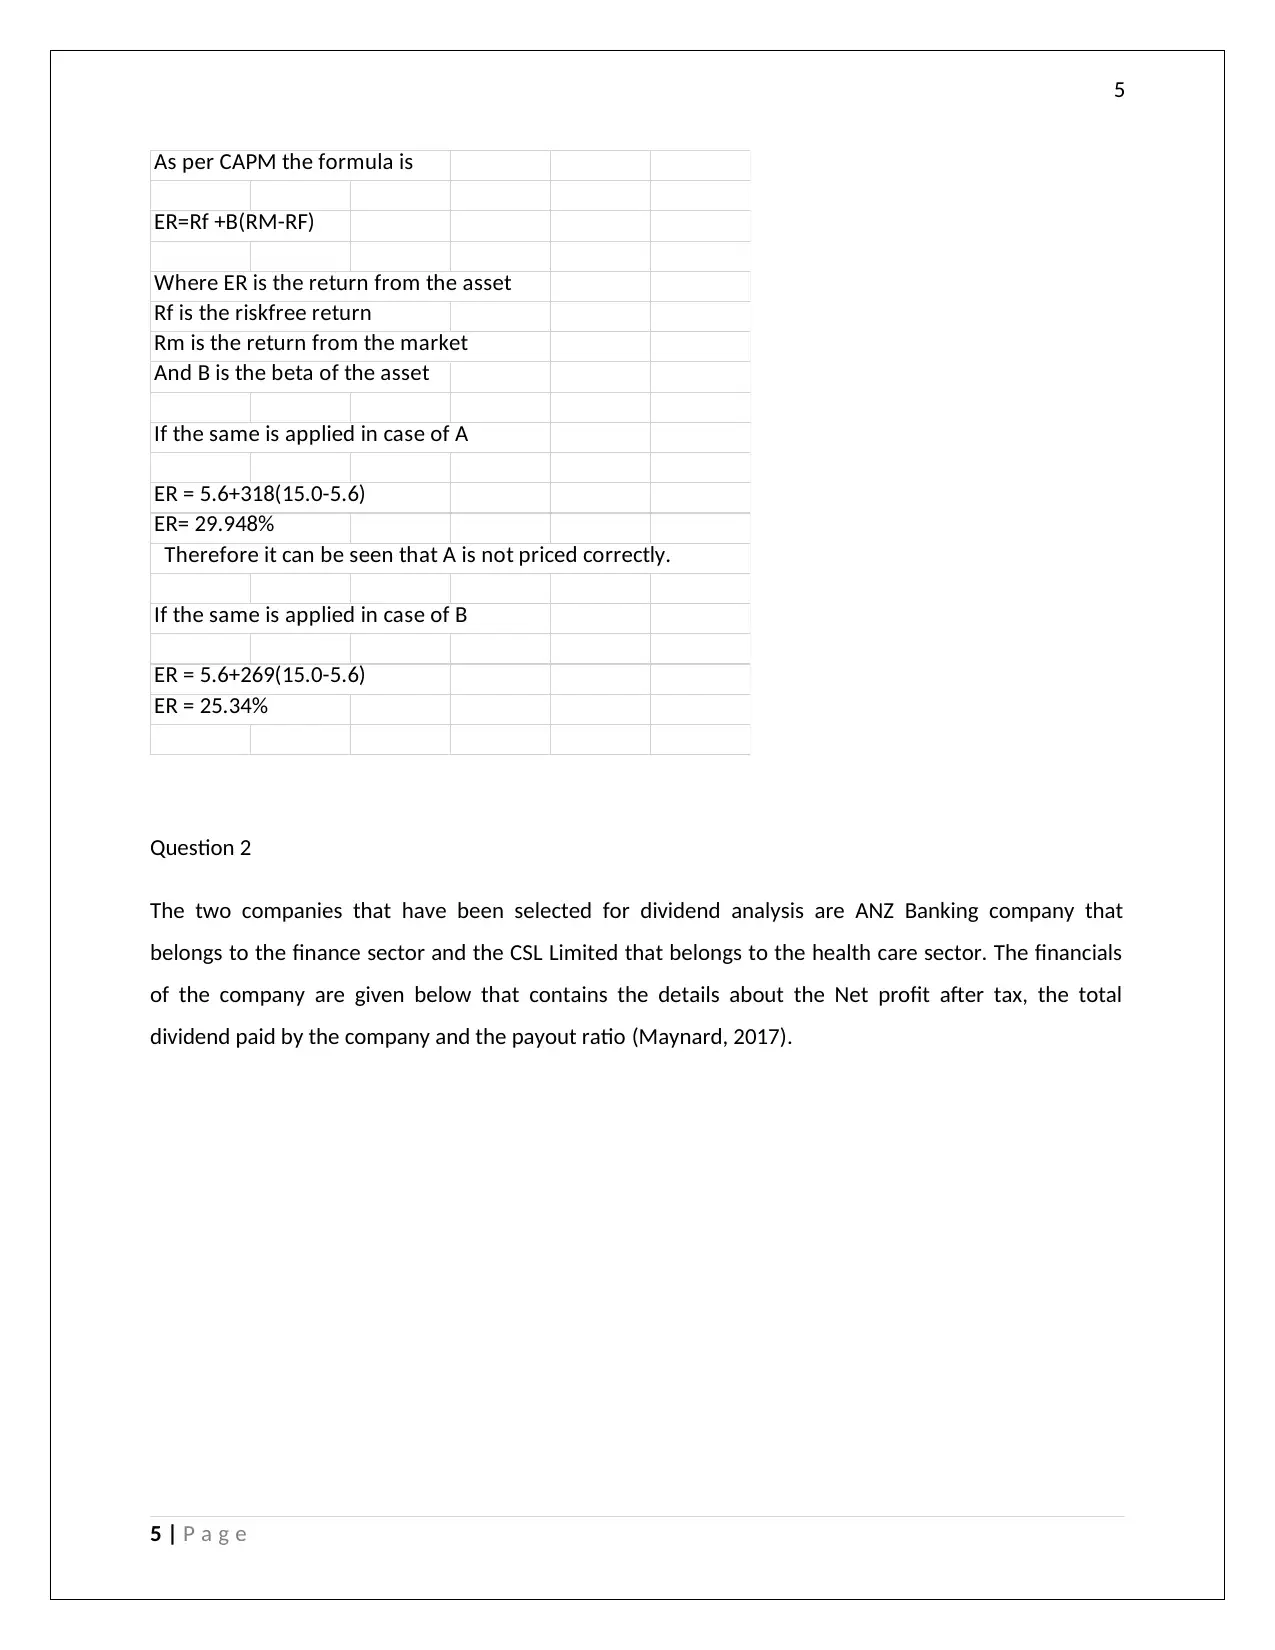
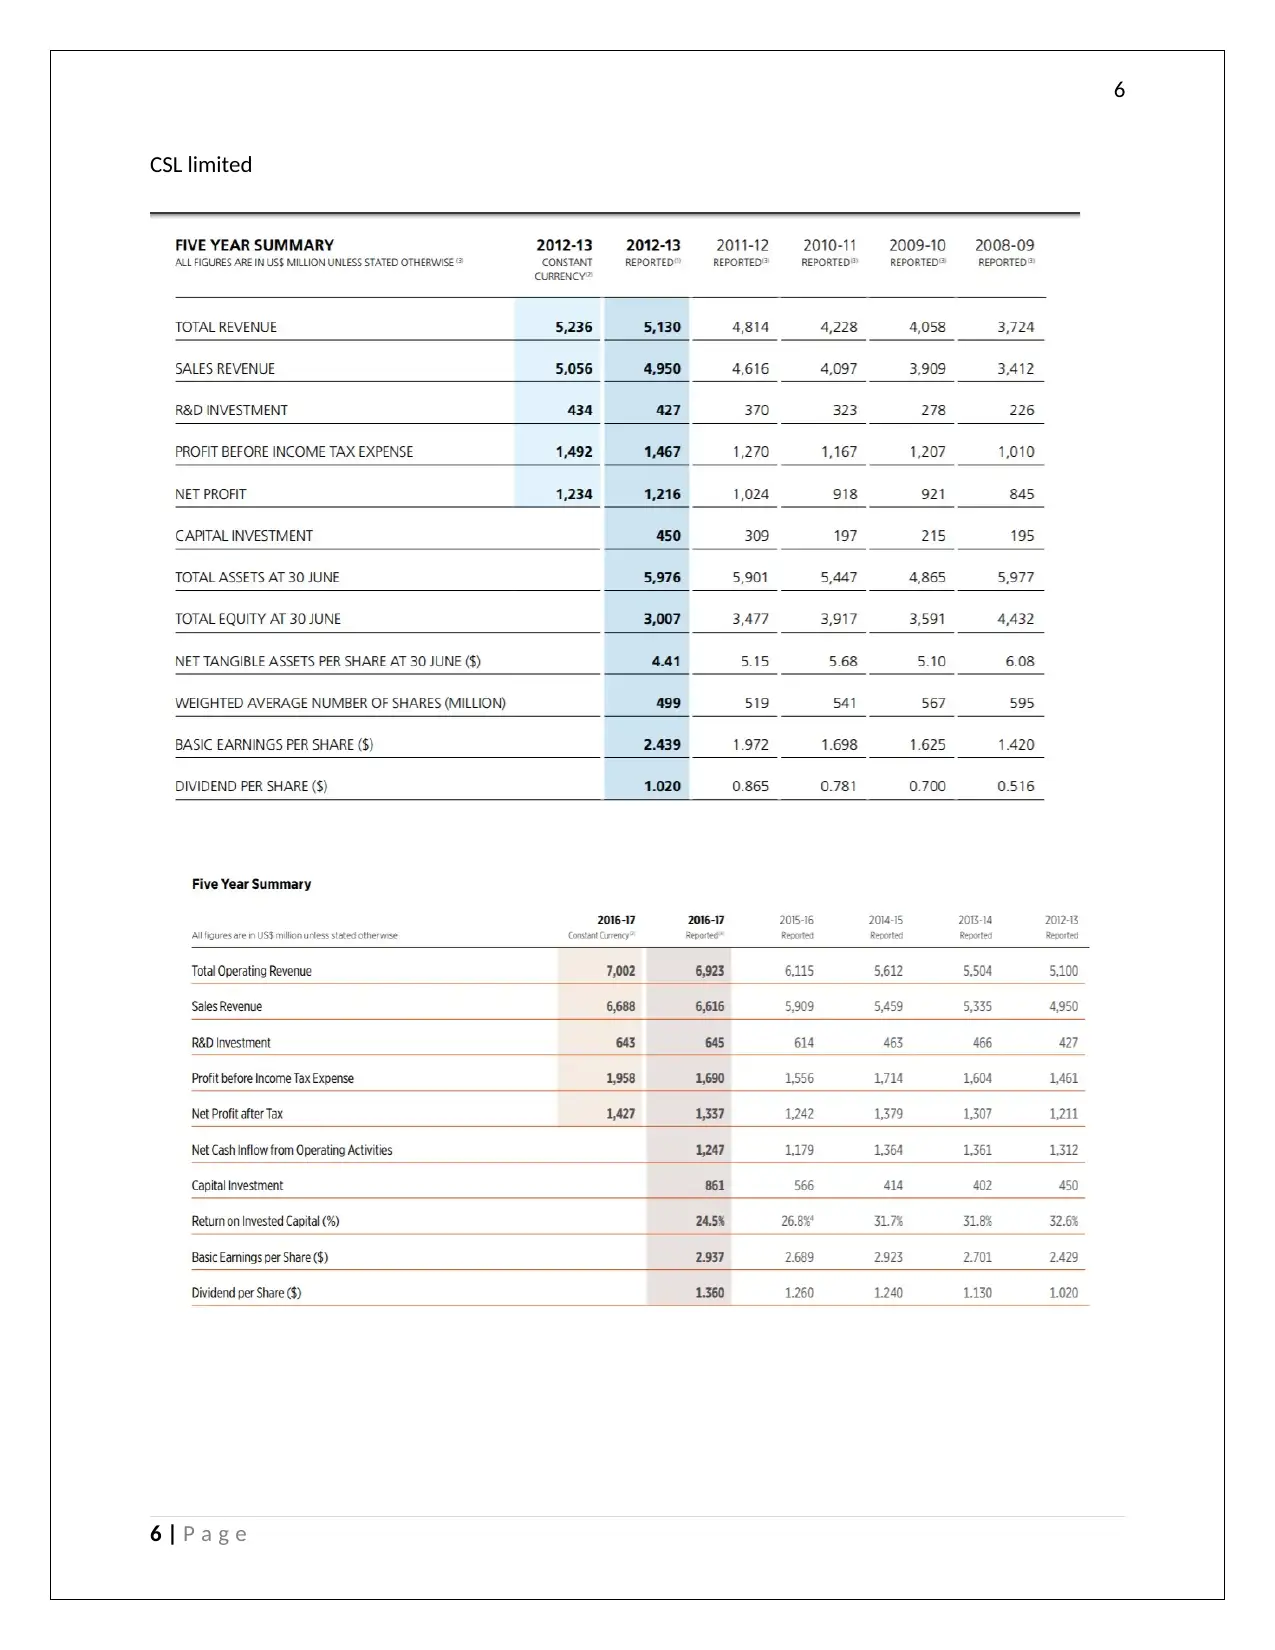
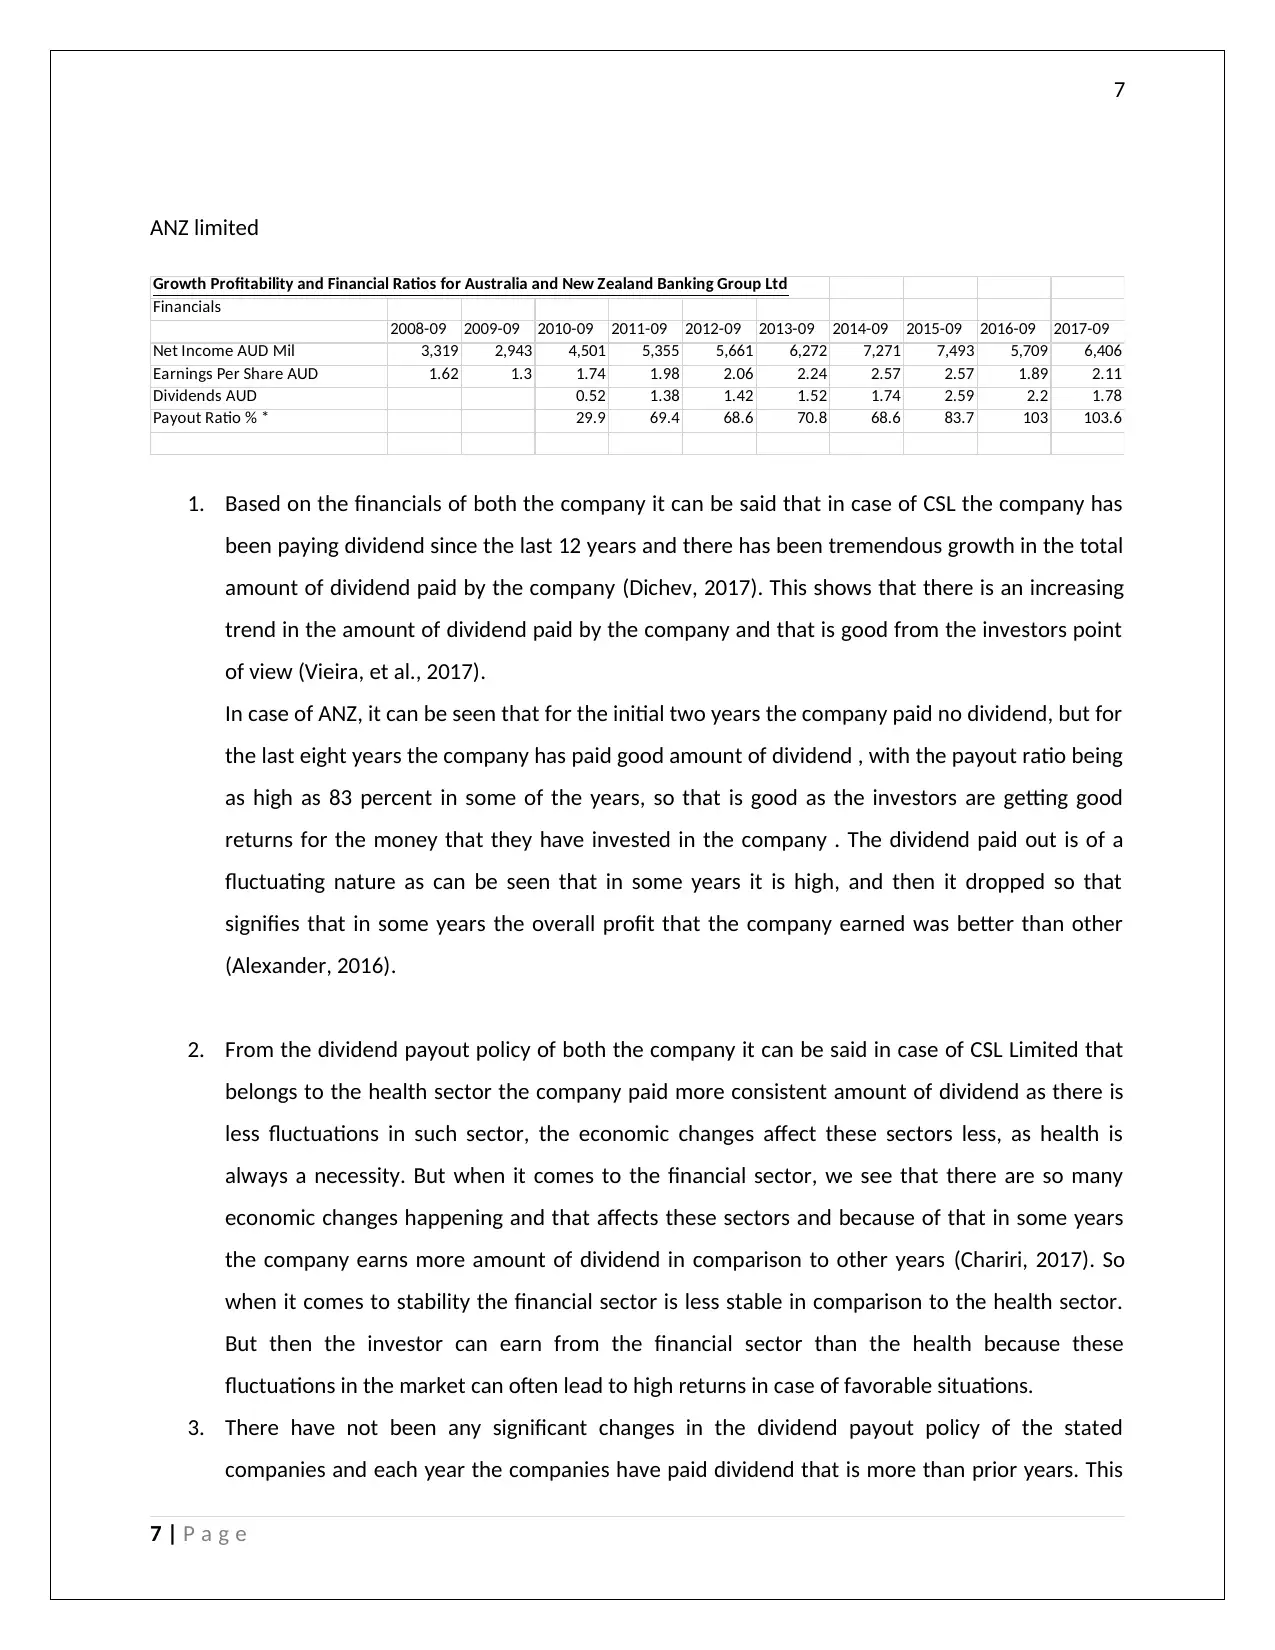
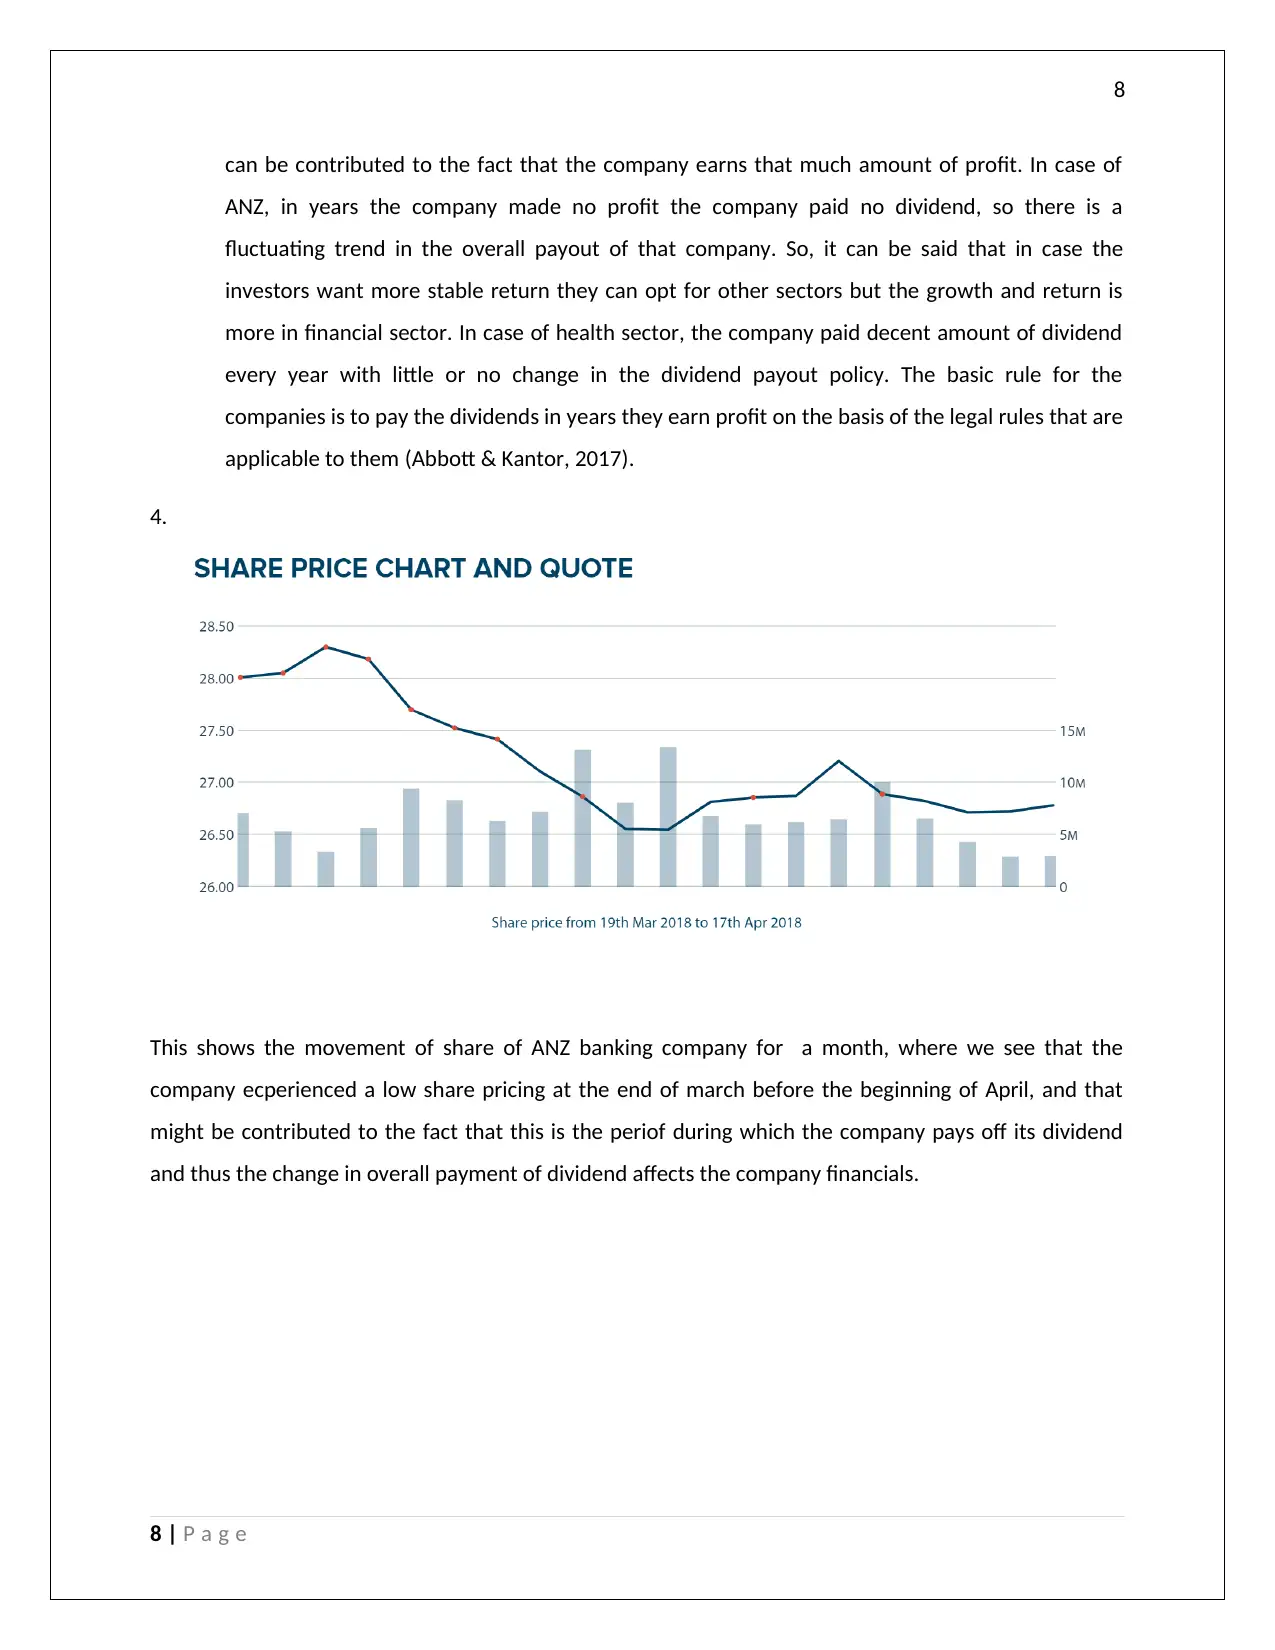
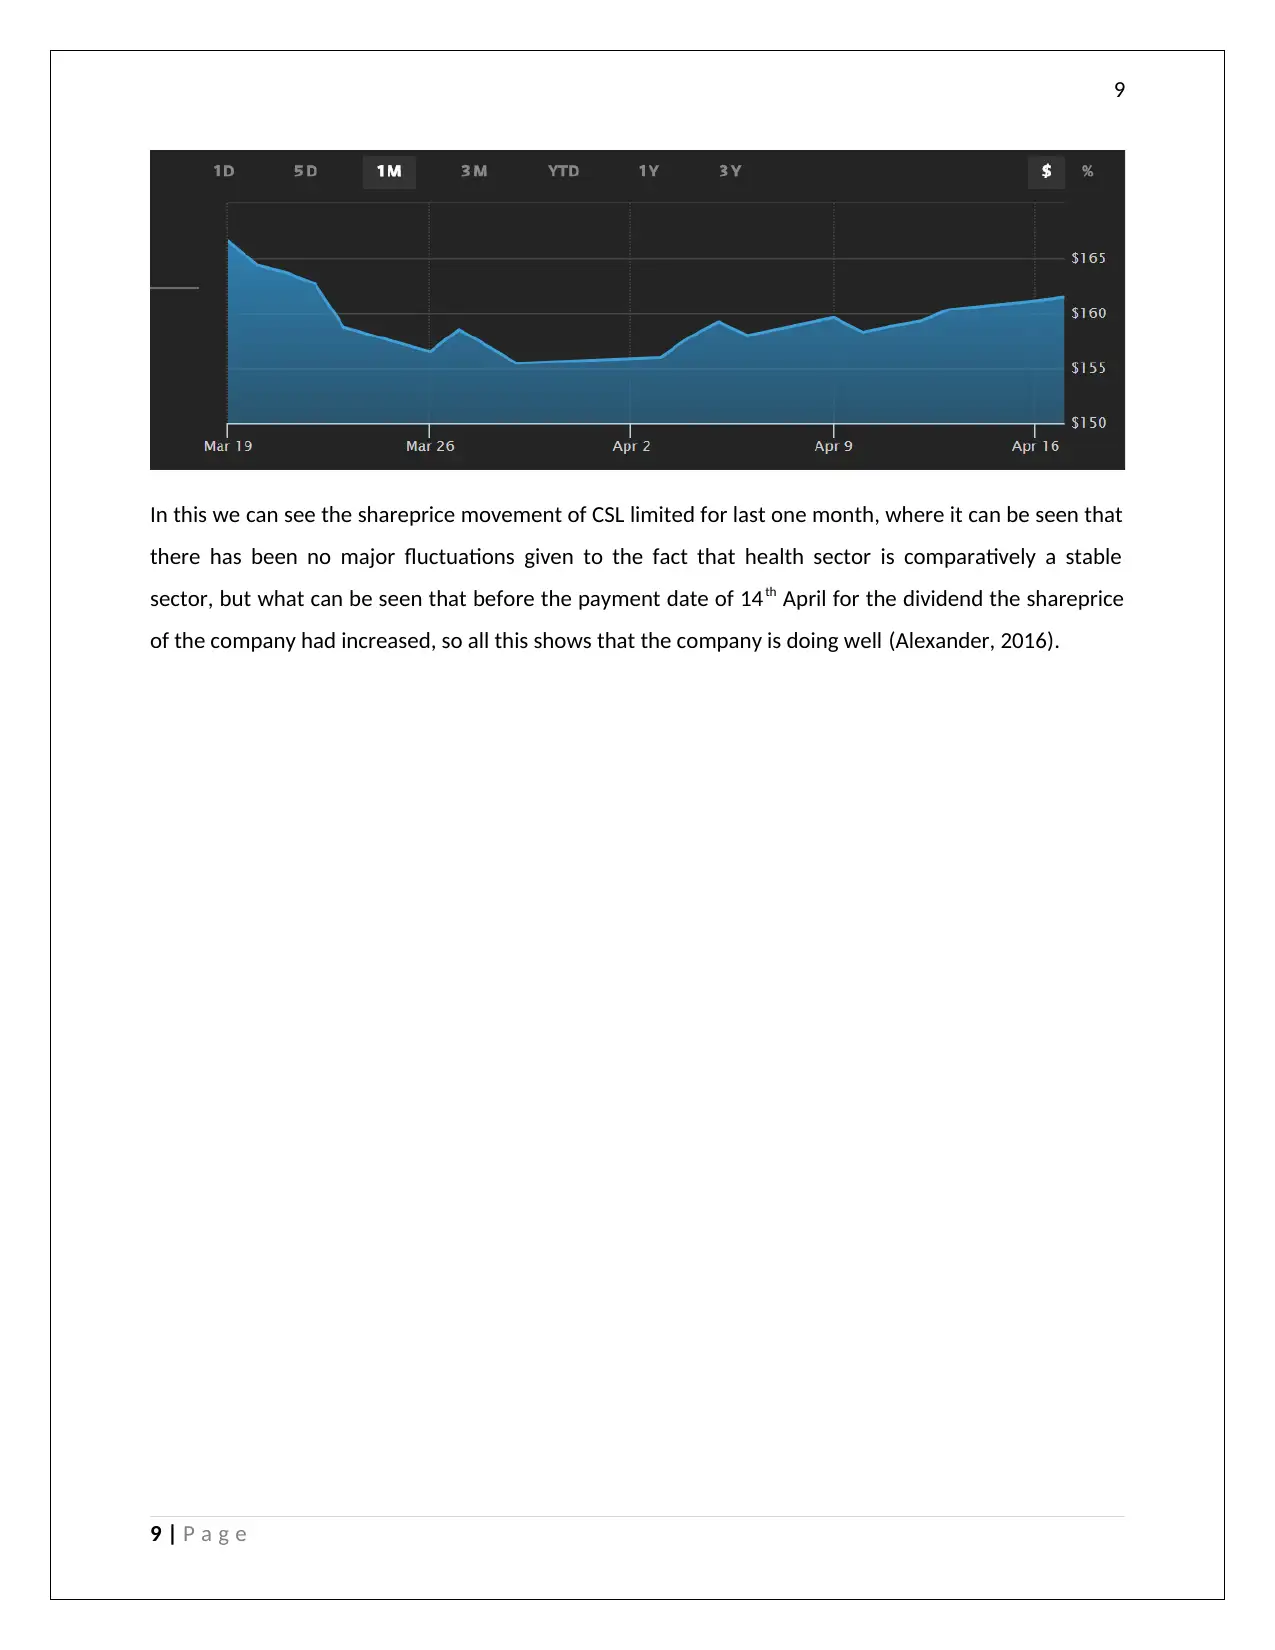
This assignment solution addresses portfolio optimization and capital asset pricing model (CAPM) analysis, along with a dividend analysis of ANZ Banking and CSL Limited. It calculates optimal portfolio weights for various asset combinations to achieve a 12% expected return and assesses whether a...

Accounting Issues
2017
2017
Paraphrase This Document
Need a fresh take? Get an instant paraphrase of this document with our AI Paraphraser

1
By student name
Professor
University
Date: April 17 , 2018.
1 | P a g e
By student name
Professor
University
Date: April 17 , 2018.
1 | P a g e

2
Contents
Question 1………………………………………………………………….....................................................................3
Question 2…………………………………………………………………………………………………………………….……………….5
References………………………………………………………………………………………………………………………………………7
2 | P a g e
Contents
Question 1………………………………………………………………….....................................................................3
Question 2…………………………………………………………………………………………………………………….……………….5
References………………………………………………………………………………………………………………………………………7
2 | P a g e
You're viewing a preview
Unlock full access by subscribing today!

3
Question 1
Option a
Investment in A and B
Let weight of stock A be expressed as w, then the total weight of stock B would be (1-w)
Going by the formula
w*9.8 + (1-w)*17.1 = 12
9.8w-17.1w -5.1
7.3w -5.1
w 5.1/7.3 69.86%
therefore 1-w 30.14%
therefore the company should invest 69.86% in stock A and 30.14% in Stock B
Option B
Investment in A and M
Let weight of stock A be expressed as w, then the total weight of stock M would be (1-w)
w*9.8 + (1-w)*15 = 12
9.8w-15w -3
5.2w 3
w 0.5769
therefore 1-w 0.423
therefore the company should invest 57.69% in stock A and 42.30 percent in Stock M
3 | P a g e
Paraphrase This Document
Need a fresh take? Get an instant paraphrase of this document with our AI Paraphraser

4
Option C
Investment in B and F
Let weight of stock B be expressed as w, then the total weight of stock F would be (1-w)
w*17.1 + (1-w)*5.6 = 12
17.1w -5.6w 6.4
w 0.5565
therefore 1-w 0.4434
therefore the company should invest 55.65% in stock B and 44.34% in Stock F
Option D
Investment in M and F
Let weight of stock M be expressed as w, then the total weight of stock F would be (1-w)
w*15.0 + (1-w)*5.6 = 12
15w-5.6w 6.4
w 0.6808
therefore 1-w 0.3191
therefore the company should invest 68.08% in stock M and 31.91% in Stock F
4 | P a g e

5
As per CAPM the formula is
ER=Rf +B(RM-RF)
Where ER is the return from the asset
Rf is the riskfree return
Rm is the return from the market
And B is the beta of the asset
If the same is applied in case of A
ER = 5.6+318(15.0-5.6)
ER= 29.948%
Therefore it can be seen that A is not priced correctly.
If the same is applied in case of B
ER = 5.6+269(15.0-5.6)
ER = 25.34%
Question 2
The two companies that have been selected for dividend analysis are ANZ Banking company that
belongs to the finance sector and the CSL Limited that belongs to the health care sector. The financials
of the company are given below that contains the details about the Net profit after tax, the total
dividend paid by the company and the payout ratio (Maynard, 2017).
5 | P a g e
You're viewing a preview
Unlock full access by subscribing today!

6
CSL limited
6 | P a g e
CSL limited
6 | P a g e
Paraphrase This Document
Need a fresh take? Get an instant paraphrase of this document with our AI Paraphraser

7
ANZ limited
Growth Profitability and Financial Ratios for Australia and New Zealand Banking Group Ltd
Financials
2008-09 2009-09 2010-09 2011-09 2012-09 2013-09 2014-09 2015-09 2016-09 2017-09
Net Income AUD Mil 3,319 2,943 4,501 5,355 5,661 6,272 7,271 7,493 5,709 6,406
Earnings Per Share AUD 1.62 1.3 1.74 1.98 2.06 2.24 2.57 2.57 1.89 2.11
Dividends AUD 0.52 1.38 1.42 1.52 1.74 2.59 2.2 1.78
Payout Ratio % * 29.9 69.4 68.6 70.8 68.6 83.7 103 103.6
1. Based on the financials of both the company it can be said that in case of CSL the company has
been paying dividend since the last 12 years and there has been tremendous growth in the total
amount of dividend paid by the company (Dichev, 2017). This shows that there is an increasing
trend in the amount of dividend paid by the company and that is good from the investors point
of view (Vieira, et al., 2017).
In case of ANZ, it can be seen that for the initial two years the company paid no dividend, but for
the last eight years the company has paid good amount of dividend , with the payout ratio being
as high as 83 percent in some of the years, so that is good as the investors are getting good
returns for the money that they have invested in the company . The dividend paid out is of a
fluctuating nature as can be seen that in some years it is high, and then it dropped so that
signifies that in some years the overall profit that the company earned was better than other
(Alexander, 2016).
2. From the dividend payout policy of both the company it can be said in case of CSL Limited that
belongs to the health sector the company paid more consistent amount of dividend as there is
less fluctuations in such sector, the economic changes affect these sectors less, as health is
always a necessity. But when it comes to the financial sector, we see that there are so many
economic changes happening and that affects these sectors and because of that in some years
the company earns more amount of dividend in comparison to other years (Chariri, 2017). So
when it comes to stability the financial sector is less stable in comparison to the health sector.
But then the investor can earn from the financial sector than the health because these
fluctuations in the market can often lead to high returns in case of favorable situations.
3. There have not been any significant changes in the dividend payout policy of the stated
companies and each year the companies have paid dividend that is more than prior years. This
7 | P a g e

8
can be contributed to the fact that the company earns that much amount of profit. In case of
ANZ, in years the company made no profit the company paid no dividend, so there is a
fluctuating trend in the overall payout of that company. So, it can be said that in case the
investors want more stable return they can opt for other sectors but the growth and return is
more in financial sector. In case of health sector, the company paid decent amount of dividend
every year with little or no change in the dividend payout policy. The basic rule for the
companies is to pay the dividends in years they earn profit on the basis of the legal rules that are
applicable to them (Abbott & Kantor, 2017).
4.
This shows the movement of share of ANZ banking company for a month, where we see that the
company ecperienced a low share pricing at the end of march before the beginning of April, and that
might be contributed to the fact that this is the periof during which the company pays off its dividend
and thus the change in overall payment of dividend affects the company financials.
8 | P a g e
You're viewing a preview
Unlock full access by subscribing today!

9
In this we can see the shareprice movement of CSL limited for last one month, where it can be seen that
there has been no major fluctuations given to the fact that health sector is comparatively a stable
sector, but what can be seen that before the payment date of 14th April for the dividend the shareprice
of the company had increased, so all this shows that the company is doing well (Alexander, 2016).
9 | P a g e
Paraphrase This Document
Need a fresh take? Get an instant paraphrase of this document with our AI Paraphraser

10
References
Abbott, M. & Kantor, A., 2017. Fair Value Measurement and Mandated Accounting Changes: The Case of
the Victorian Rail Track Corporation. Australian accounting Review.
Alexander, F., 2016. The Changing Face of Accountability. The Journal of Higher Education, 71(4), pp.
411-431.
Chariri, A., 2017. FINANCIAL REPORTING PRACTICE AS A RITUAL: UNDERSTANDING ACCOUNTING
WITHIN INSTITUTIONAL FRAMEWORK. Journal of Economics, Business and Accountancy, 14(1).
Chiapello, E., 2017. Critical accounting research and neoliberalism. Critical Perspectives on Accounting,
Volume 43, pp. 47-64.
Chron, 2017. five-common-features-internal-control-system-business. [Online]
Available at: http://smallbusiness.chron.com/five-common-features-internal-control-system-business-
430.html
[Accessed 07 december 2017].
Dichev, I., 2017. On the conceptual foundations of financial reporting. Accounting and Business
Research, 47(6), pp. 617-632.
Maynard, J., 2017. Financial accounting reporting and analysis. second ed. United Kingdom: Oxford
University Press.
Vieira, R., O’Dwyer, B. & Schneider, R., 2017. Aligning Strategy and Performance Management Systems.
SAGE Journals, 30(1).
10 | P a g e

11
11 | P a g e
11 | P a g e
You're viewing a preview
Unlock full access by subscribing today!
1 out of 12

Your All-in-One AI-Powered Toolkit for Academic Success.
+13062052269
info@desklib.com
Available 24*7 on WhatsApp / Email
Unlock your academic potential
© 2024 | Zucol Services PVT LTD | All rights reserved.