Comprehensive Portfolio: Analyzing Economic Models & Indicators

Verified

Added on  2023/06/05

|8
|1503
|363
Portfolio
AI Summary
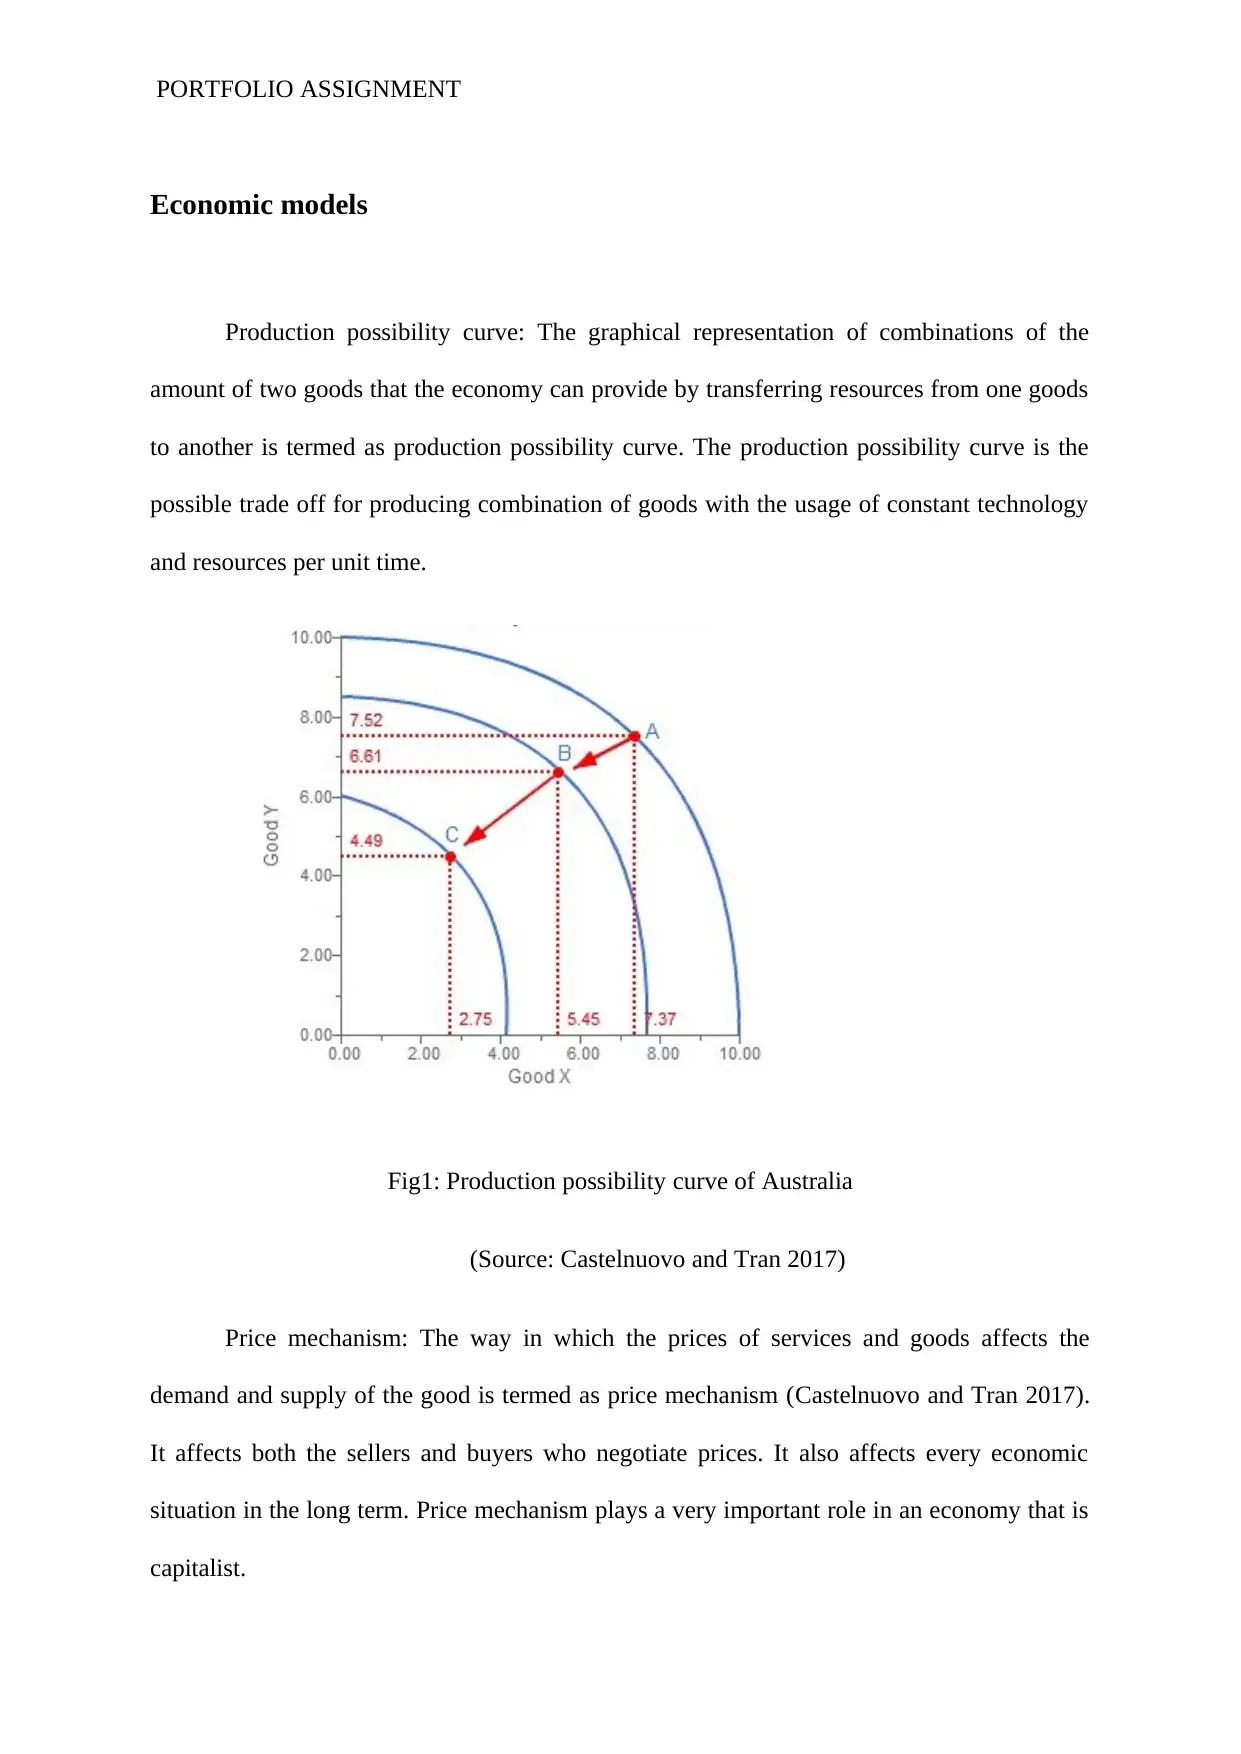
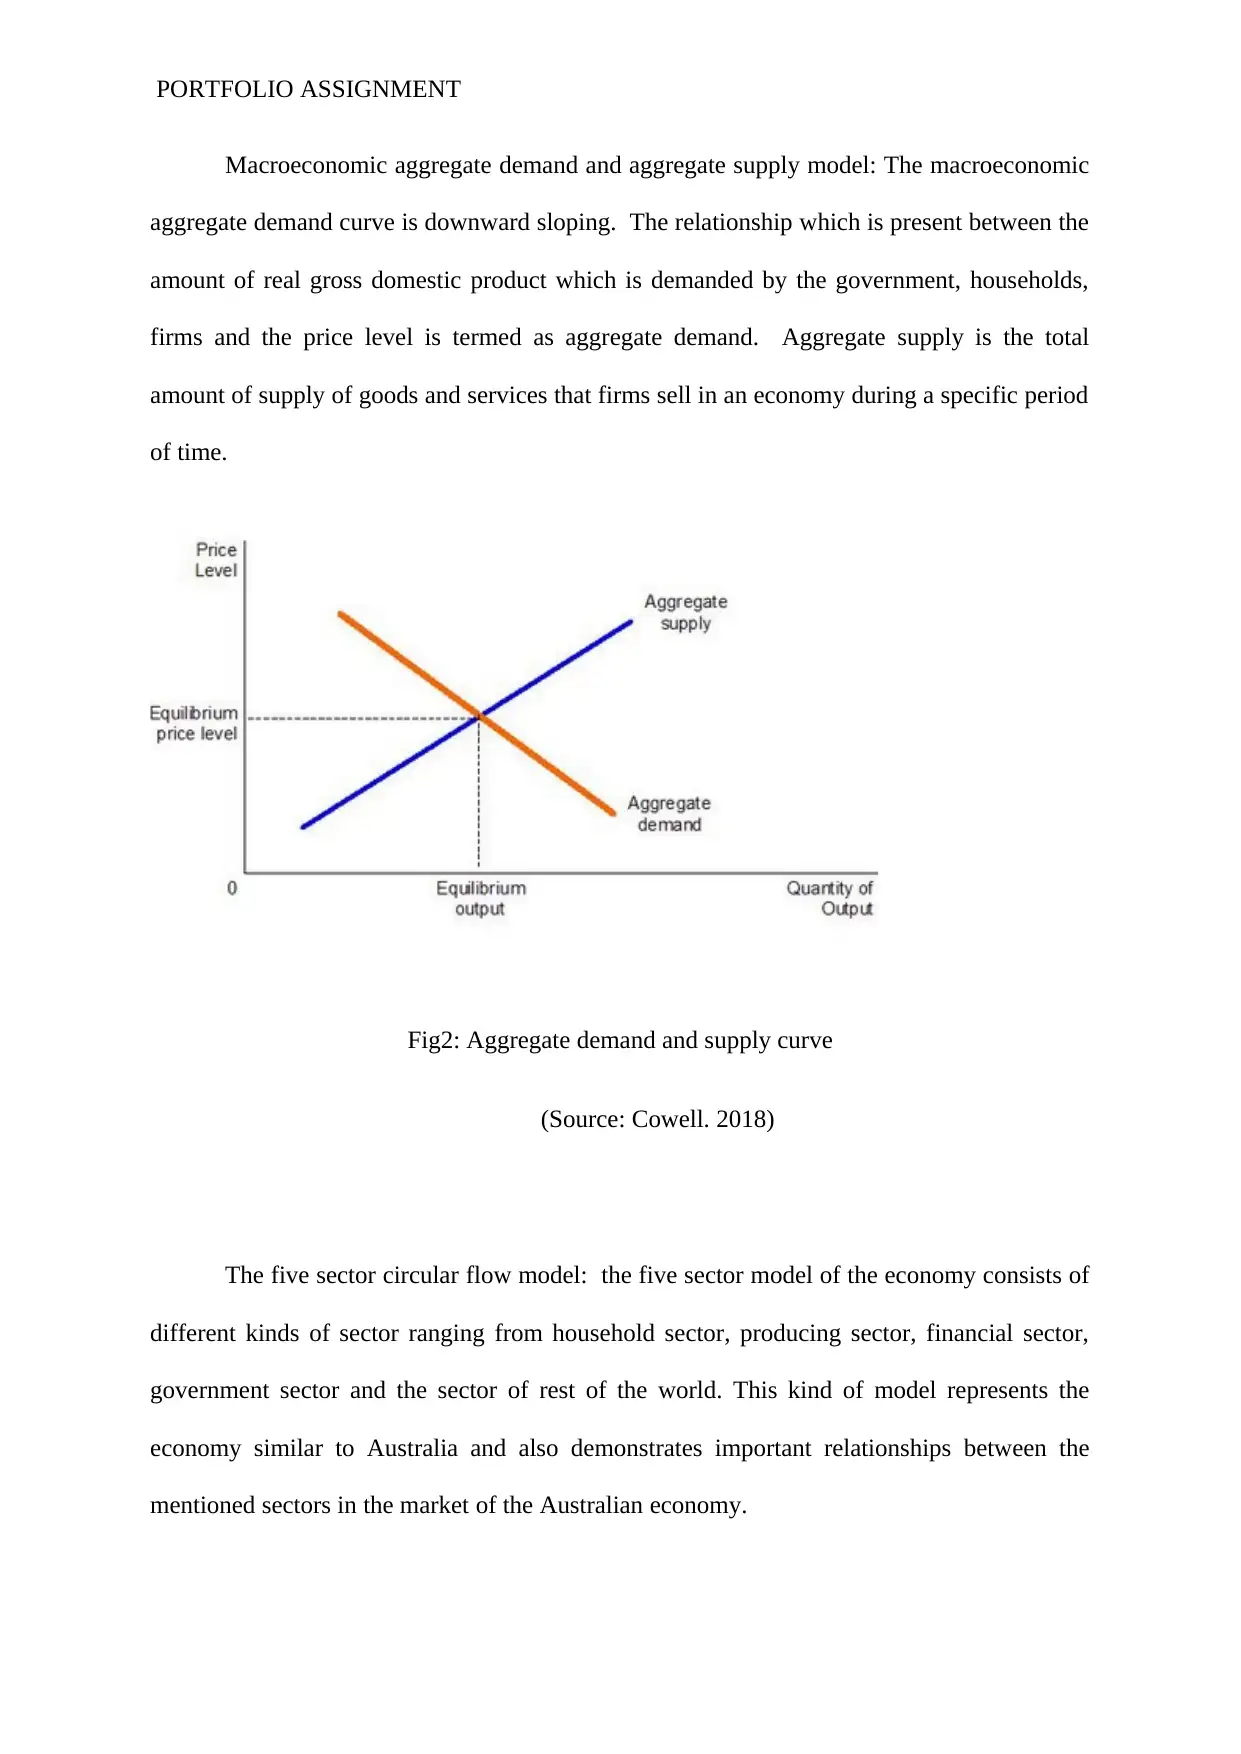
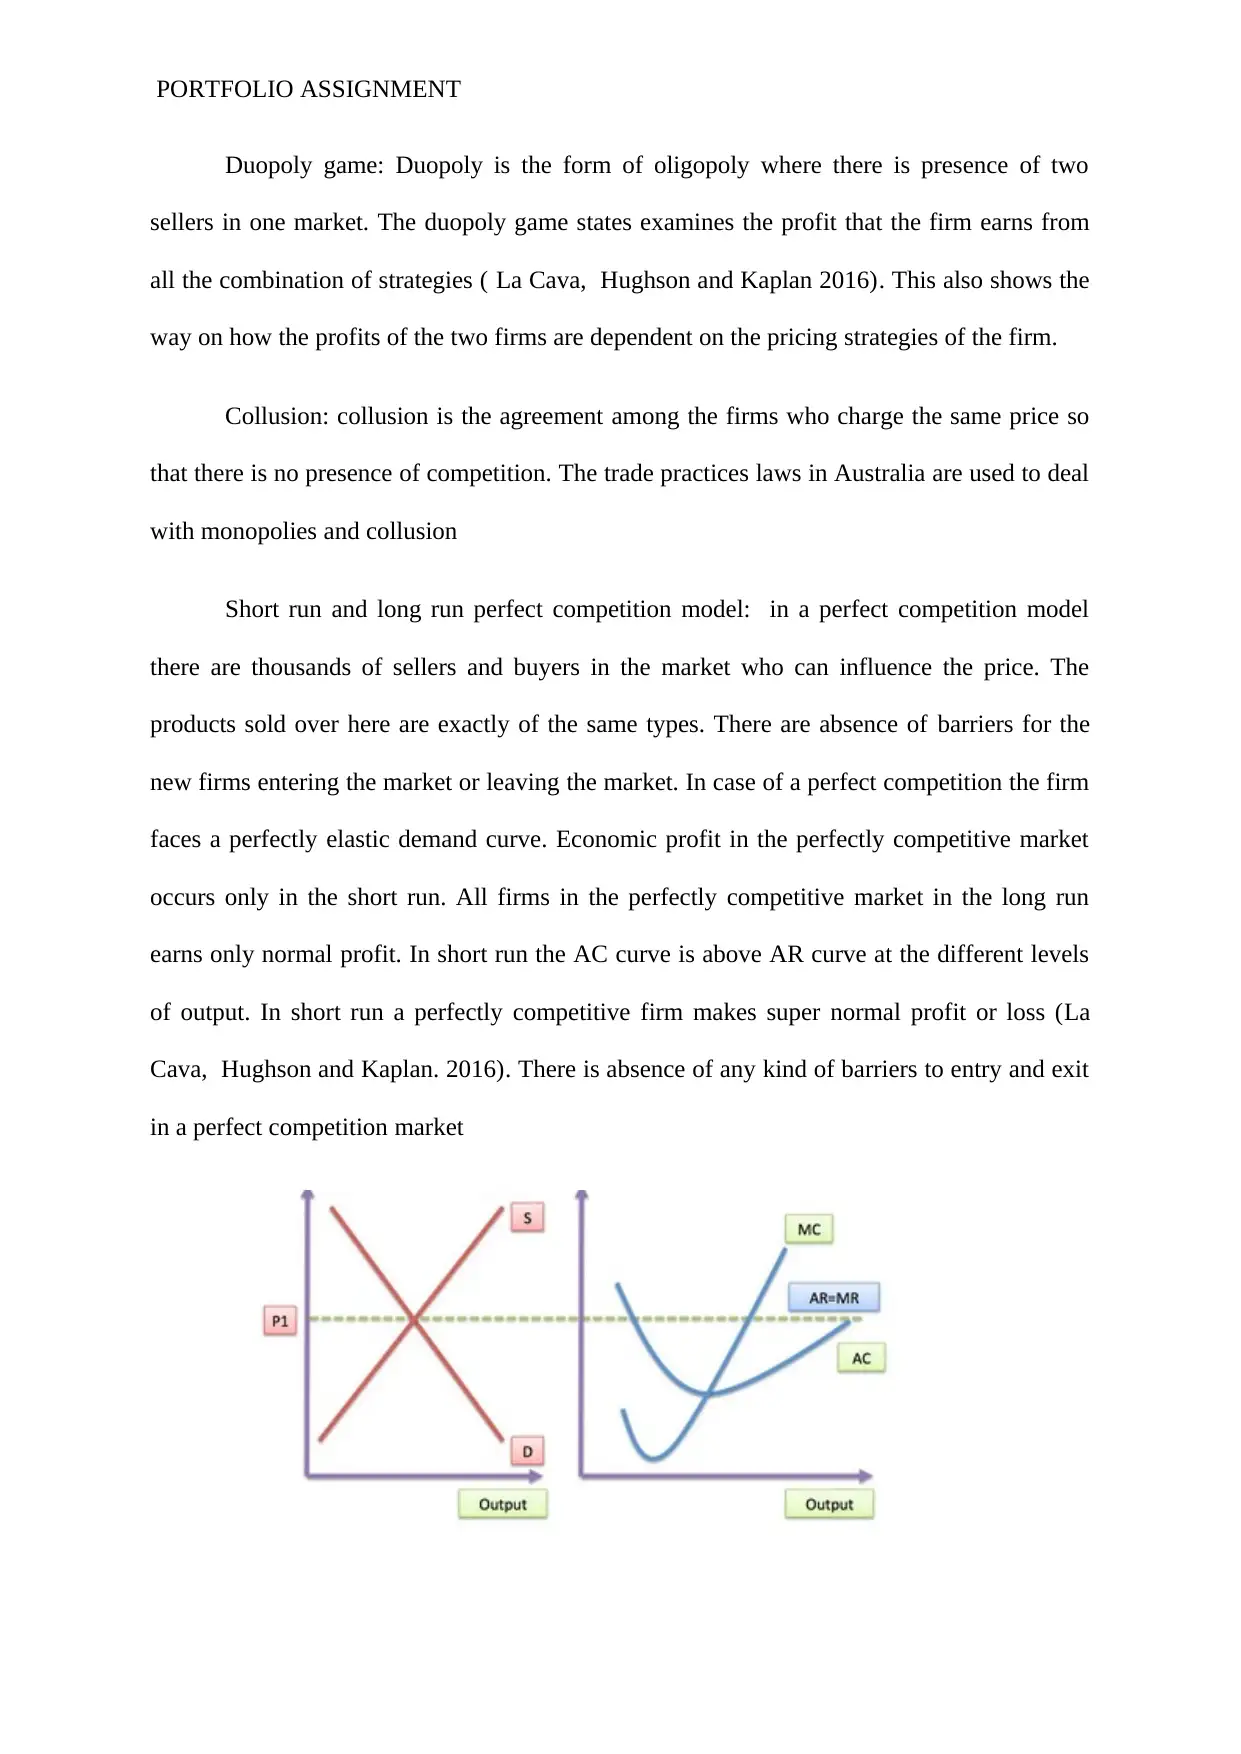
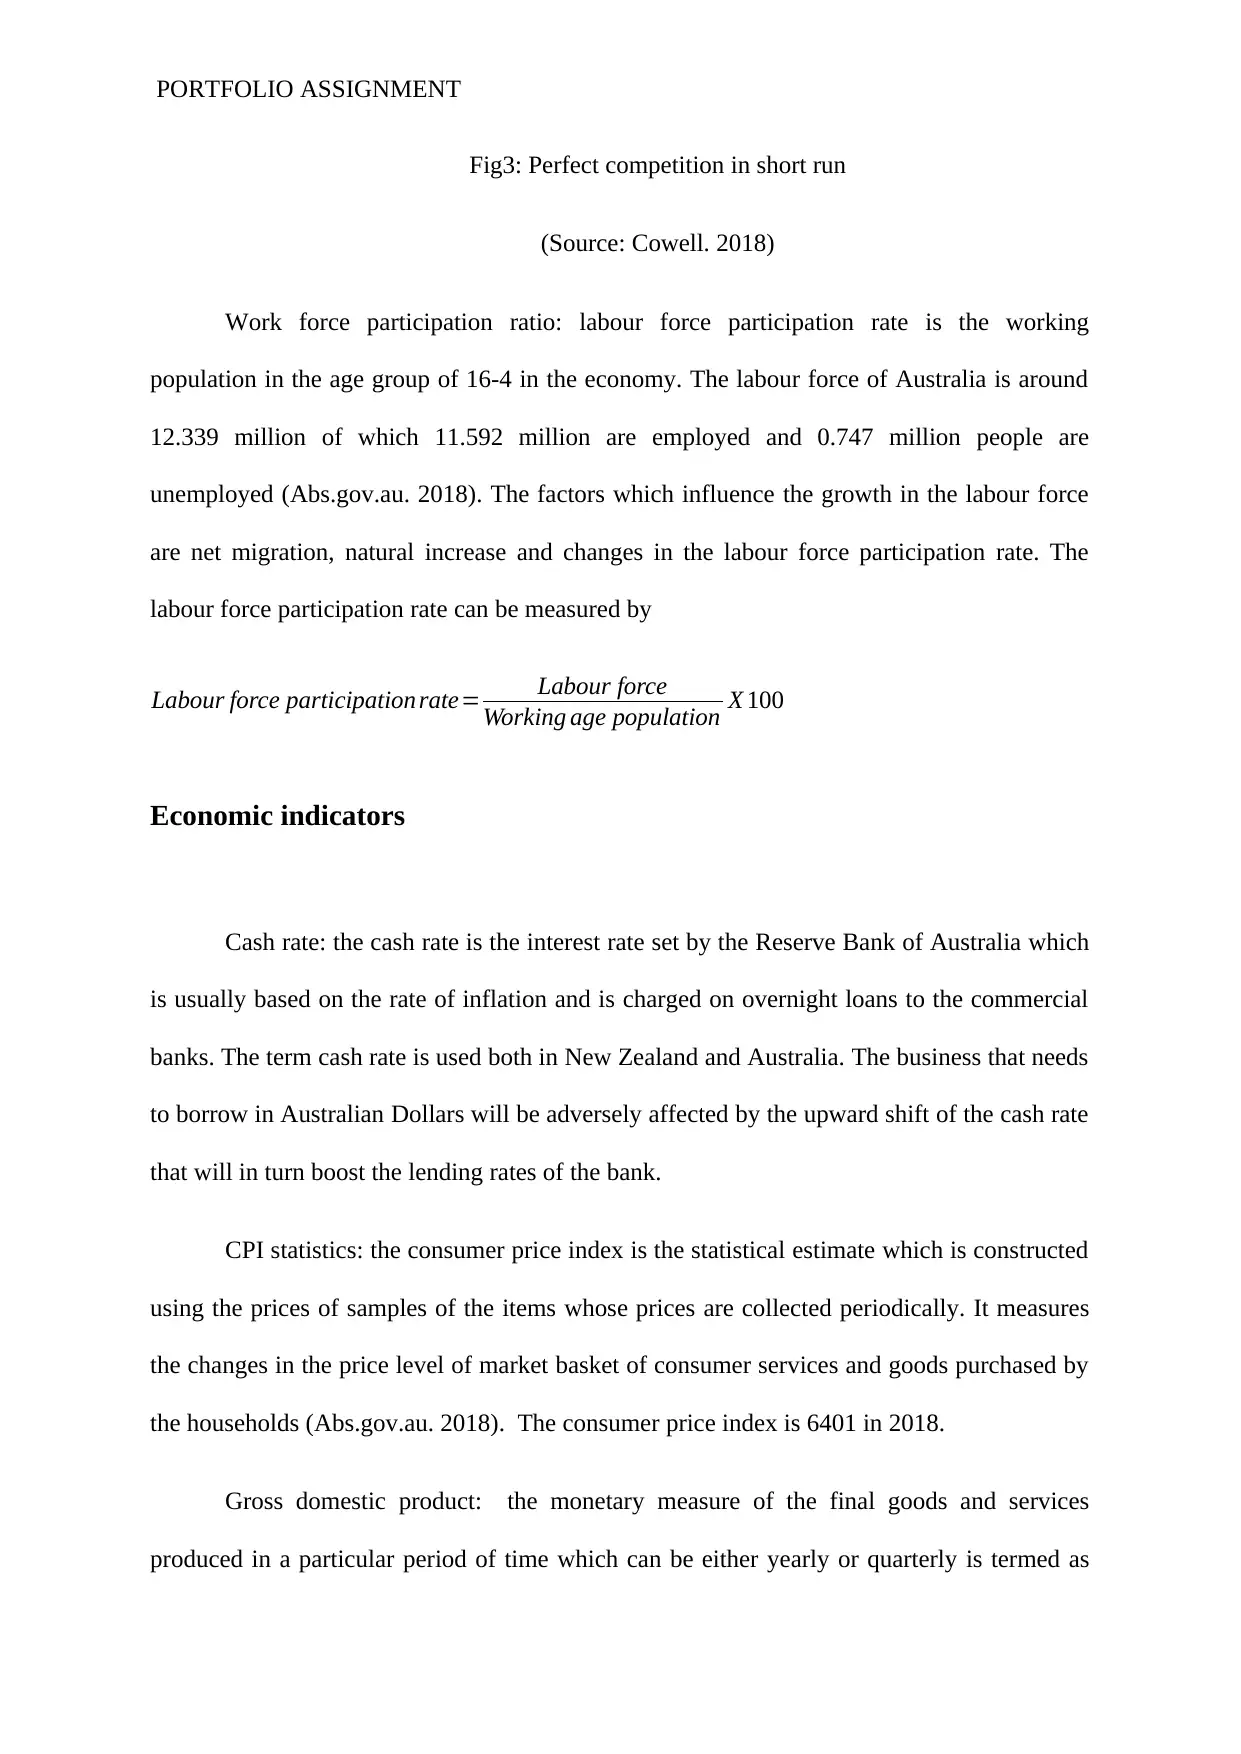
This portfolio assignment provides an overview of various economic models and indicators relevant to the Australian economy. It begins with microeconomic concepts like the Production Possibility Curve and Price Mechanism, illustrating trade-offs and price determination. It then transitions to macroeconomic models such as Aggregate Demand and Supply and the Five Sector Circular Flow Model, explaining economic relationships and flows. The portfolio also delves into market structures, including duopoly games, collusion, and short-run and long-run perfect competition. Furthermore, it discusses key economic indicators like the cash rate, CPI statistics, Gross Domestic Product, public debt, unemployment statistics, and productivity, explaining their significance and measurement. The document references various sources from the Australian Bureau of Statistics, Reserve Bank of Australia, and academic publications.
Document Page
Running head: PORTFOLIO ASSIGNMENT
Portfolio assignment
Name of the student
Named of the university
Author note
tabler-icon-diamond-filled.svg

Secure Best Marks with AI Grader

Need help grading? Try our AI Grader for instant feedback on your assignments.
Document Page
PORTFOLIO ASSIGNMENT
Economic models
Production possibility curve: The graphical representation of combinations of the
amount of two goods that the economy can provide by transferring resources from one goods
to another is termed as production possibility curve. The production possibility curve is the
possible trade off for producing combination of goods with the usage of constant technology
and resources per unit time.
Fig1: Production possibility curve of Australia
(Source: Castelnuovo and Tran 2017)
Price mechanism: The way in which the prices of services and goods affects the
demand and supply of the good is termed as price mechanism (Castelnuovo and Tran 2017).
It affects both the sellers and buyers who negotiate prices. It also affects every economic
situation in the long term. Price mechanism plays a very important role in an economy that is
capitalist.
Document Page
PORTFOLIO ASSIGNMENT
Macroeconomic aggregate demand and aggregate supply model: The macroeconomic
aggregate demand curve is downward sloping. The relationship which is present between the
amount of real gross domestic product which is demanded by the government, households,
firms and the price level is termed as aggregate demand. Aggregate supply is the total
amount of supply of goods and services that firms sell in an economy during a specific period
of time.
Fig2: Aggregate demand and supply curve
(Source: Cowell. 2018)
The five sector circular flow model: the five sector model of the economy consists of
different kinds of sector ranging from household sector, producing sector, financial sector,
government sector and the sector of rest of the world. This kind of model represents the
economy similar to Australia and also demonstrates important relationships between the
mentioned sectors in the market of the Australian economy.
Document Page
PORTFOLIO ASSIGNMENT
Duopoly game: Duopoly is the form of oligopoly where there is presence of two
sellers in one market. The duopoly game states examines the profit that the firm earns from
all the combination of strategies ( La Cava, Hughson and Kaplan 2016). This also shows the
way on how the profits of the two firms are dependent on the pricing strategies of the firm.
Collusion: collusion is the agreement among the firms who charge the same price so
that there is no presence of competition. The trade practices laws in Australia are used to deal
with monopolies and collusion
Short run and long run perfect competition model: in a perfect competition model
there are thousands of sellers and buyers in the market who can influence the price. The
products sold over here are exactly of the same types. There are absence of barriers for the
new firms entering the market or leaving the market. In case of a perfect competition the firm
faces a perfectly elastic demand curve. Economic profit in the perfectly competitive market
occurs only in the short run. All firms in the perfectly competitive market in the long run
earns only normal profit. In short run the AC curve is above AR curve at the different levels
of output. In short run a perfectly competitive firm makes super normal profit or loss (La
Cava, Hughson and Kaplan. 2016). There is absence of any kind of barriers to entry and exit
in a perfect competition market
tabler-icon-diamond-filled.svg

Secure Best Marks with AI Grader

Need help grading? Try our AI Grader for instant feedback on your assignments.
Document Page
PORTFOLIO ASSIGNMENT
Fig3: Perfect competition in short run
(Source: Cowell. 2018)
Work force participation ratio: labour force participation rate is the working
population in the age group of 16-4 in the economy. The labour force of Australia is around
12.339 million of which 11.592 million are employed and 0.747 million people are
unemployed (Abs.gov.au. 2018). The factors which influence the growth in the labour force
are net migration, natural increase and changes in the labour force participation rate. The
labour force participation rate can be measured by
Labour force participation rate= Labour force
Working age population X 100
Economic indicators
Cash rate: the cash rate is the interest rate set by the Reserve Bank of Australia which
is usually based on the rate of inflation and is charged on overnight loans to the commercial
banks. The term cash rate is used both in New Zealand and Australia. The business that needs
to borrow in Australian Dollars will be adversely affected by the upward shift of the cash rate
that will in turn boost the lending rates of the bank.
CPI statistics: the consumer price index is the statistical estimate which is constructed
using the prices of samples of the items whose prices are collected periodically. It measures
the changes in the price level of market basket of consumer services and goods purchased by
the households (Abs.gov.au. 2018). The consumer price index is 6401 in 2018.
Gross domestic product: the monetary measure of the final goods and services
produced in a particular period of time which can be either yearly or quarterly is termed as
Document Page
PORTFOLIO ASSIGNMENT
gross domestic product. Australia is largely a mixed market economy with having a gross
domestic product of around A$1.69 trillion in 2017. The amount of goods and services
produced in a country is called the gross domestic product (Ward et al. 2016) GDP is used for
measuring the economy. It is therefore used for measuring the total output of economy.
Public debt: Public debt is the debt which is owned by the government and are of six
different types. The government debt of Australia is the amount owned by the Australian
Federal Government. In the year 2017, the public debt of Australia was around $551.75
billion. The debt fluctuates from week to week depending on the receipts of the government
(Castelnuovo and Tran 2017). There are two types of debt, one is the internal debt and
another kind is the external debt.
Unemployment statistics: according to the Australian Bureau of statistics a person id
termed to be an unemployed when he has not worked in a week, however he must be actively
looking for work. On the other hand, a person is termed to be employed when he has been
working and is paid. The working age population of Australia is around 19.121 million and of
that 0.747 million people are unemployed in nature (Gregory and Smith 2016). The
unemployment rate can be measured as:
Unemployment rate= Number of unemployed
Labour force X 100
The unemployment rate is therefore 6.1% in Australia.
Productivity: the different measures of the efficiency of production is described as
productivity. The ratio of outputs to inputs used in the production process is the measure of
productivity (Carvalho 2015). Productivity is one of the crucial factors in production
performance of nations and firms. The productivity of Australia had been 101.80 index points
in 2018.
Document Page
PORTFOLIO ASSIGNMENT
tabler-icon-diamond-filled.svg

Paraphrase This Document

Need a fresh take? Get an instant paraphrase of this document with our AI Paraphraser
Document Page
PORTFOLIO ASSIGNMENT
Reference list
Abs.gov.au. (2018). Australian Bureau of Statistics, Australian Government. [online]
Available at: http://www.abs.gov.au/ [Accessed 15 Sep. 2018].
Carvalho, P., 2015. Youth unemployment in Australia. Policy: A Journal of Public Policy
and Ideas, 31(4), p.36.
Castelnuovo, E. and Tran, T.D., 2017. Google it up! A Google trends-based uncertainty index
for the United States and Australia. Economics Letters, 161, pp.149-153.
Cowell, F., 2018. Microeconomics: principles and analysis. Oxford University Press.
Gregory, R.G. and Smith, R.E., 2016. 15 Unemployment, Inflation and Job Creation Policies
in Australia. Inflation and Unemployment: Theory, Experience and Policy Making, p.325.
Kryger, T., 2015. Casual employment in Australia: A quick guide. Parliamentary Library.
La Cava, G., Hughson, H. and Kaplan, G., 2016. The household cash flow channel of
monetary policy. Reserve Bank of Australia, Research Discussion Papers, (2016-12).
Manalo, J., Perera, D. and Rees, D.M., 2015. Exchange rate movements and the Australian
economy. Economic Modelling, 47, pp.53-62.
Ward, J.D., Sutton, P.C., Werner, A.D., Costanza, R., Mohr, S.H. and Simmons, C.T., 2016.
Is decoupling GDP growth from environmental impact possible?. PloS one, 11(10),
p.e0164733.
chevron_up_icon
1 out of 8
circle_padding
hide_on_mobile
zoom_out_icon
[object Object]