Application of Portfolio Theory and Empirical Estimation Analysis

Verified

Added on  2020/06/06

|16
|1701
|94
Project
AI Summary
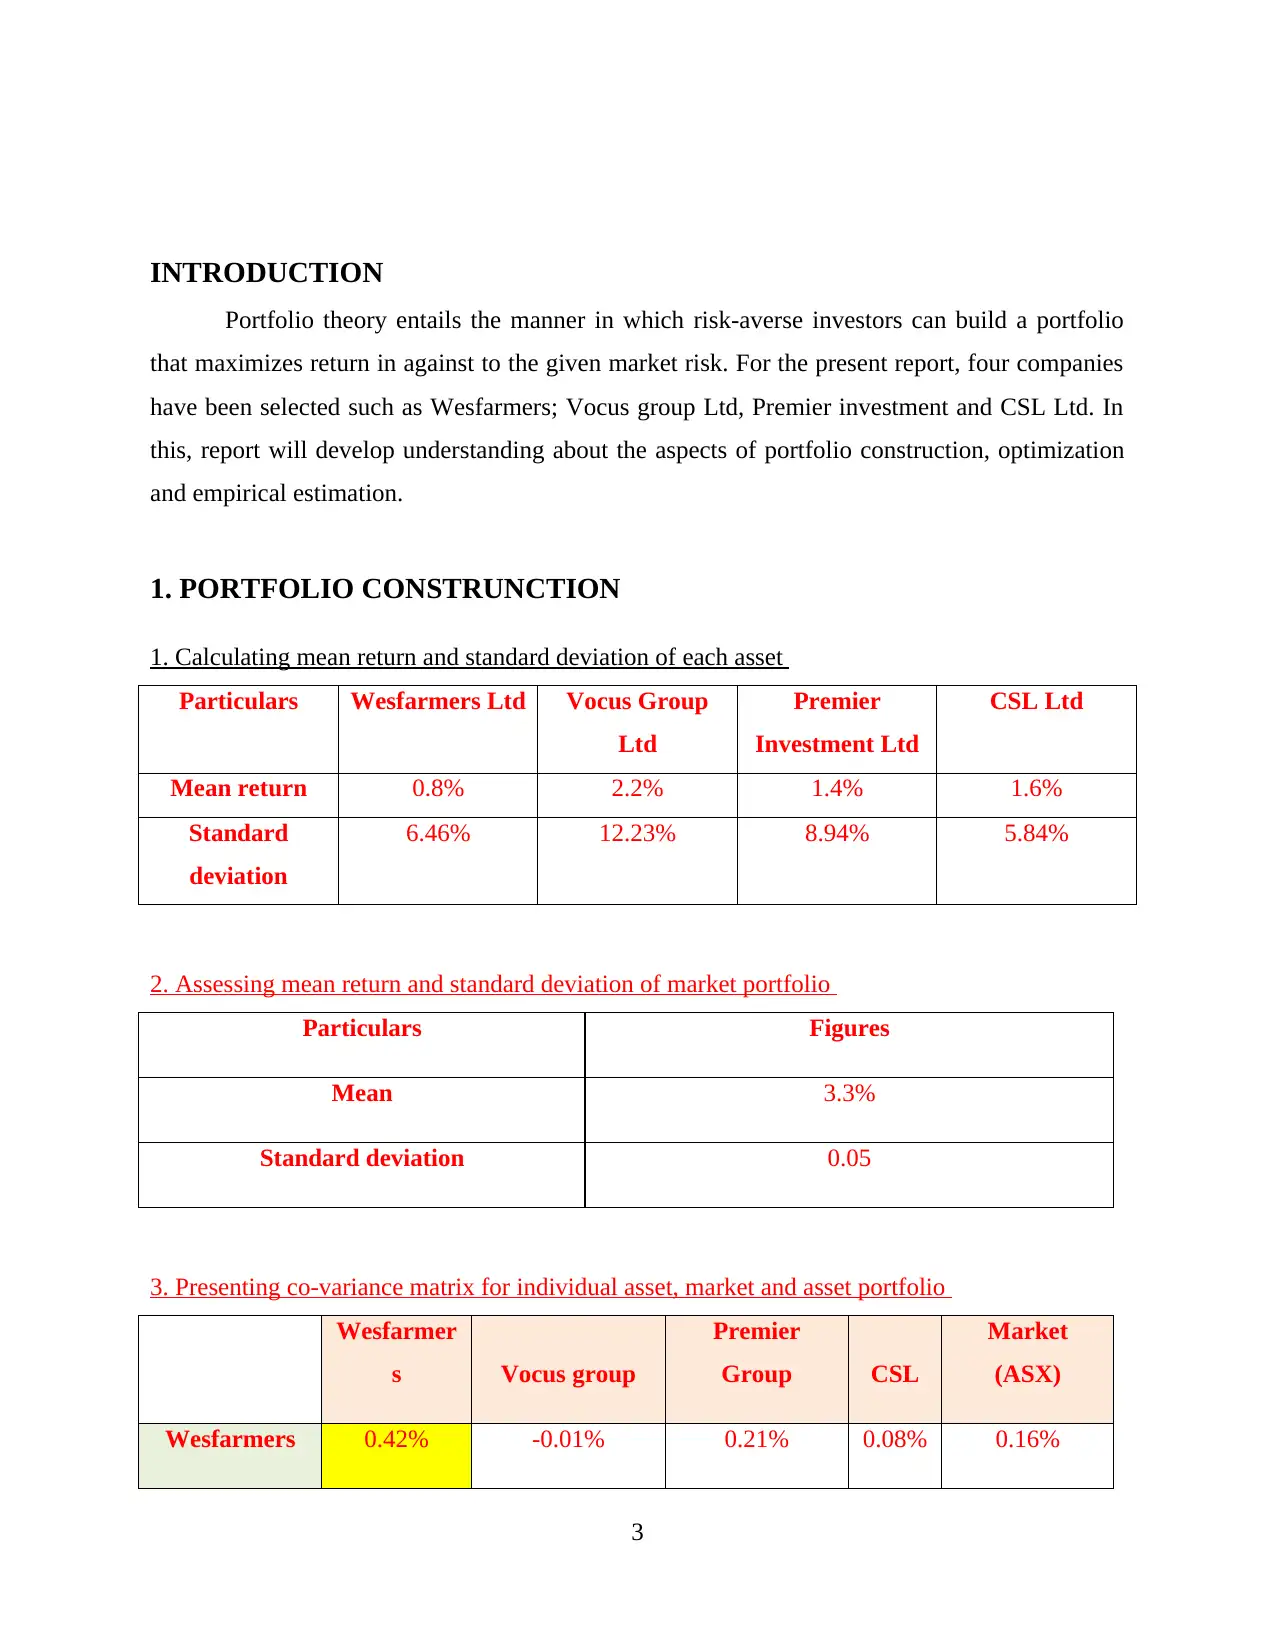
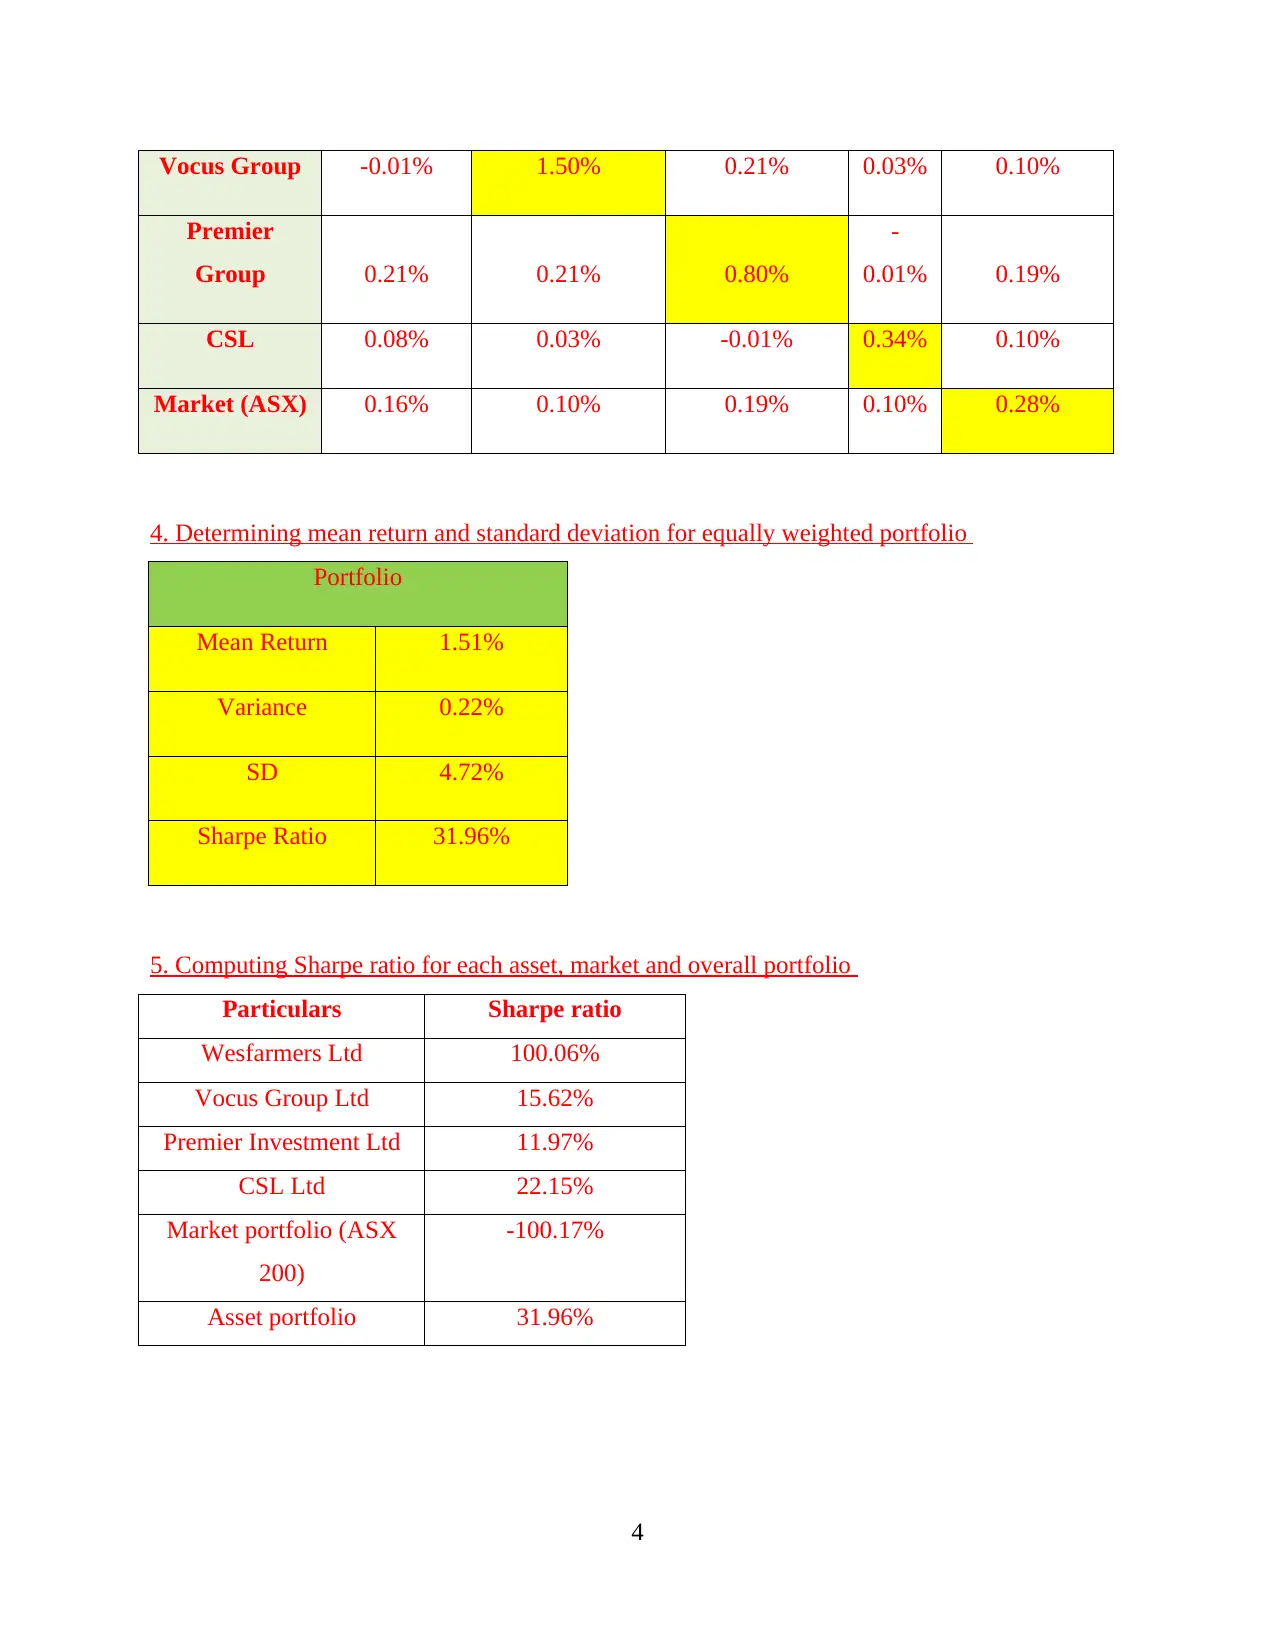
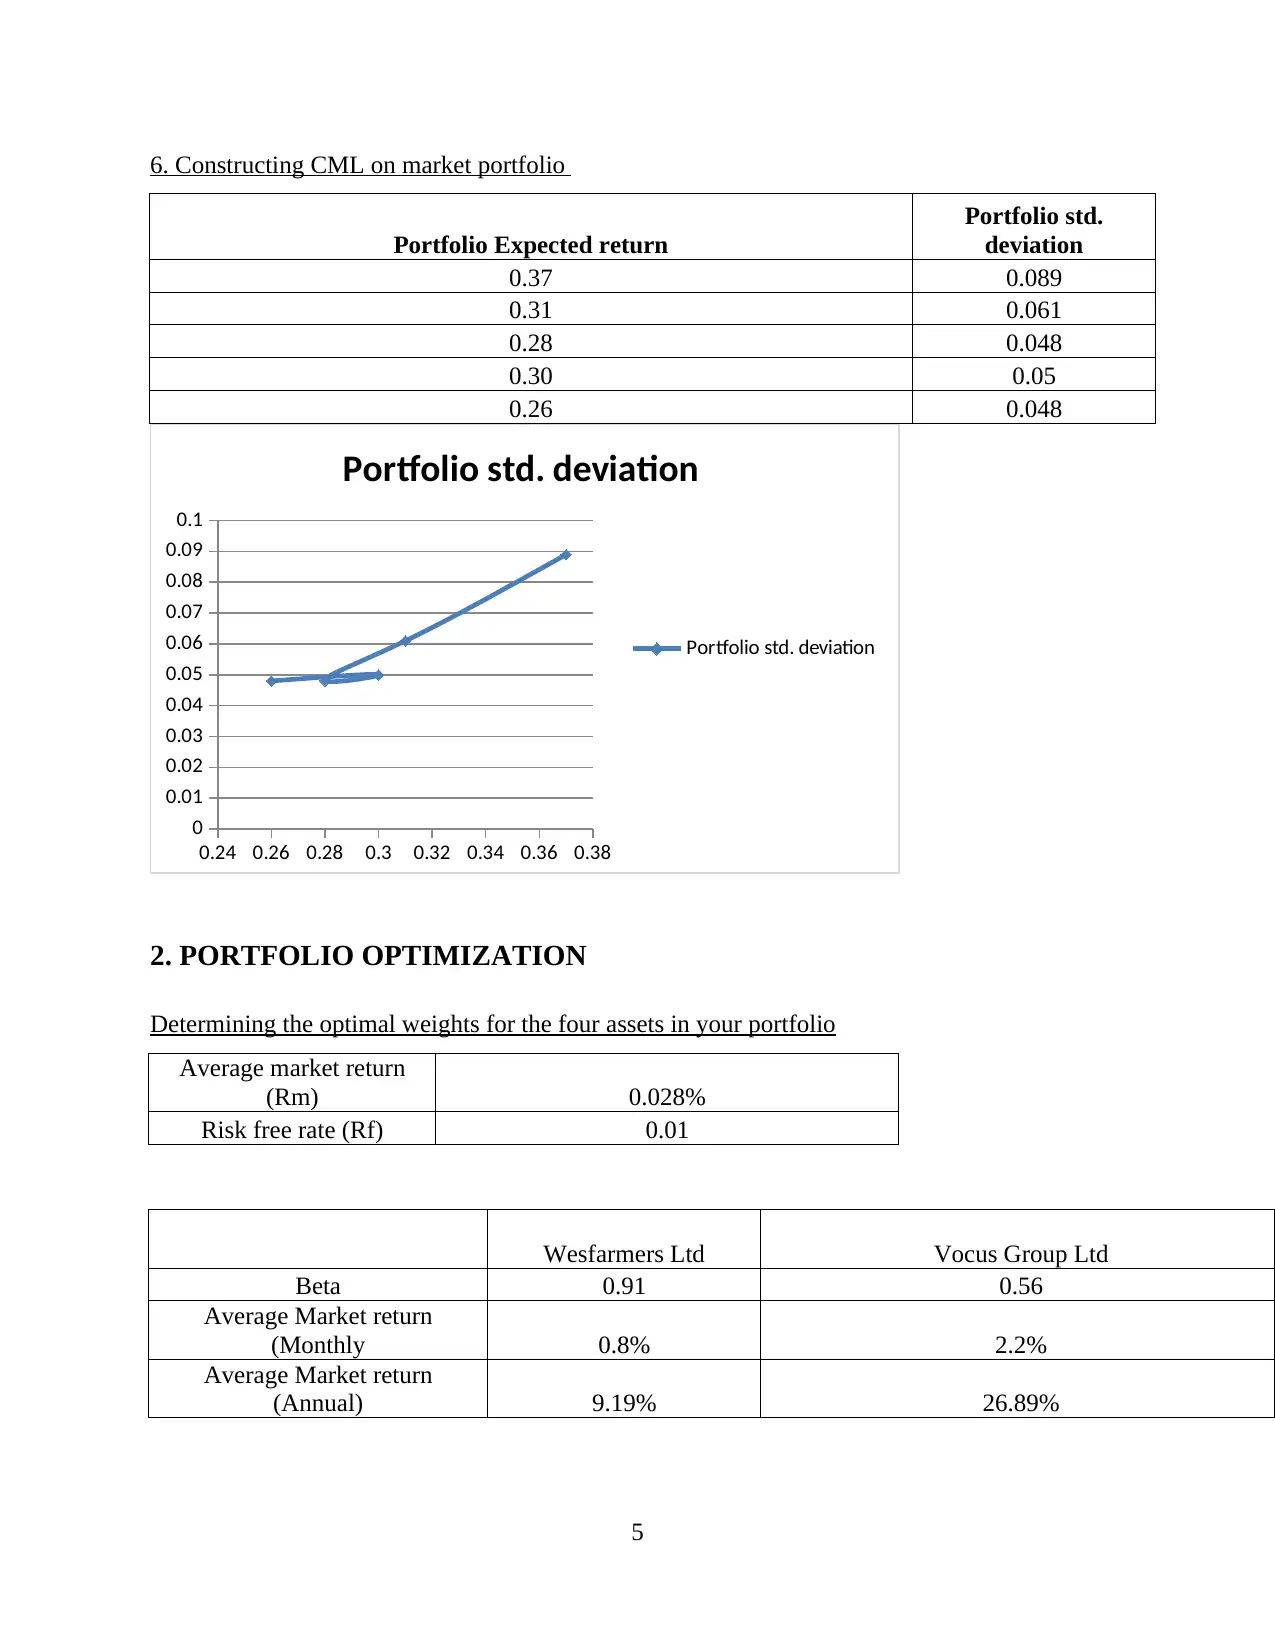
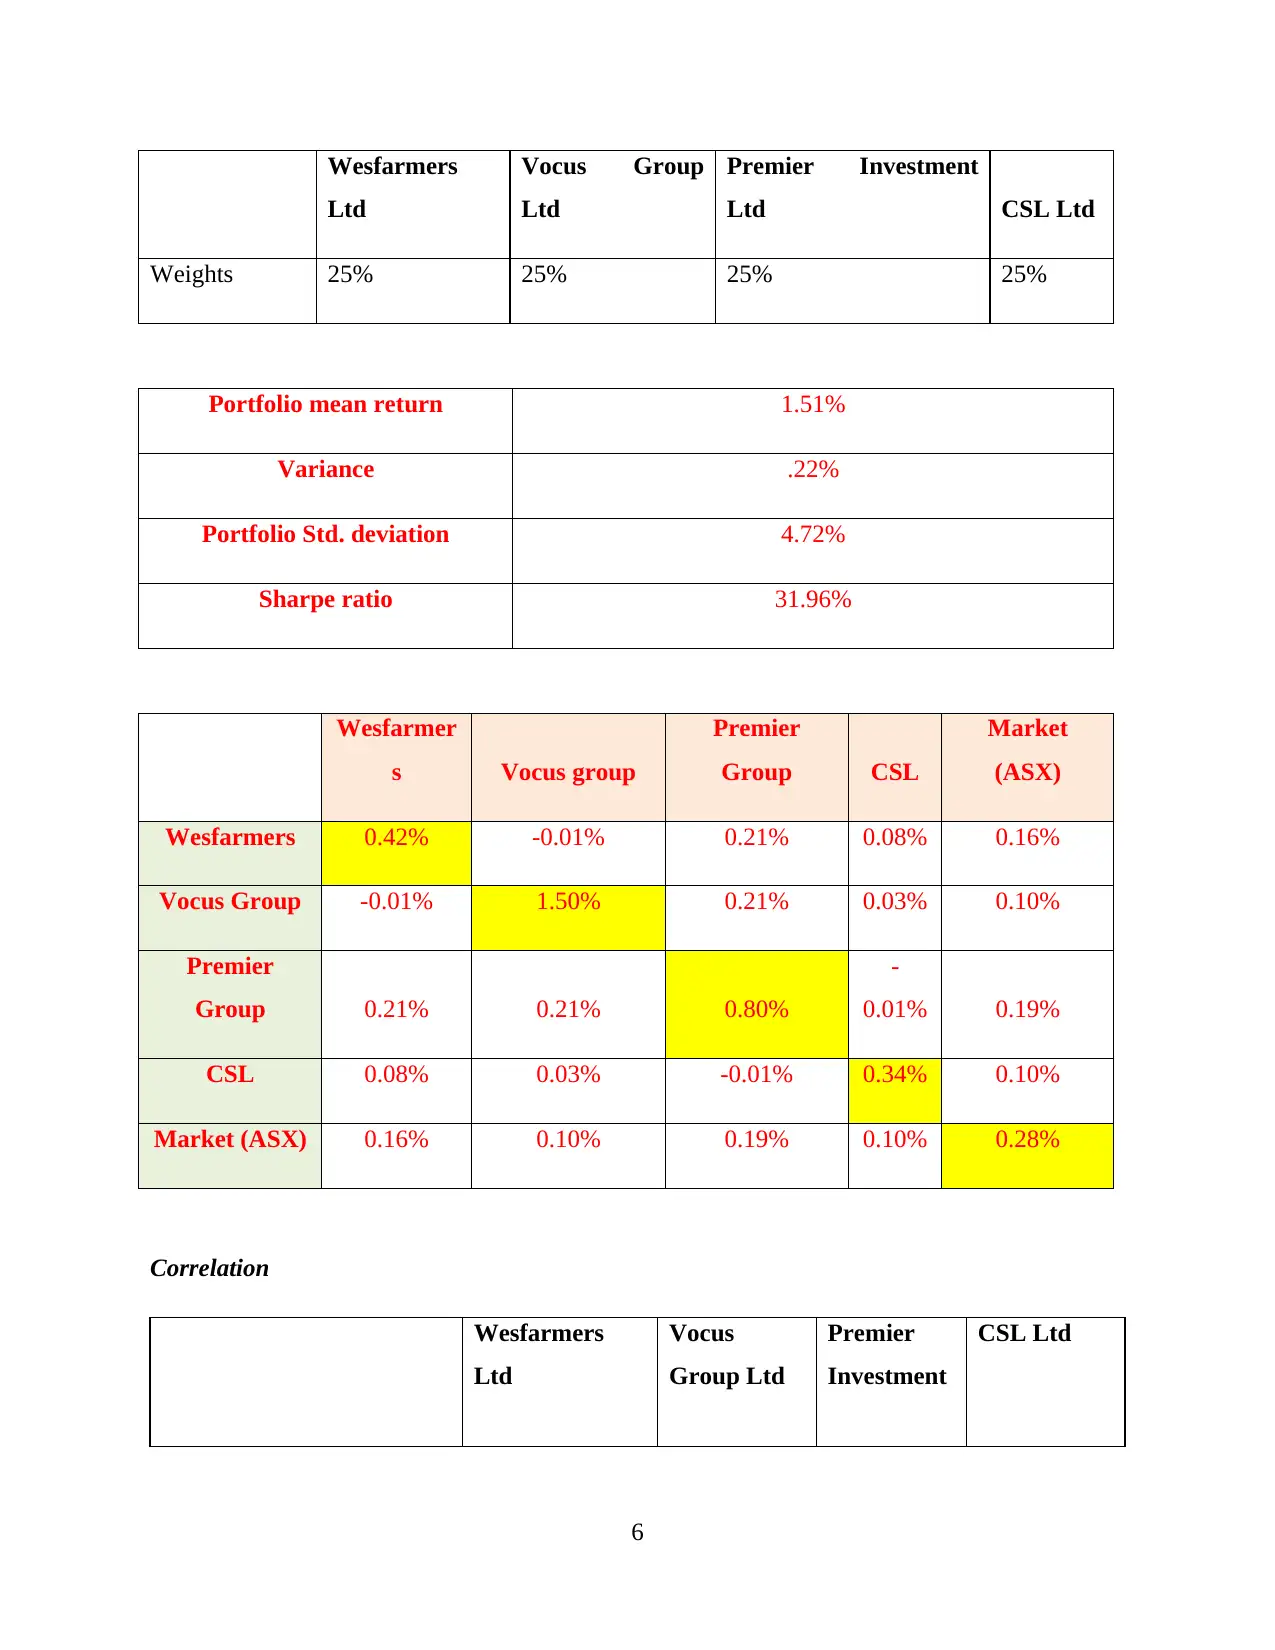
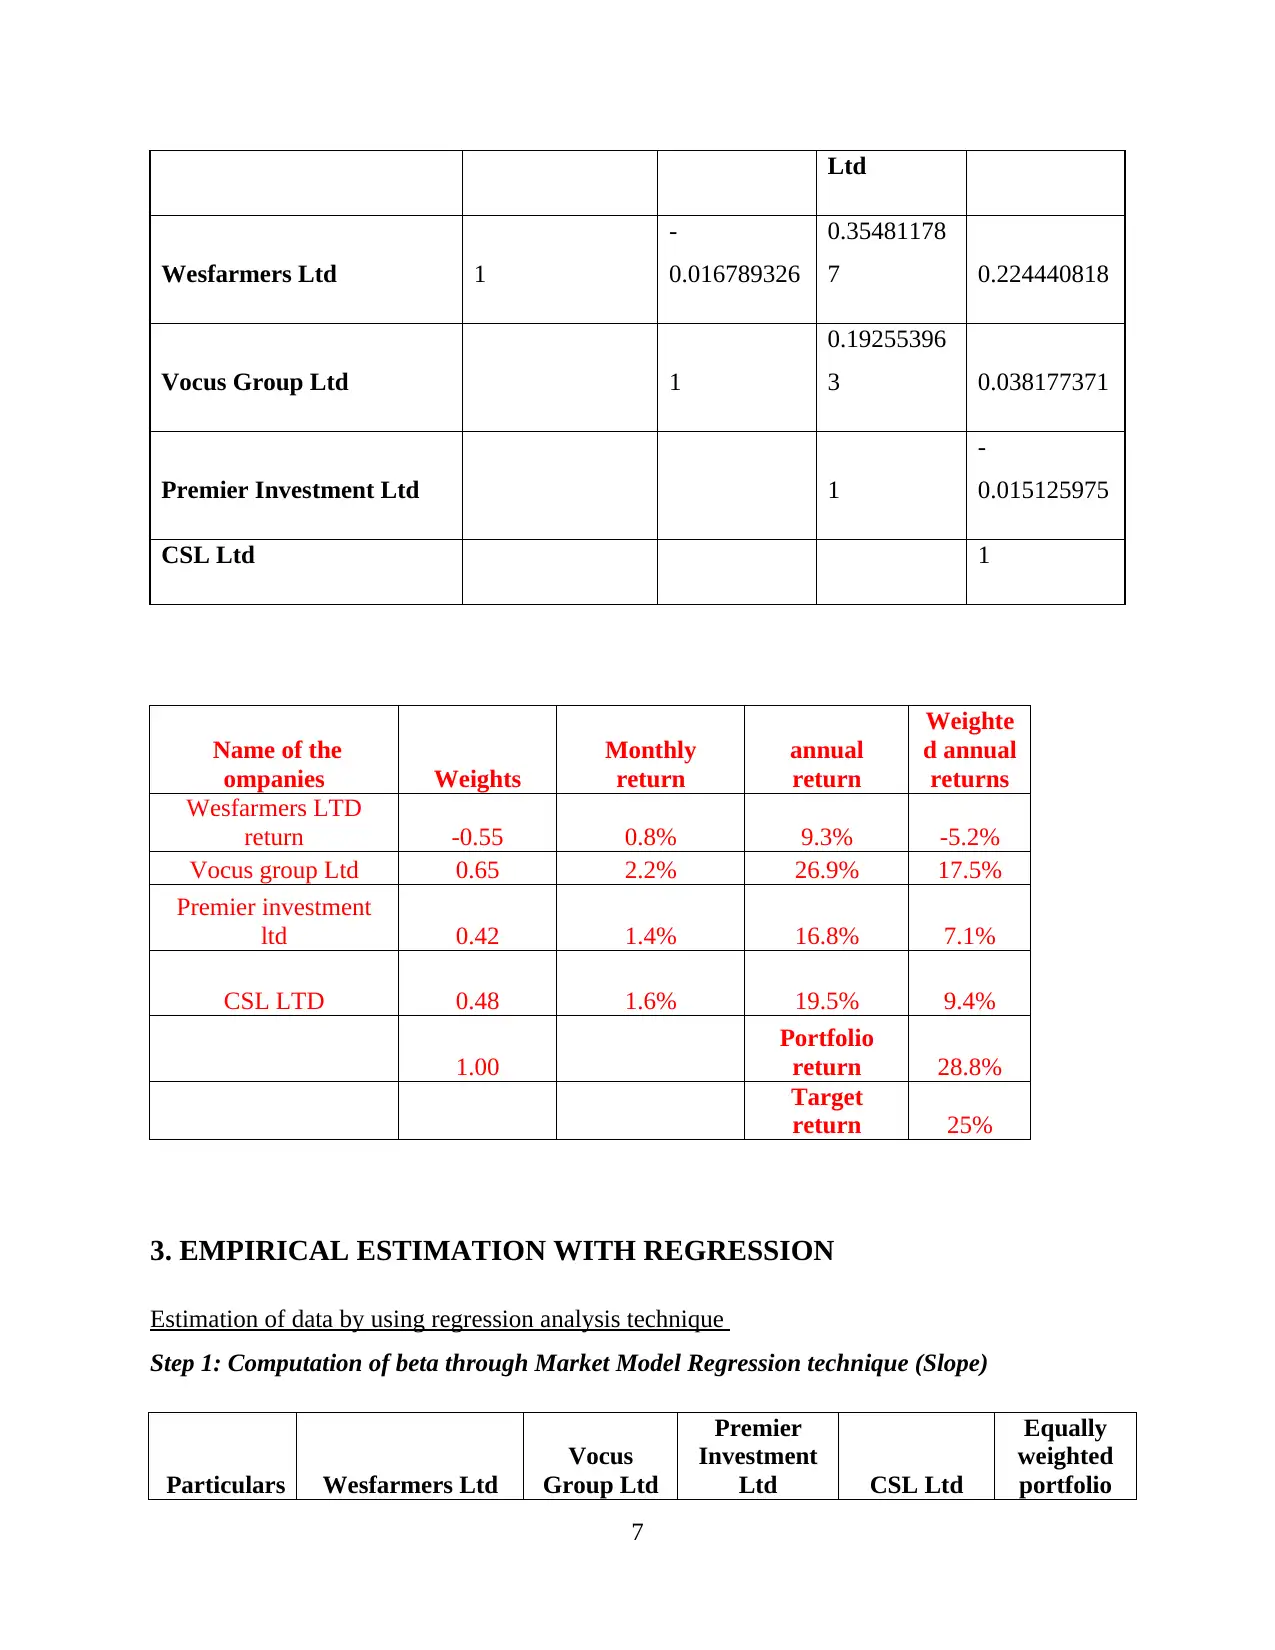
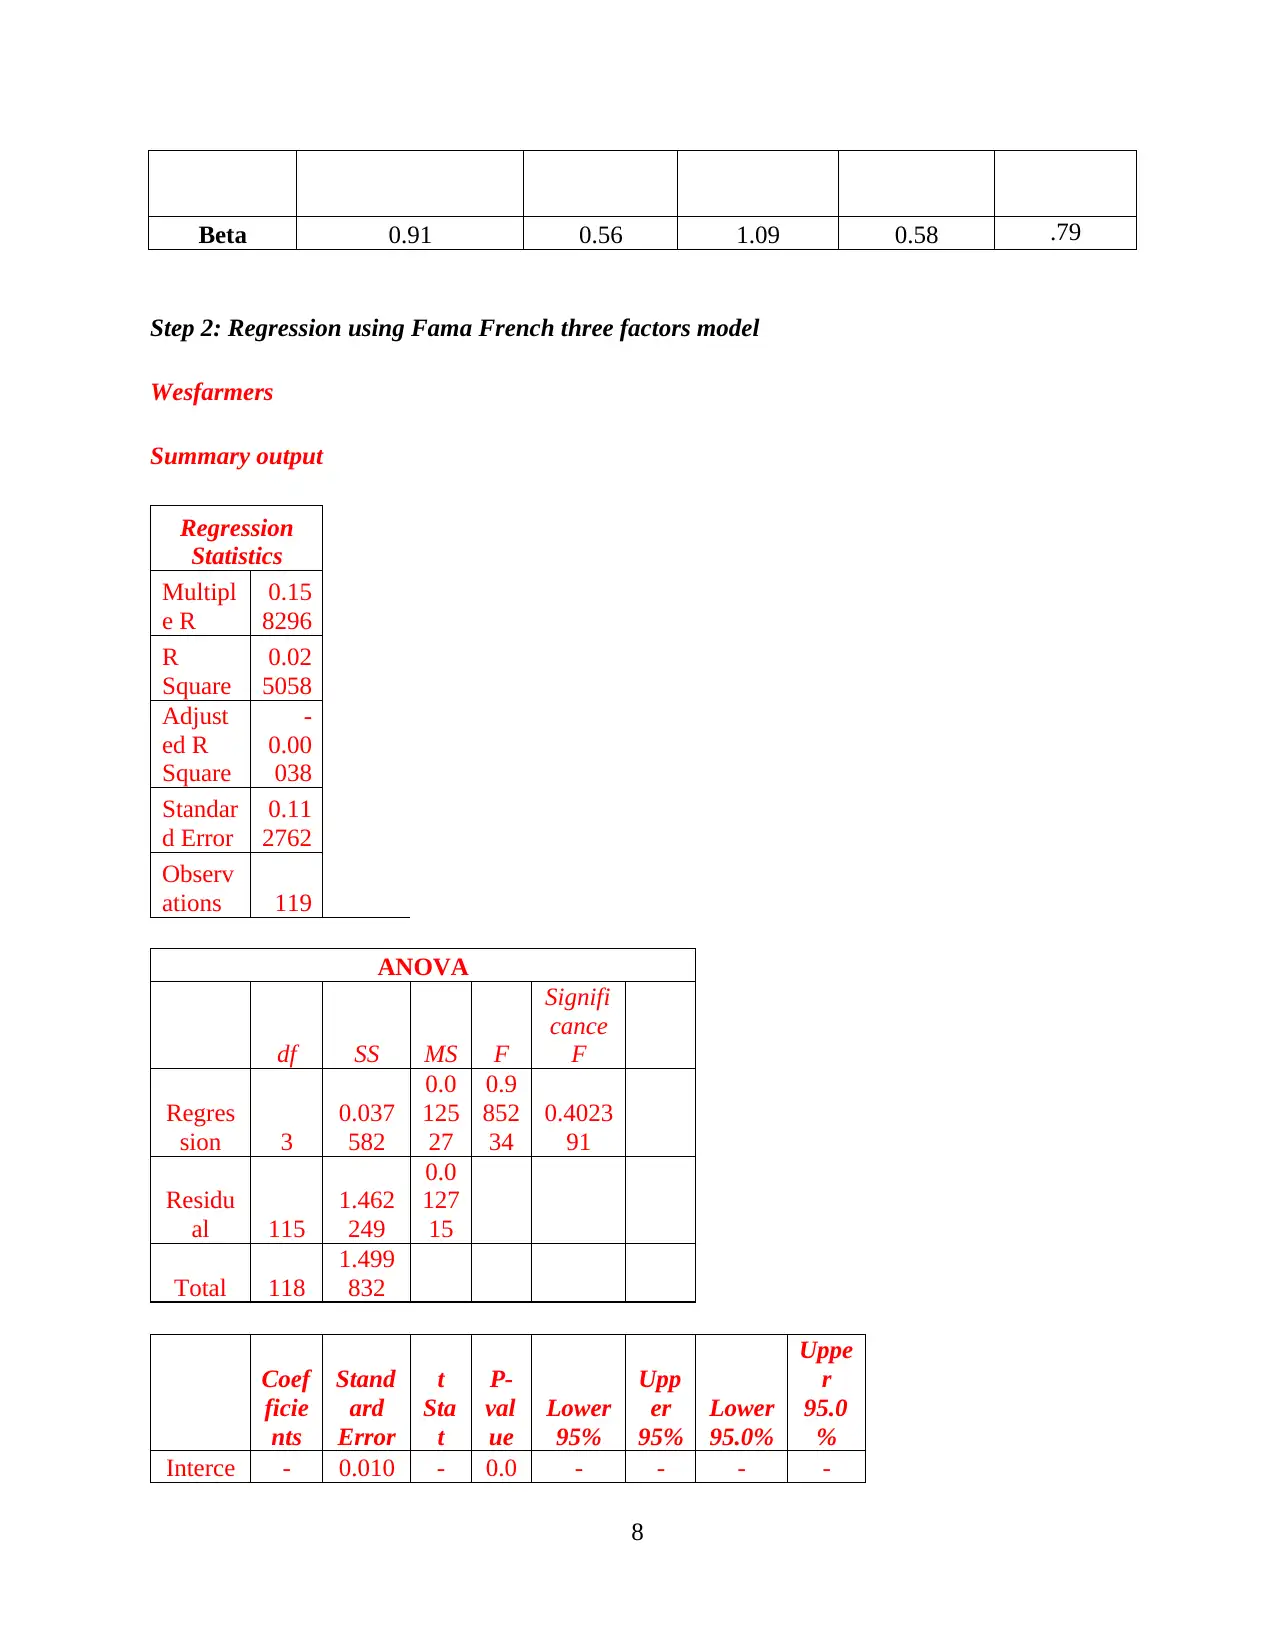
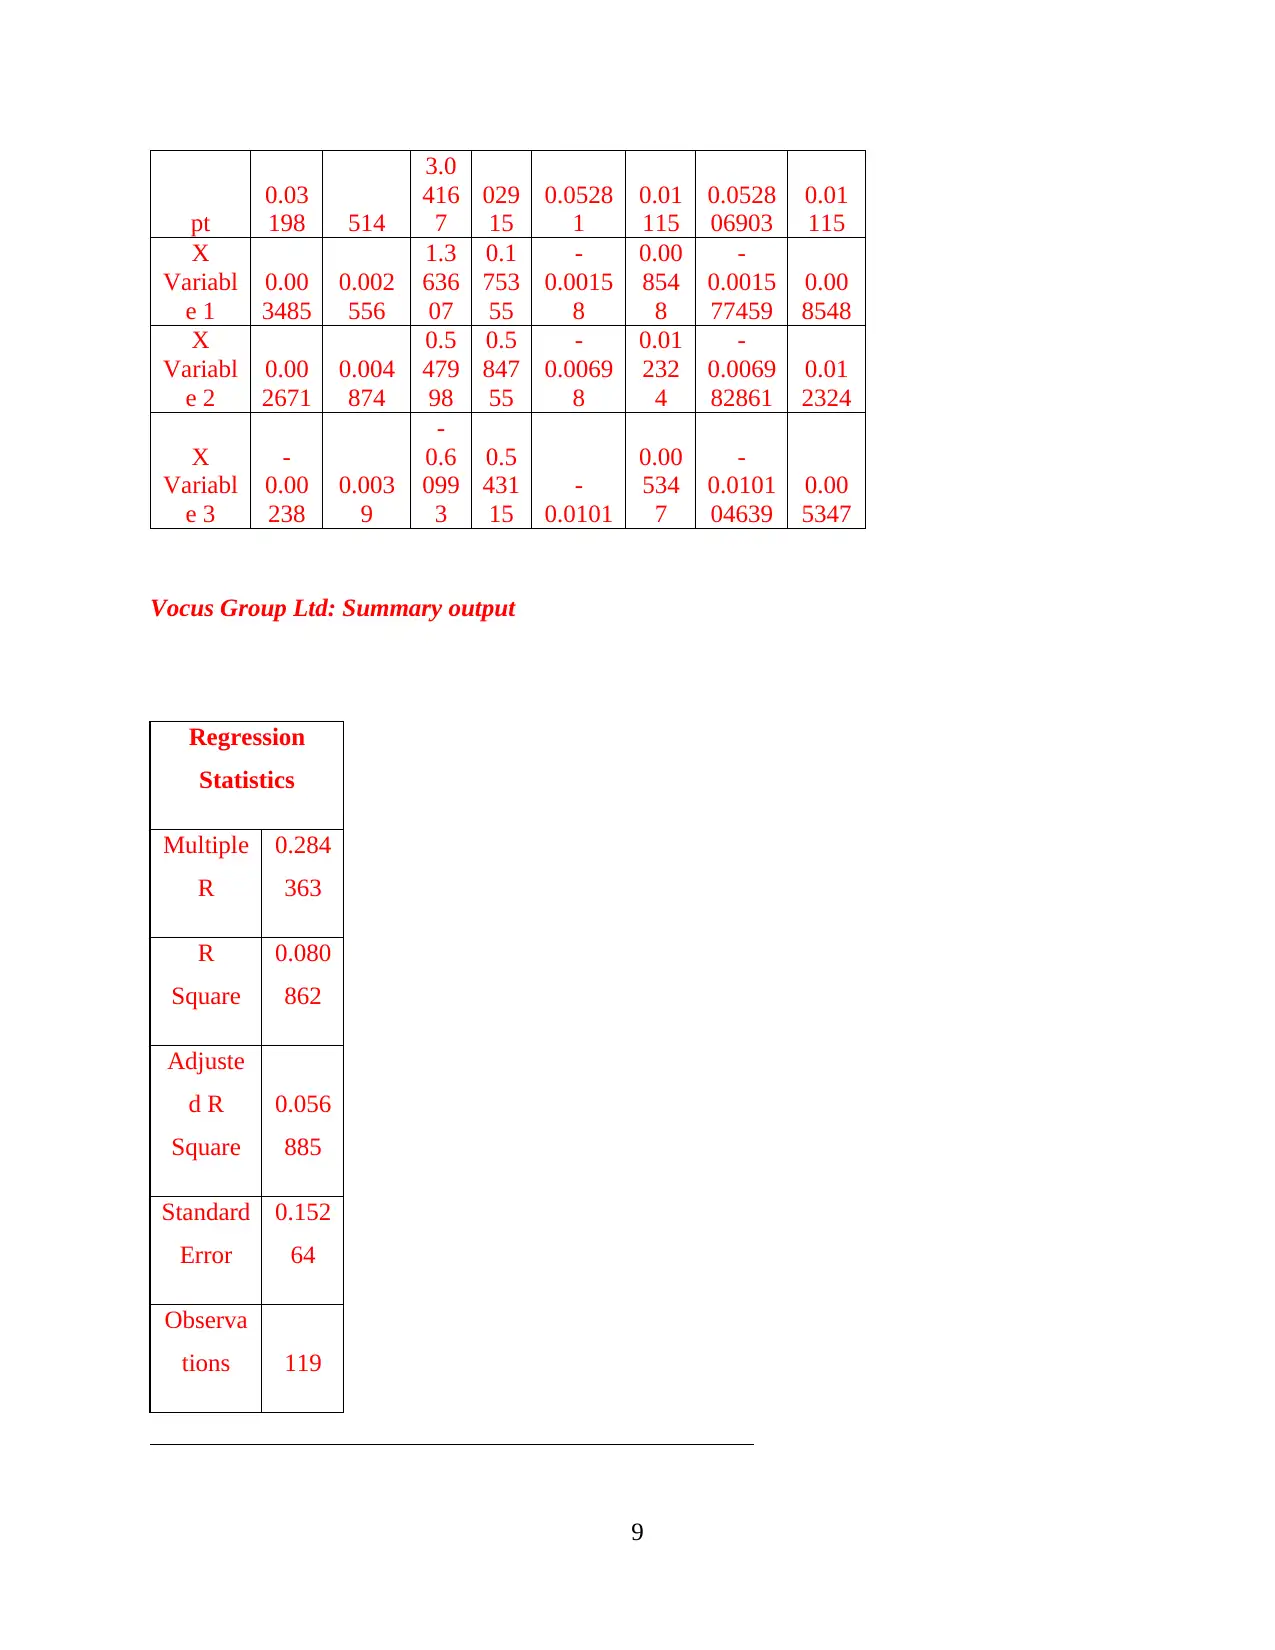
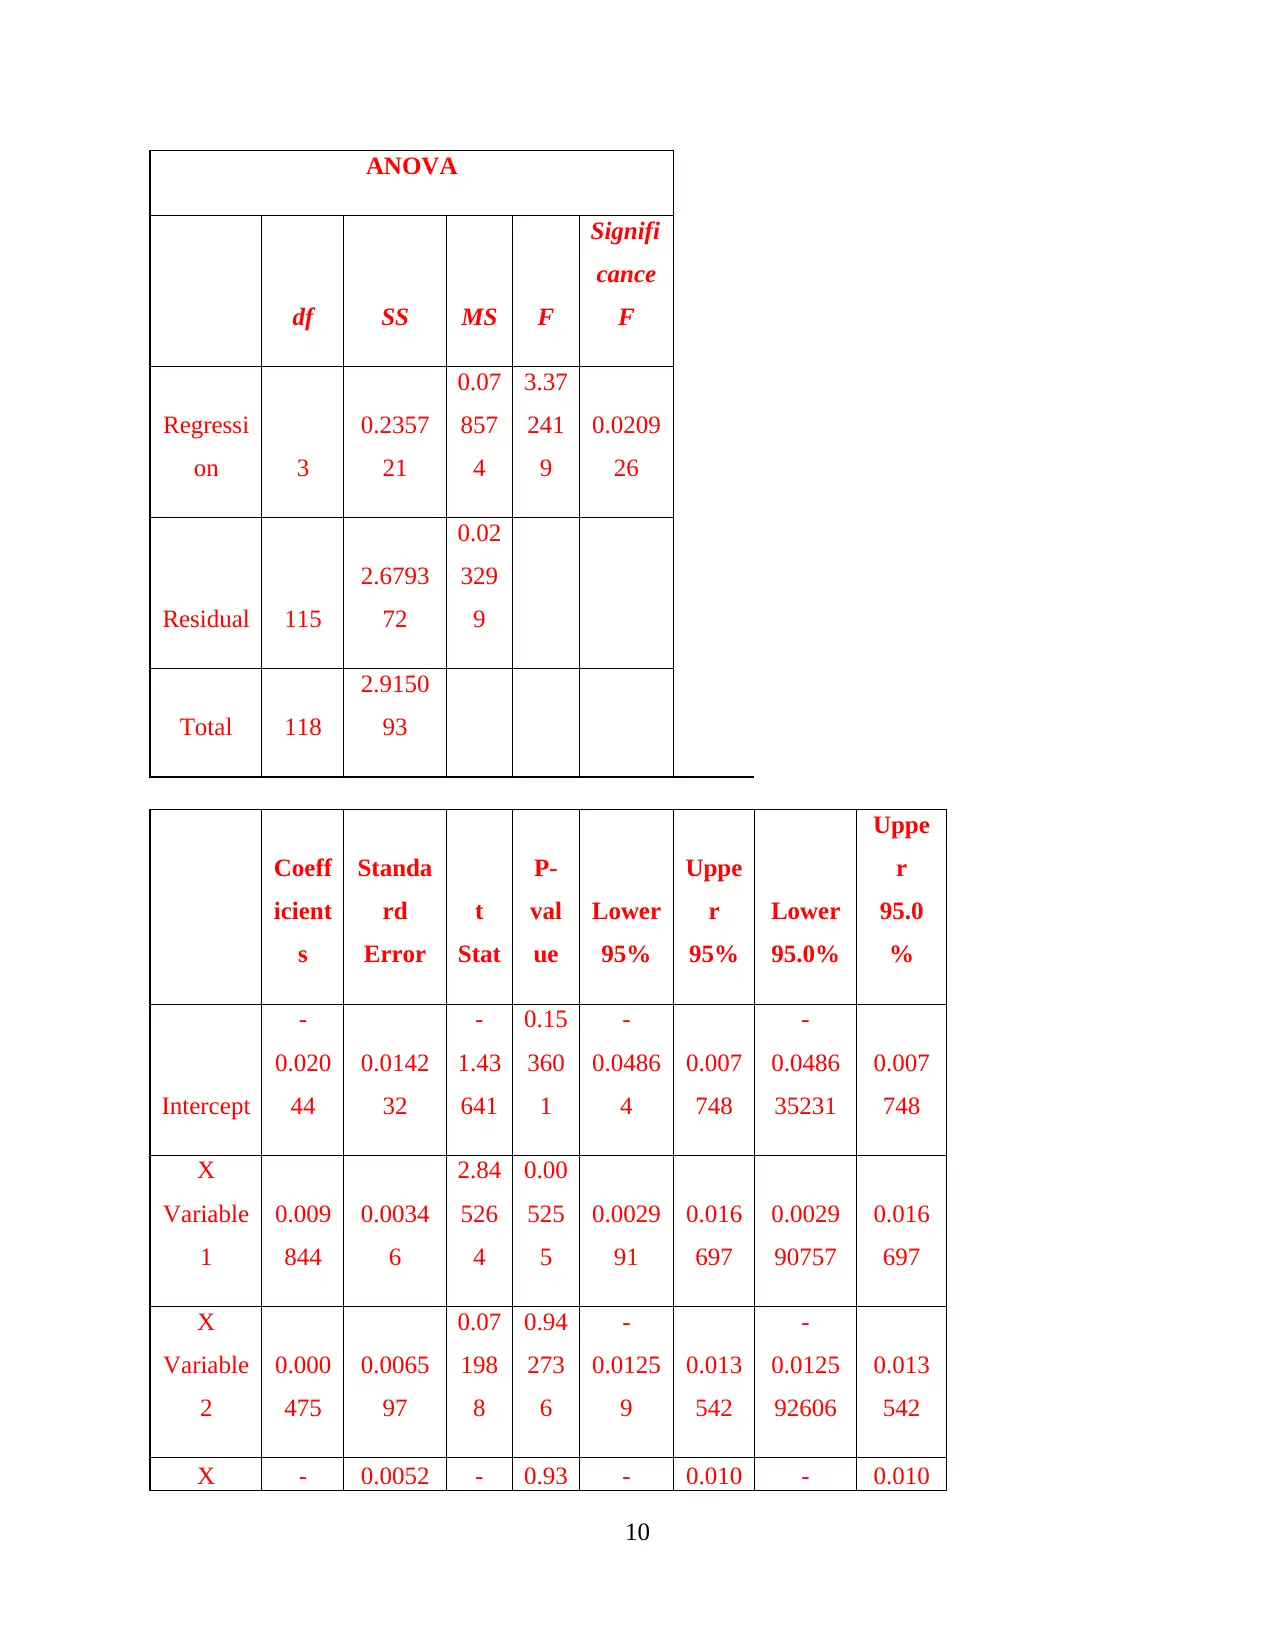
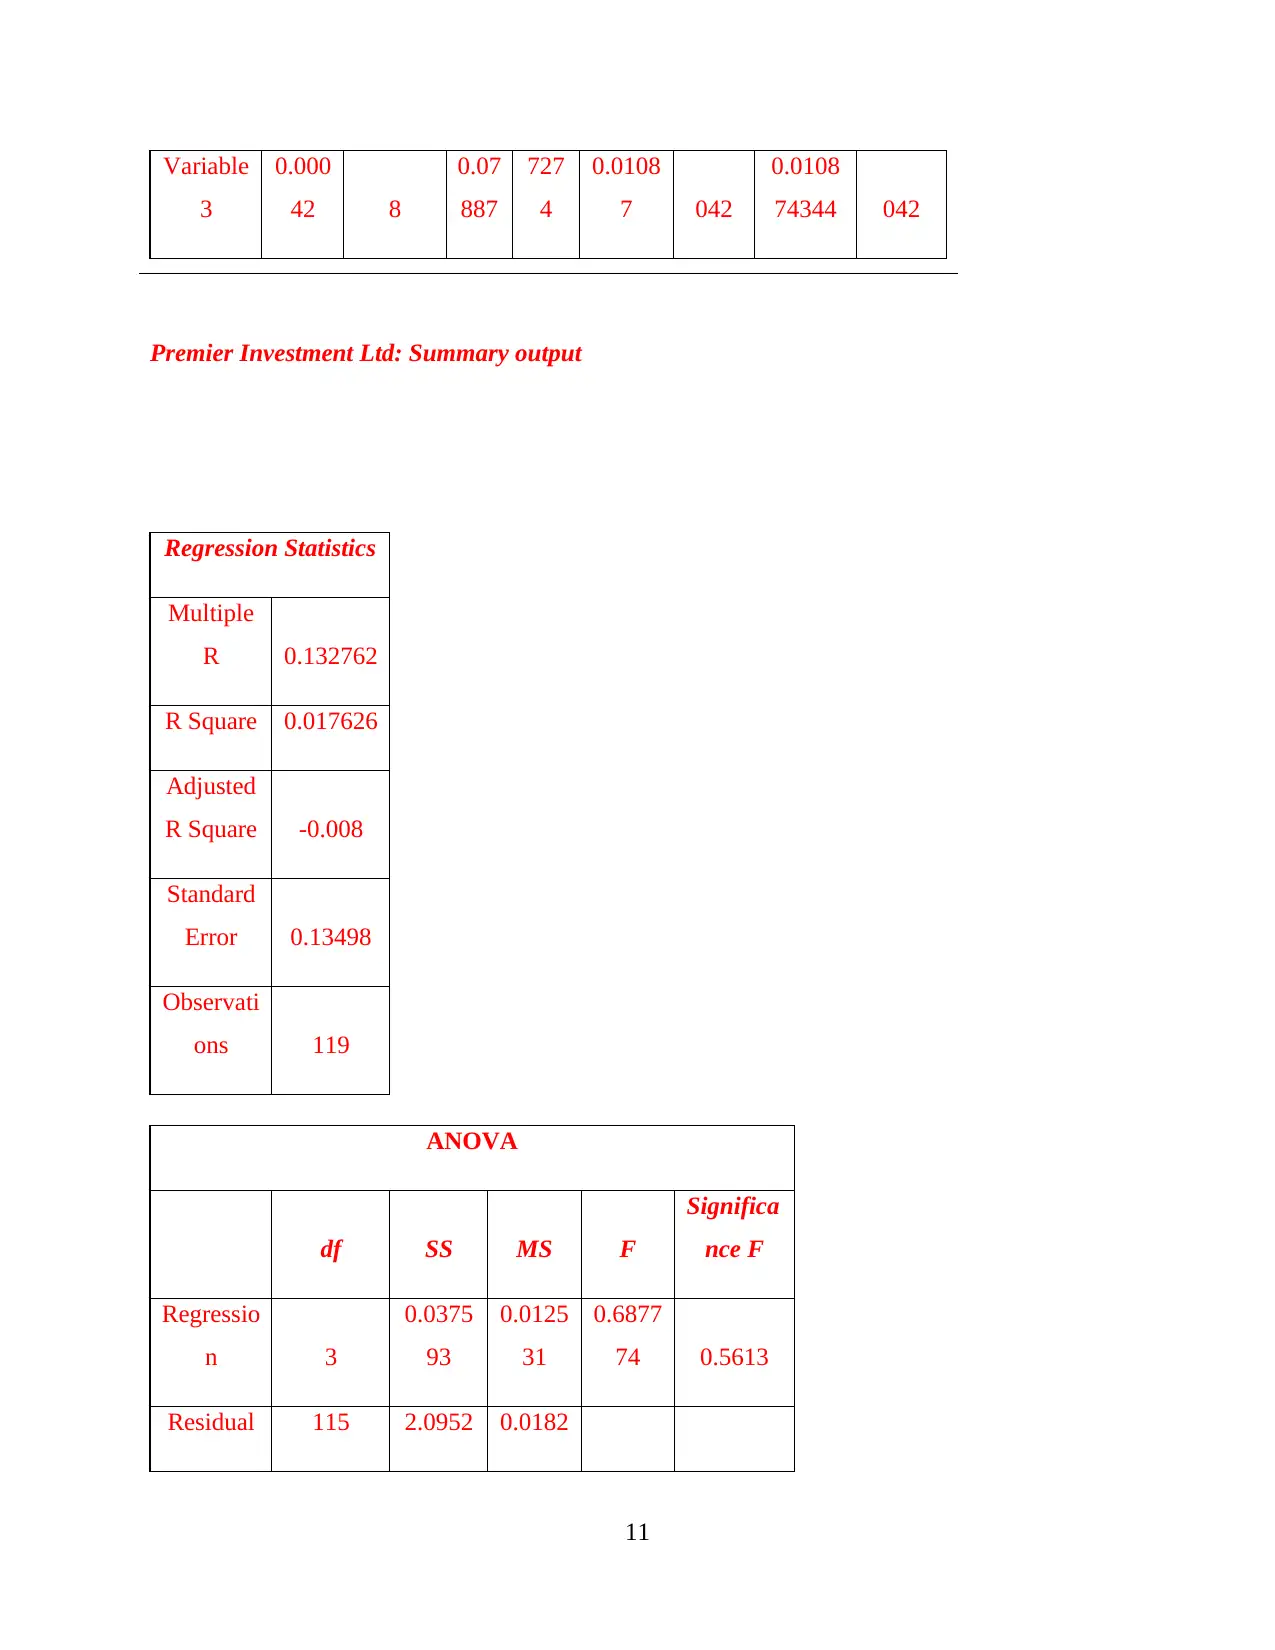
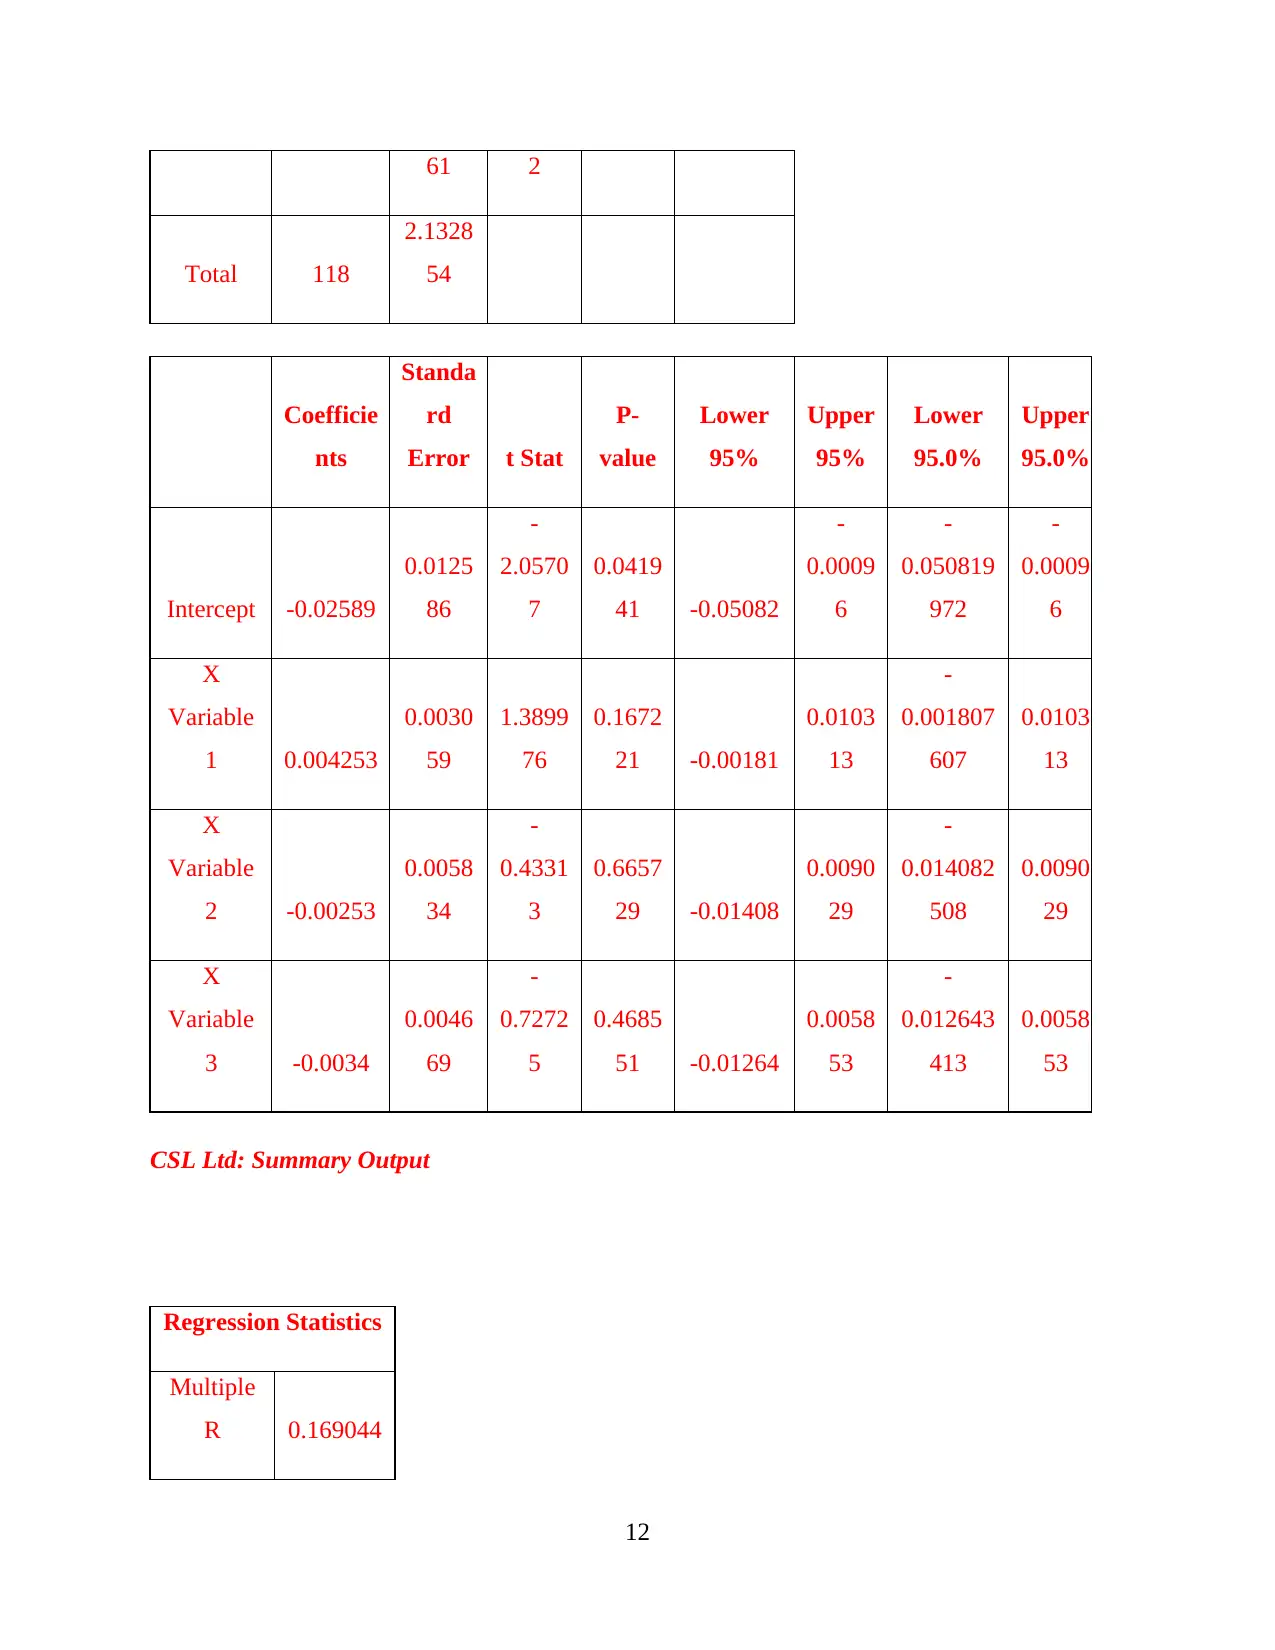
This project delves into the application of portfolio theory, encompassing portfolio construction, optimization, and empirical estimation techniques. The project begins with constructing a portfolio, calculating mean returns, standard deviations, and Sharpe ratios for individual assets, a market portfolio, and an equally weighted portfolio. It then presents a covariance matrix for the assets. The project proceeds to portfolio optimization, determining optimal weights for four selected assets using beta and market return data. Finally, it utilizes regression analysis to empirically estimate data using the market model and Fama-French three-factor model to compute beta values and assess risk. The evaluation section interprets the findings, highlighting the performance of different assets and the implications of portfolio optimization and regression results. The conclusion summarizes the key findings, emphasizing the importance of Vocus Group Ltd in maximizing returns and the significance of the capital market line.
Document Page
Application of Portfolio Theory and Empirical
Estimation
1
tabler-icon-diamond-filled.svg

Paraphrase This Document

Need a fresh take? Get an instant paraphrase of this document with our AI Paraphraser
Document Page
TABLE OF CONTENTS
INTRODUCTION...........................................................................................................................3
1. PORTFOLIO CONSTRUNCTION.............................................................................................3
1. Calculating mean return and standard deviation of each asset................................................3
2. Assessing mean return and standard deviation of market portfolio........................................3
3. Presenting co-variance matrix for individual asset, market and asset portfolio......................3
4. Determining mean return and standard deviation for equally weighted portfolio...................4
5. Computing Sharpe ratio for each asset, market and overall portfolio.....................................4
6. Constructing CML on market portfolio...................................................................................4
2. PORTFOLIO OPTIMIZATION..................................................................................................5
Determining the optimal weights for the four assets in your portfolio........................................5
3. EMPIRICAL ESTIMATION WITH REGRESSION.................................................................7
Estimation of data by using regression analysis technique.........................................................7
4. EVALUATION.........................................................................................................................12
CONCLUSION..............................................................................................................................13
REFERENCES..............................................................................................................................14
2
Document Page
INTRODUCTION
Portfolio theory entails the manner in which risk-averse investors can build a portfolio
that maximizes return in against to the given market risk. For the present report, four companies
have been selected such as Wesfarmers; Vocus group Ltd, Premier investment and CSL Ltd. In
this, report will develop understanding about the aspects of portfolio construction, optimization
and empirical estimation.
1. PORTFOLIO CONSTRUNCTION
1. Calculating mean return and standard deviation of each asset
Particulars Wesfarmers Ltd Vocus Group
Ltd
Premier
Investment Ltd
CSL Ltd
Mean return 0.8% 2.2% 1.4% 1.6%
Standard
deviation
6.46% 12.23% 8.94% 5.84%
2. Assessing mean return and standard deviation of market portfolio
Particulars Figures
Mean 3.3%
Standard deviation 0.05
3. Presenting co-variance matrix for individual asset, market and asset portfolio
Wesfarmer
s Vocus group
Premier
Group CSL
Market
(ASX)
Wesfarmers 0.42% -0.01% 0.21% 0.08% 0.16%
3
Document Page
Vocus Group -0.01% 1.50% 0.21% 0.03% 0.10%
Premier
Group 0.21% 0.21% 0.80%
-
0.01% 0.19%
CSL 0.08% 0.03% -0.01% 0.34% 0.10%
Market (ASX) 0.16% 0.10% 0.19% 0.10% 0.28%
4. Determining mean return and standard deviation for equally weighted portfolio
Portfolio
Mean Return 1.51%
Variance 0.22%
SD 4.72%
Sharpe Ratio 31.96%
5. Computing Sharpe ratio for each asset, market and overall portfolio
Particulars Sharpe ratio
Wesfarmers Ltd 100.06%
Vocus Group Ltd 15.62%
Premier Investment Ltd 11.97%
CSL Ltd 22.15%
Market portfolio (ASX
200)
-100.17%
Asset portfolio 31.96%
4
tabler-icon-diamond-filled.svg

Paraphrase This Document

Need a fresh take? Get an instant paraphrase of this document with our AI Paraphraser
Document Page
6. Constructing CML on market portfolio
Portfolio Expected return
Portfolio std.
deviation
0.37 0.089
0.31 0.061
0.28 0.048
0.30 0.05
0.26 0.048
0.24 0.26 0.28 0.3 0.32 0.34 0.36 0.38
0
0.01
0.02
0.03
0.04
0.05
0.06
0.07
0.08
0.09
0.1
Portfolio std. deviation
2. PORTFOLIO OPTIMIZATION
Determining the optimal weights for the four assets in your portfolio
Average market return
(Rm) 0.028%
Risk free rate (Rf) 0.01
Wesfarmers Ltd Vocus Group Ltd
Beta 0.91 0.56
Average Market return
(Monthly 0.8% 2.2%
Average Market return
(Annual) 9.19% 26.89%
5
Document Page
Wesfarmers
Ltd
Vocus Group
Ltd
Premier Investment
Ltd CSL Ltd
Weights 25% 25% 25% 25%
Portfolio mean return 1.51%
Variance .22%
Portfolio Std. deviation 4.72%
Sharpe ratio 31.96%
Wesfarmer
s Vocus group
Premier
Group CSL
Market
(ASX)
Wesfarmers 0.42% -0.01% 0.21% 0.08% 0.16%
Vocus Group -0.01% 1.50% 0.21% 0.03% 0.10%
Premier
Group 0.21% 0.21% 0.80%
-
0.01% 0.19%
CSL 0.08% 0.03% -0.01% 0.34% 0.10%
Market (ASX) 0.16% 0.10% 0.19% 0.10% 0.28%
Correlation
Wesfarmers
Ltd
Vocus
Group Ltd
Premier
Investment
CSL Ltd
6
Document Page
Ltd
Wesfarmers Ltd 1
-
0.016789326
0.35481178
7 0.224440818
Vocus Group Ltd 1
0.19255396
3 0.038177371
Premier Investment Ltd 1
-
0.015125975
CSL Ltd 1
Name of the
ompanies Weights
Monthly
return
annual
return
Weighte
d annual
returns
Wesfarmers LTD
return -0.55 0.8% 9.3% -5.2%
Vocus group Ltd 0.65 2.2% 26.9% 17.5%
Premier investment
ltd 0.42 1.4% 16.8% 7.1%
CSL LTD 0.48 1.6% 19.5% 9.4%
1.00
Portfolio
return 28.8%
Target
return 25%
3. EMPIRICAL ESTIMATION WITH REGRESSION
Estimation of data by using regression analysis technique
Step 1: Computation of beta through Market Model Regression technique (Slope)
Particulars Wesfarmers Ltd
Vocus
Group Ltd
Premier
Investment
Ltd CSL Ltd
Equally
weighted
portfolio
7
tabler-icon-diamond-filled.svg

Paraphrase This Document

Need a fresh take? Get an instant paraphrase of this document with our AI Paraphraser
Document Page
Beta 0.91 0.56 1.09 0.58 .79
Step 2: Regression using Fama French three factors model
Wesfarmers
Summary output
Regression
Statistics
Multipl
e R
0.15
8296
R
Square
0.02
5058
Adjust
ed R
Square
-
0.00
038
Standar
d Error
0.11
2762
Observ
ations 119
ANOVA
df SS MS F
Signifi
cance
F
Regres
sion 3
0.037
582
0.0
125
27
0.9
852
34
0.4023
91
Residu
al 115
1.462
249
0.0
127
15
Total 118
1.499
832
Coef
ficie
nts
Stand
ard
Error
t
Sta
t
P-
val
ue
Lower
95%
Upp
er
95%
Lower
95.0%
Uppe
r
95.0
%
Interce - 0.010 - 0.0 - - - -
8
Document Page
pt
0.03
198 514
3.0
416
7
029
15
0.0528
1
0.01
115
0.0528
06903
0.01
115
X
Variabl
e 1
0.00
3485
0.002
556
1.3
636
07
0.1
753
55
-
0.0015
8
0.00
854
8
-
0.0015
77459
0.00
8548
X
Variabl
e 2
0.00
2671
0.004
874
0.5
479
98
0.5
847
55
-
0.0069
8
0.01
232
4
-
0.0069
82861
0.01
2324
X
Variabl
e 3
-
0.00
238
0.003
9
-
0.6
099
3
0.5
431
15
-
0.0101
0.00
534
7
-
0.0101
04639
0.00
5347
Vocus Group Ltd: Summary output
Regression
Statistics
Multiple
R
0.284
363
R
Square
0.080
862
Adjuste
d R
Square
0.056
885
Standard
Error
0.152
64
Observa
tions 119
9
Document Page
ANOVA
df SS MS F
Signifi
cance
F
Regressi
on 3
0.2357
21
0.07
857
4
3.37
241
9
0.0209
26
Residual 115
2.6793
72
0.02
329
9
Total 118
2.9150
93
Coeff
icient
s
Standa
rd
Error
t
Stat
P-
val
ue
Lower
95%
Uppe
r
95%
Lower
95.0%
Uppe
r
95.0
%
Intercept
-
0.020
44
0.0142
32
-
1.43
641
0.15
360
1
-
0.0486
4
0.007
748
-
0.0486
35231
0.007
748
X
Variable
1
0.009
844
0.0034
6
2.84
526
4
0.00
525
5
0.0029
91
0.016
697
0.0029
90757
0.016
697
X
Variable
2
0.000
475
0.0065
97
0.07
198
8
0.94
273
6
-
0.0125
9
0.013
542
-
0.0125
92606
0.013
542
X - 0.0052 - 0.93 - 0.010 - 0.010
10
tabler-icon-diamond-filled.svg

Paraphrase This Document

Need a fresh take? Get an instant paraphrase of this document with our AI Paraphraser
Document Page
Variable
3
0.000
42 8
0.07
887
727
4
0.0108
7 042
0.0108
74344 042
Premier Investment Ltd: Summary output
Regression Statistics
Multiple
R 0.132762
R Square 0.017626
Adjusted
R Square -0.008
Standard
Error 0.13498
Observati
ons 119
ANOVA
df SS MS F
Significa
nce F
Regressio
n 3
0.0375
93
0.0125
31
0.6877
74 0.5613
Residual 115 2.0952 0.0182
11
Document Page
61 2
Total 118
2.1328
54
Coefficie
nts
Standa
rd
Error t Stat
P-
value
Lower
95%
Upper
95%
Lower
95.0%
Upper
95.0%
Intercept -0.02589
0.0125
86
-
2.0570
7
0.0419
41 -0.05082
-
0.0009
6
-
0.050819
972
-
0.0009
6
X
Variable
1 0.004253
0.0030
59
1.3899
76
0.1672
21 -0.00181
0.0103
13
-
0.001807
607
0.0103
13
X
Variable
2 -0.00253
0.0058
34
-
0.4331
3
0.6657
29 -0.01408
0.0090
29
-
0.014082
508
0.0090
29
X
Variable
3 -0.0034
0.0046
69
-
0.7272
5
0.4685
51 -0.01264
0.0058
53
-
0.012643
413
0.0058
53
CSL Ltd: Summary Output
Regression Statistics
Multiple
R 0.169044
12
chevron_up_icon
1 out of 16
circle_padding
hide_on_mobile
zoom_out_icon
[object Object]