BUS 550 Portfolio and Investment Analysis: Westcliff University
VerifiedAdded on 2021/03/08
|29
|7876
|123
Project
AI Summary
This project, completed for BUS 550 at Westcliff University, analyzes a portfolio consisting of Netflix, Apple, Coca-Cola, Walmart, and Toyota Motors. The assignment explores portfolio management, risk assessment, and return evaluation across various sectors. The student calculated returns, variance, and standard deviation for each stock, emphasizing Toyota for its lower default risk and Netflix for its higher potential returns. The analysis includes market capitalization graphs and considers different investment weights to optimize portfolio performance, assuming a 10% loss scenario with a 99% guarantee. The project highlights the importance of diversification and strategic stock selection to minimize risk and maximize profitability within a financial portfolio. The document provides a comprehensive overview of the financial management principles applied in constructing and evaluating an investment portfolio.
Analysis of Portfolio and Investment
Nikita Karki
Westcliff University
BUS 550 Financial Management
Dr. Kambiz Moghaddam/ Madhu Pokharel
December 21, 2020
1
Nikita Karki
Westcliff University
BUS 550 Financial Management
Dr. Kambiz Moghaddam/ Madhu Pokharel
December 21, 2020
1
Paraphrase This Document
Need a fresh take? Get an instant paraphrase of this document with our AI Paraphraser
Abstract
In CLA2, it includes a realistic understanding about what portfolio management entails
and how can an investor evaluates return and risk and make investments appropriately in
inventories. I selected Netflix, Walmart, Apple, Toyota Motors and Coca cola because we
are required to expand our stock, because they existed in various industries. We measured their
yields, variance, deviation and focused on investing factors as I selected Toyota for the most
investment because it had the lowest default and Netflix the lowest, given the highest default.
The Portfolio evaluation was also carried out on the basis of return, standard deviation and
variance calculated by assuming 10 percent loss and 99 percent guarantee with promising
outcomes, with market capitalization graphs that reflect the options also calculated for different
weights.
Keywords: portfolio, standard deviation, mean, rate, return
2
Analysis of Portfolio and Investment
The portfolio can be described as the distribution and identification of all capital assets,
such as market stocks, bonds and personal investment to determine benefit in accordance with
other securities and also the macro environment. Portfolio management includes 3 essential parts
for balance of transition and preserving profitability: determining, prioritizing and managing
stocks (Martinsu & Lehtonen, 2007). Portfolio management's main purpose is to reduce risk and
generate the returns that every investor desires and can be accomplished by making an
investment in related bonds and secure investment. Since the key strategy to remain secure,
many investors make investments in different sectors whether any of the sector tends to
breakdown.
Netflix (NFLX), Apple (AAP), Coca-Cola (COKE), Walmart (WMT) and Toyota
Motors (TM) are 5 sectors that I have selected for my assignment, because Netflix has an online
entertainment platform, Apple is technical industry, Coca-Cola is a beverage industry, Walmart
is a retail industry and Toyota is an automotive industry. I am searching for 5 different stocks.
The entry requirements for the respective inventories are below;
Netflix (NFLX) is an online entertainment and streaming application and website that
operates on the basis of the subscriptions; originally it was only intended for streaming certain
movies, but because of its variation, the generation was simple to use and to charge for usage, the
generation binged on Netflix.
More than 95 percent of the total population knows coke and its product line, Coca- cola
(COKE) is among the products most valued in the market for their business because of their
specific value for the company as it has been on the market for decades. In one of the interviews
he spent in coke, as being the top owners of the portfolio, Warren Buffet said that since he had
3
⊘ This is a preview!⊘
Do you want full access?
Subscribe today to unlock all pages.
Trusted by 1+ million students worldwide
become a coke beverage and collector, he became personally attached to the business (Gardner,
McGowan Jr, & Moeller, 2010). The brand loyalty yet gained great value from him as coca cola
has took over the industry over many years. So, stability and development is all I need in my
portfolio, to boost productivity and make sustainable benefit. I have selected Coca-Cola as the
leading brand in the industry in the past few decades.
Toyota Motors (TM), is known as the world's best auto manufacturer company with
headquarters in Japan, has been in stock and has been very successful in past few decades for
performance. This is because someone in the production team will interrupt the production
process if they do not think the car is better enough, and it has maintained a car industry that is
acceptable to the public. I selected Toyota in my portfolio for diversifying, and I wanted an
automotive sector that would have strong returns and reducing the severity, which could allow
my portfolio will become less volatile and competitive. Based at the historical values, the table
below shows Toyota's exponential change in the market. In addition to all requirements for
selecting the stocks of Netflix, Apple, Coca Cola, Walmart and Toyota motors are discussed in
the context for diversifying the portfolios, personal opinions and positive earnings.
Apple Inc. is the company that designs, produces and distributes smartphones, laptops,
wearable tech and accessories. The company also provides multiple services. Apple, Air
Pods, Home Pod, Beats iPod touch, and Apple licensed, third-party devices are offered by the
Company as iPhone, a phone section; Mac, an individual device line; iPad; many wearable tech,
computer and accessories. The company offers services for AppleCare, Cloud Store, and
operates different App Stores to enable customers to access and install apps and entertainment
platforms like games, books, podcasts and music. The Apple Inc. also distributes its products via
4
Paraphrase This Document
Need a fresh take? Get an instant paraphrase of this document with our AI Paraphraser
online and retail shops and sells directly, and third-party cellular network carriers, suppliers,
retailers and vendors (Roon, Nijman, & Werker, 2003).
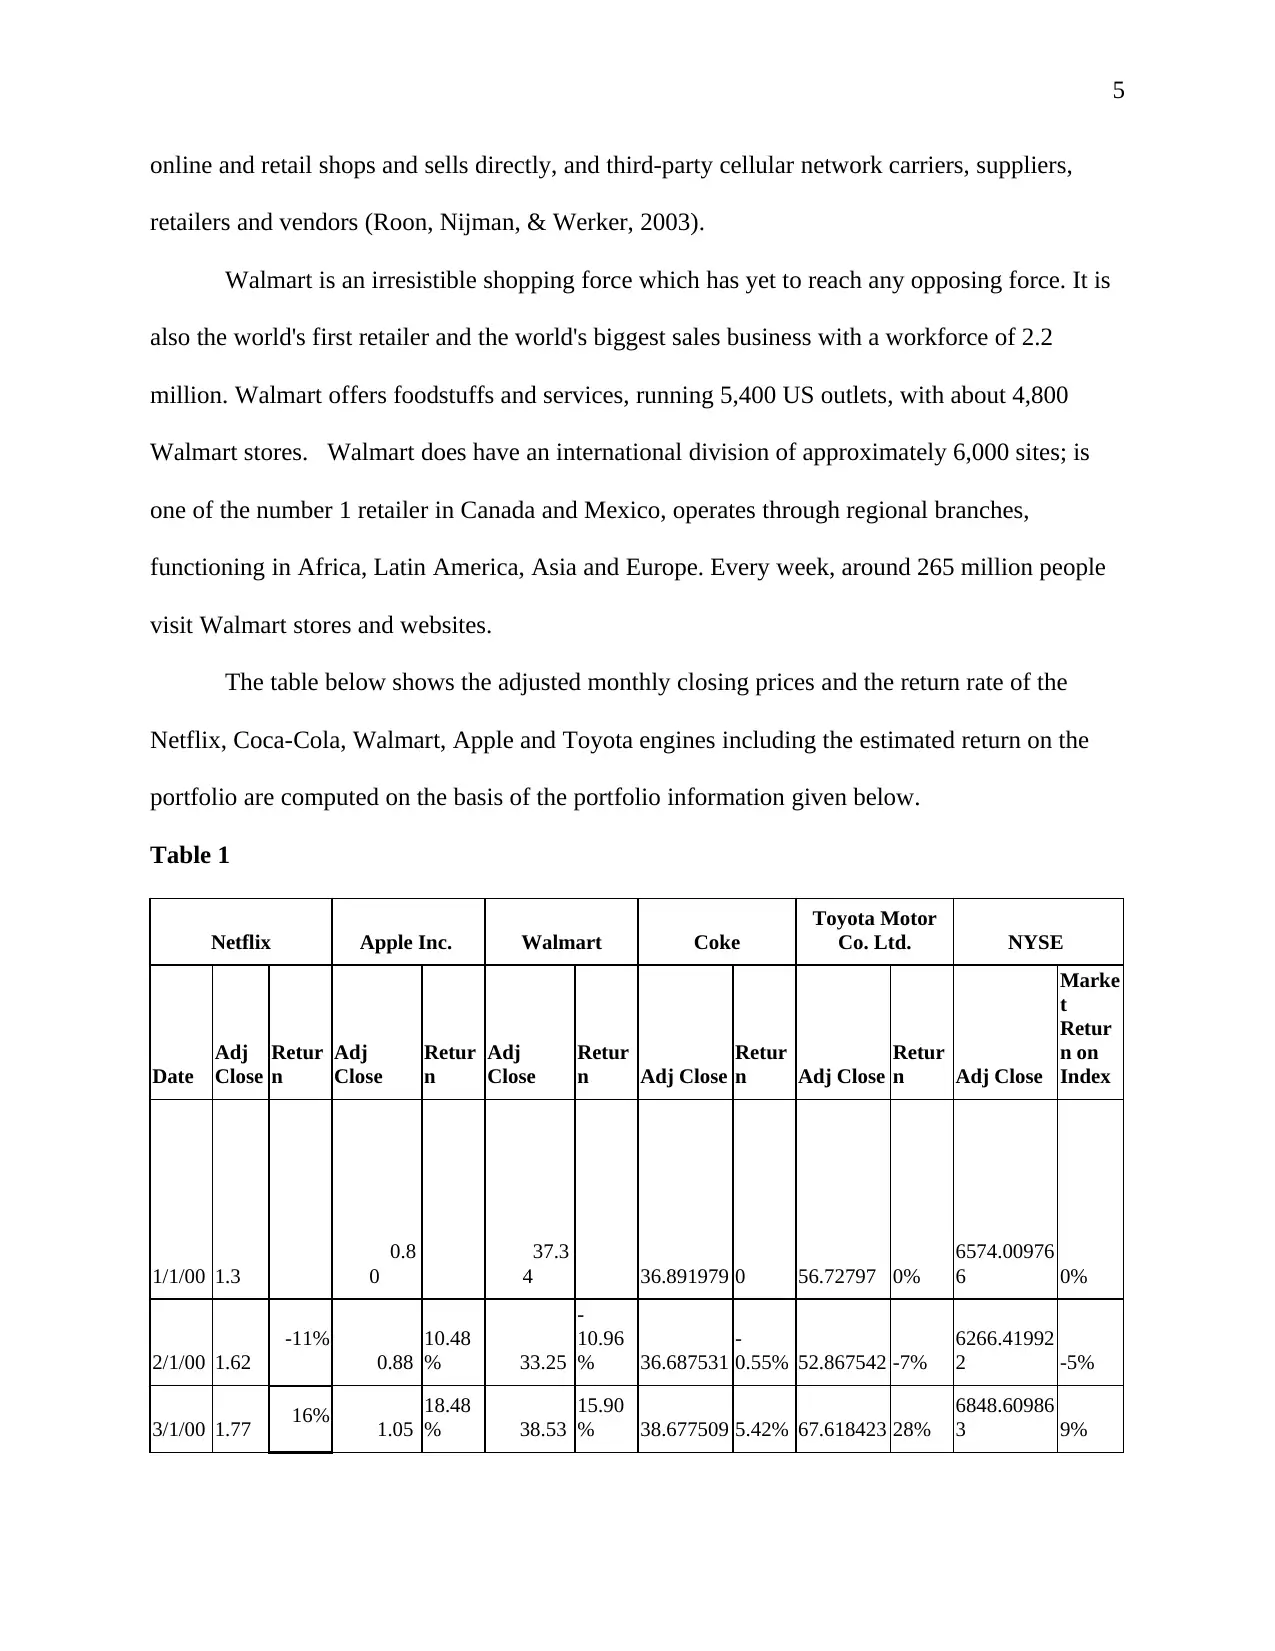
Walmart is an irresistible shopping force which has yet to reach any opposing force. It is
also the world's first retailer and the world's biggest sales business with a workforce of 2.2
million. Walmart offers foodstuffs and services, running 5,400 US outlets, with about 4,800
Walmart stores. Walmart does have an international division of approximately 6,000 sites; is
one of the number 1 retailer in Canada and Mexico, operates through regional branches,
functioning in Africa, Latin America, Asia and Europe. Every week, around 265 million people
visit Walmart stores and websites.
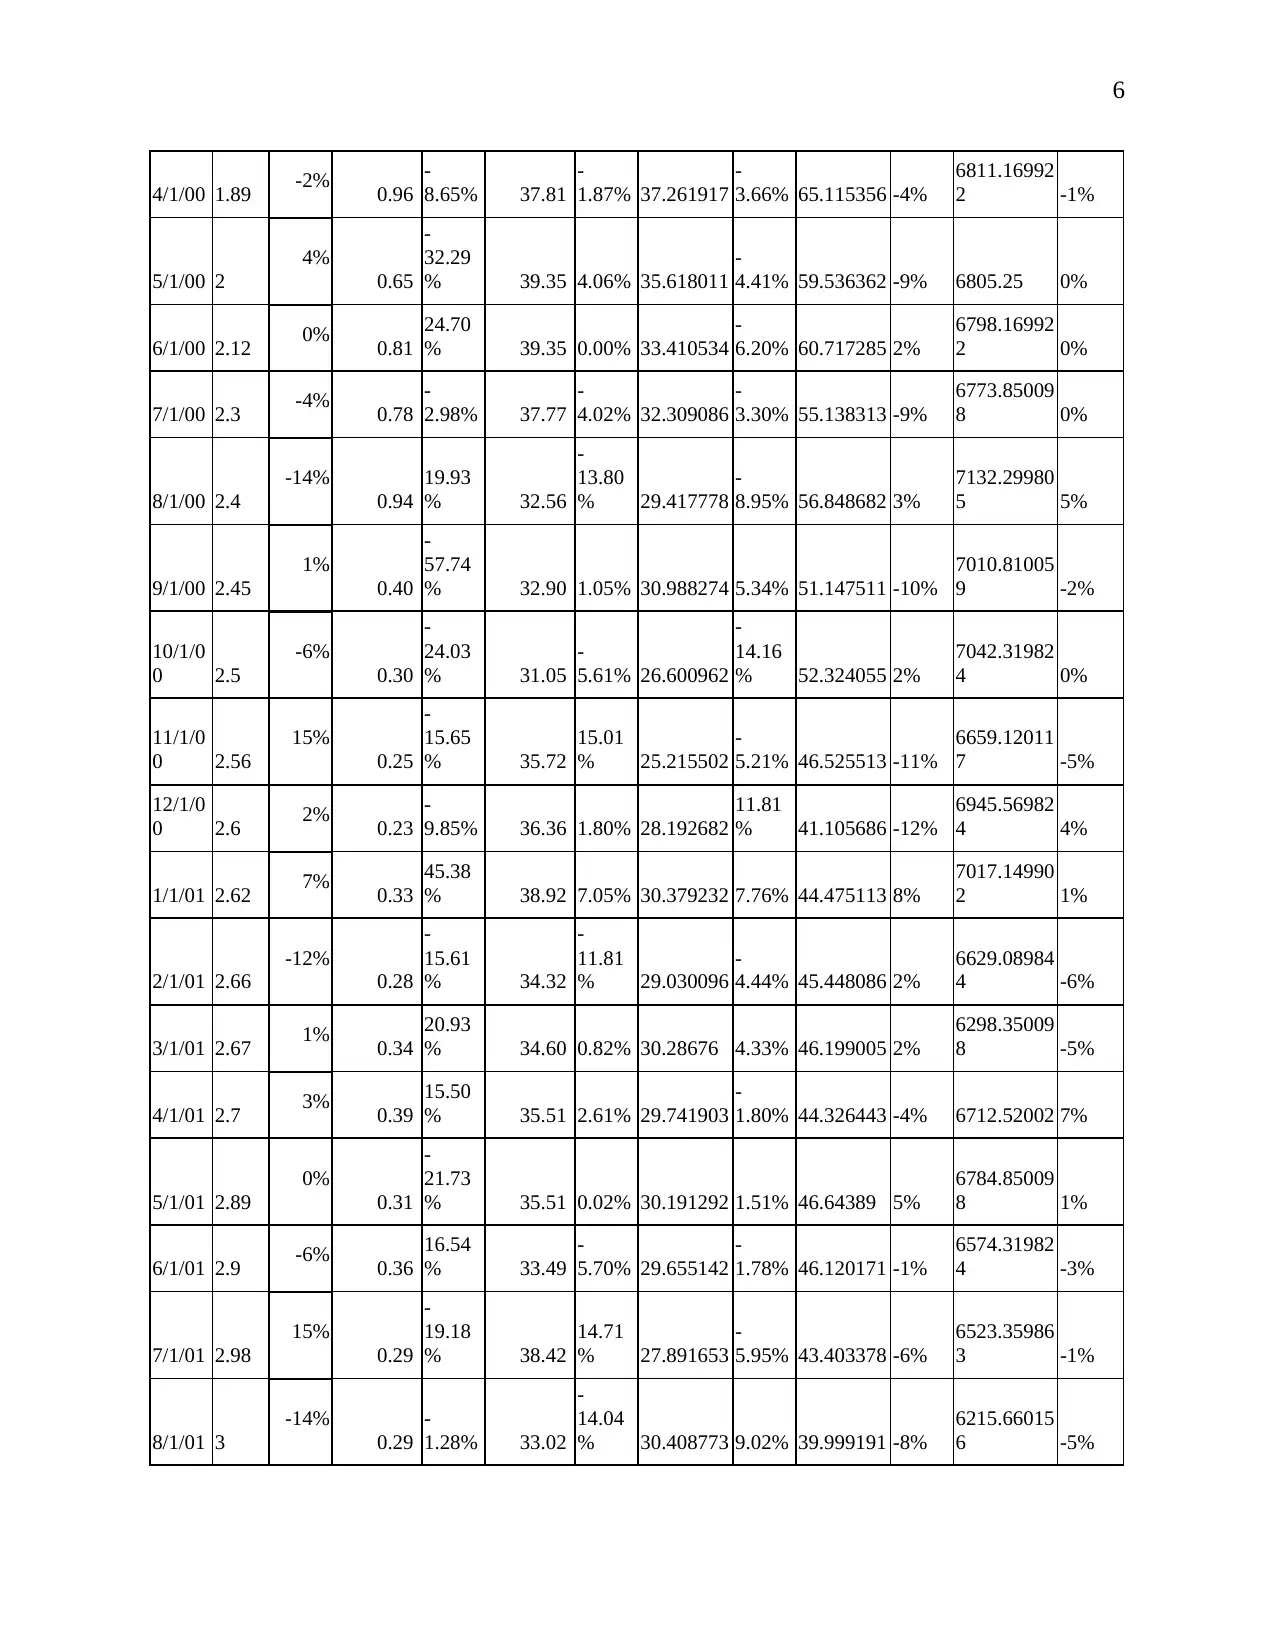
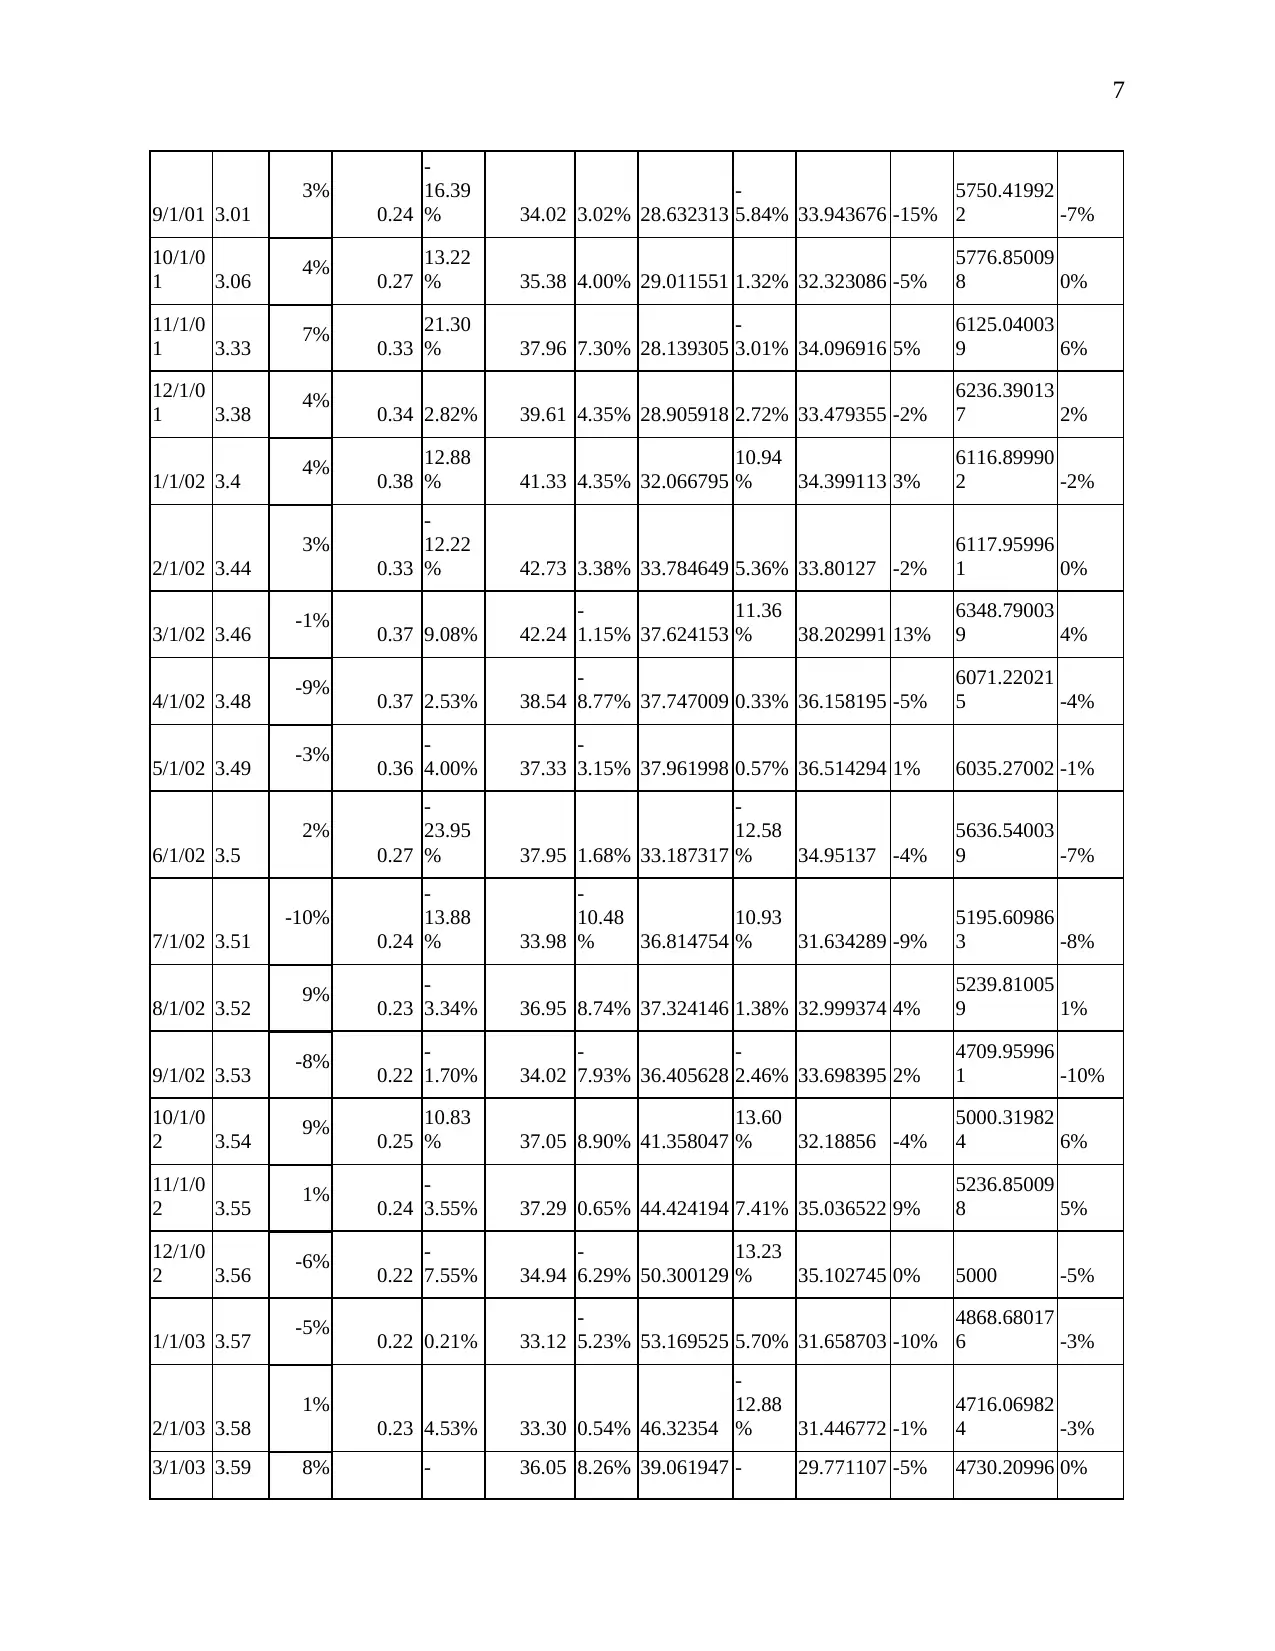
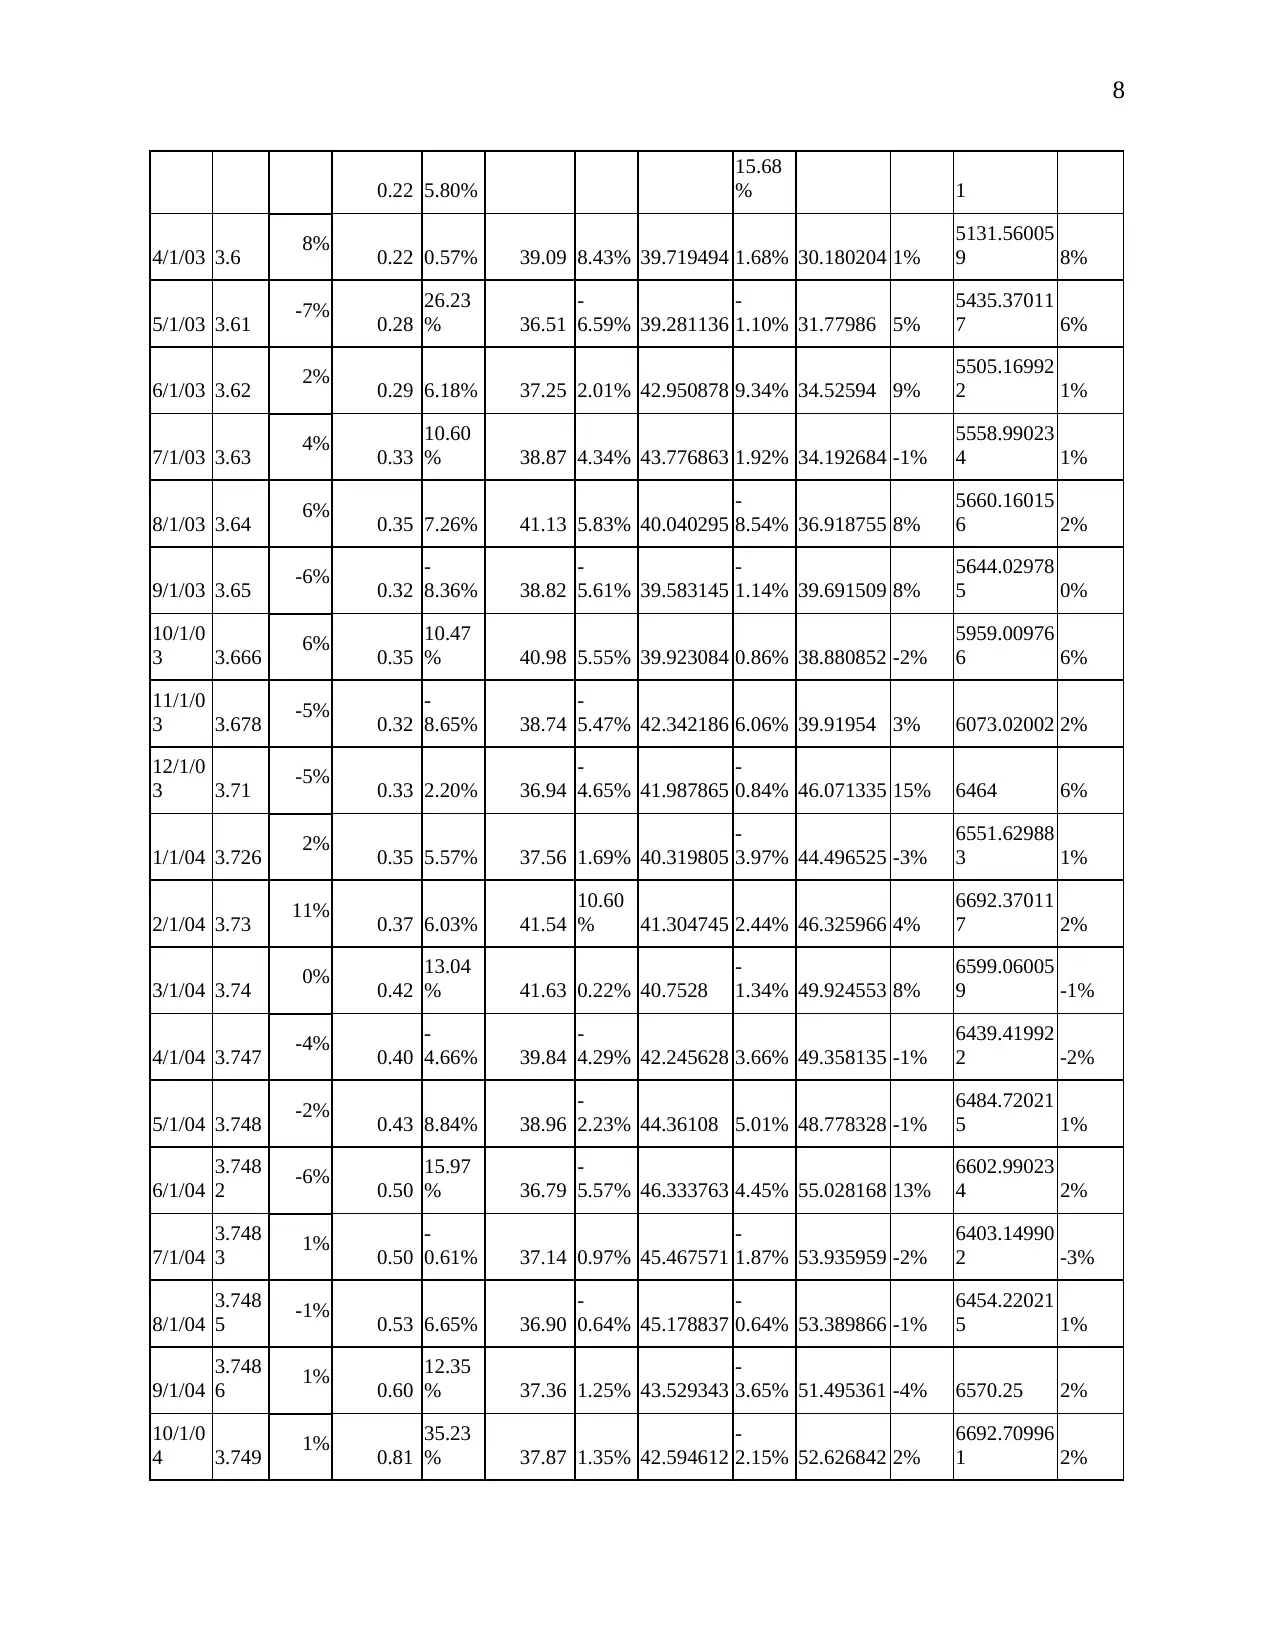
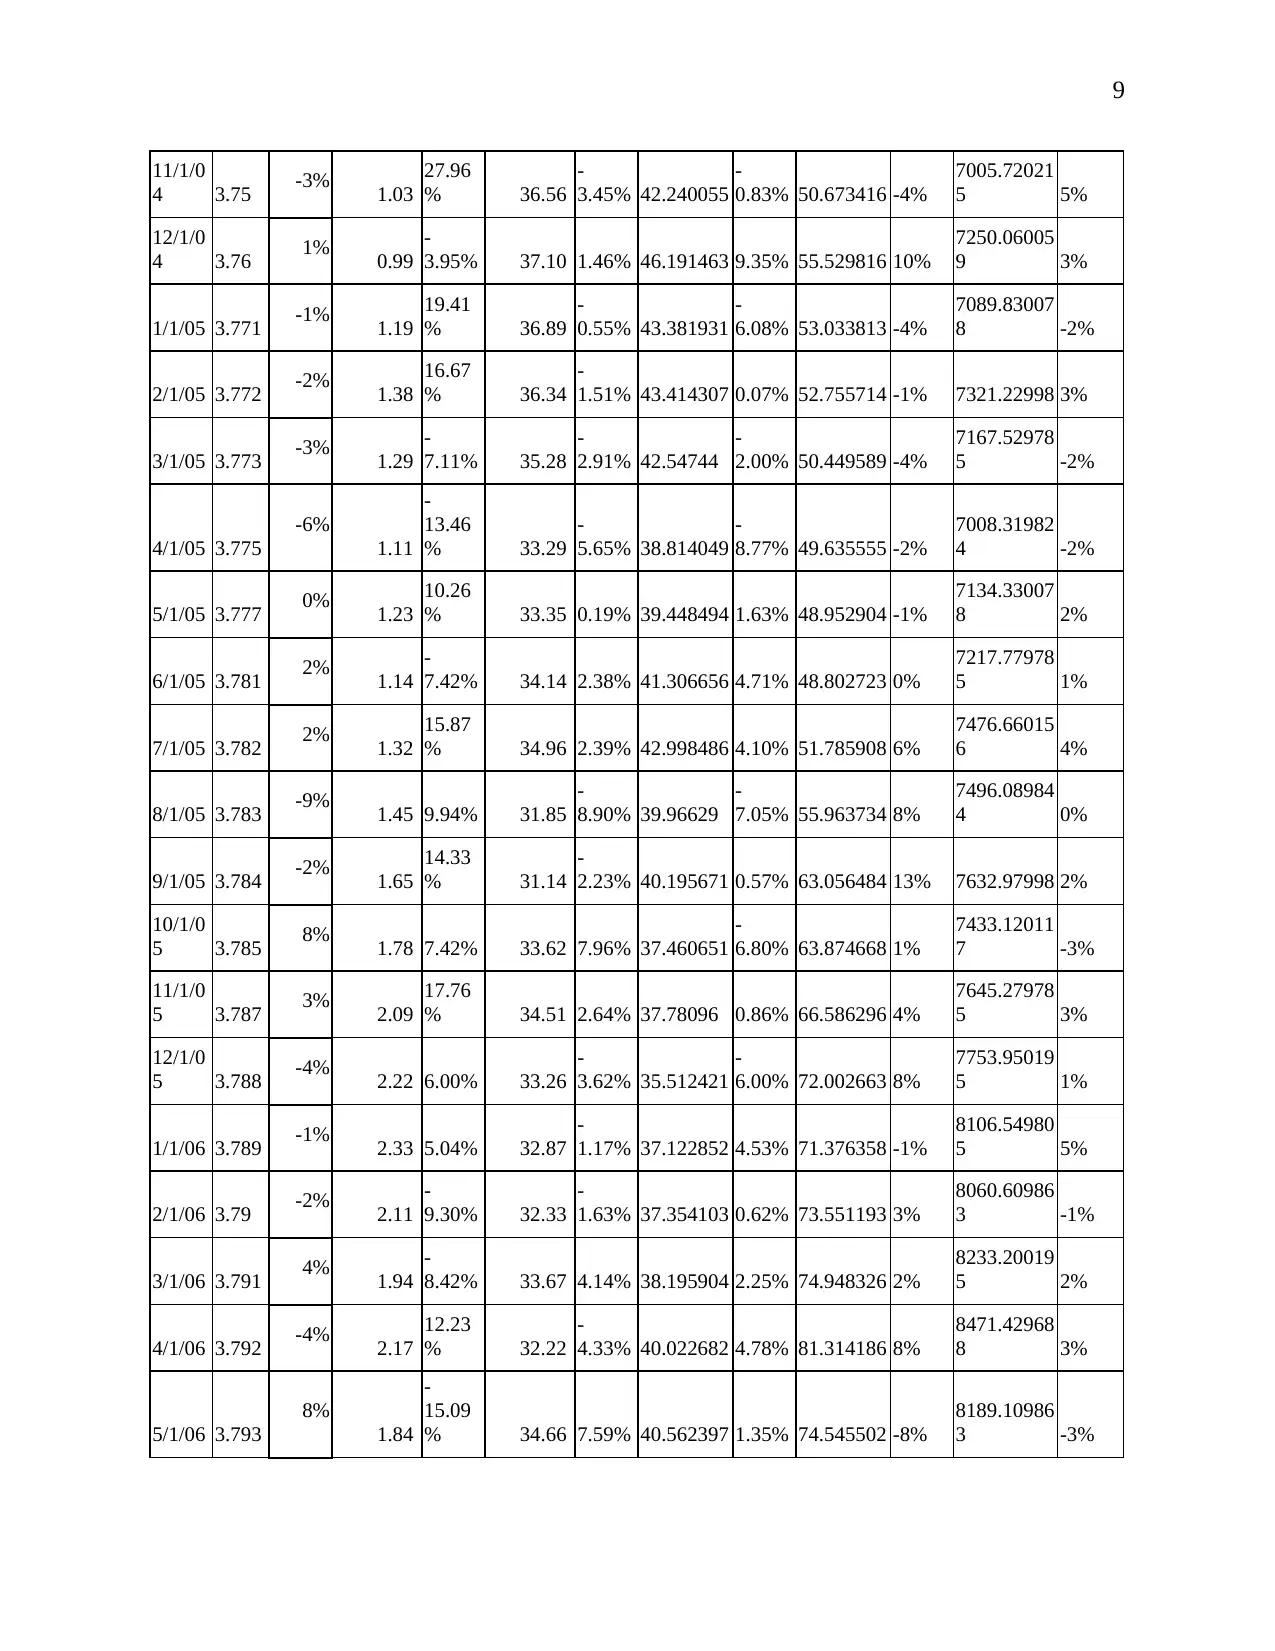
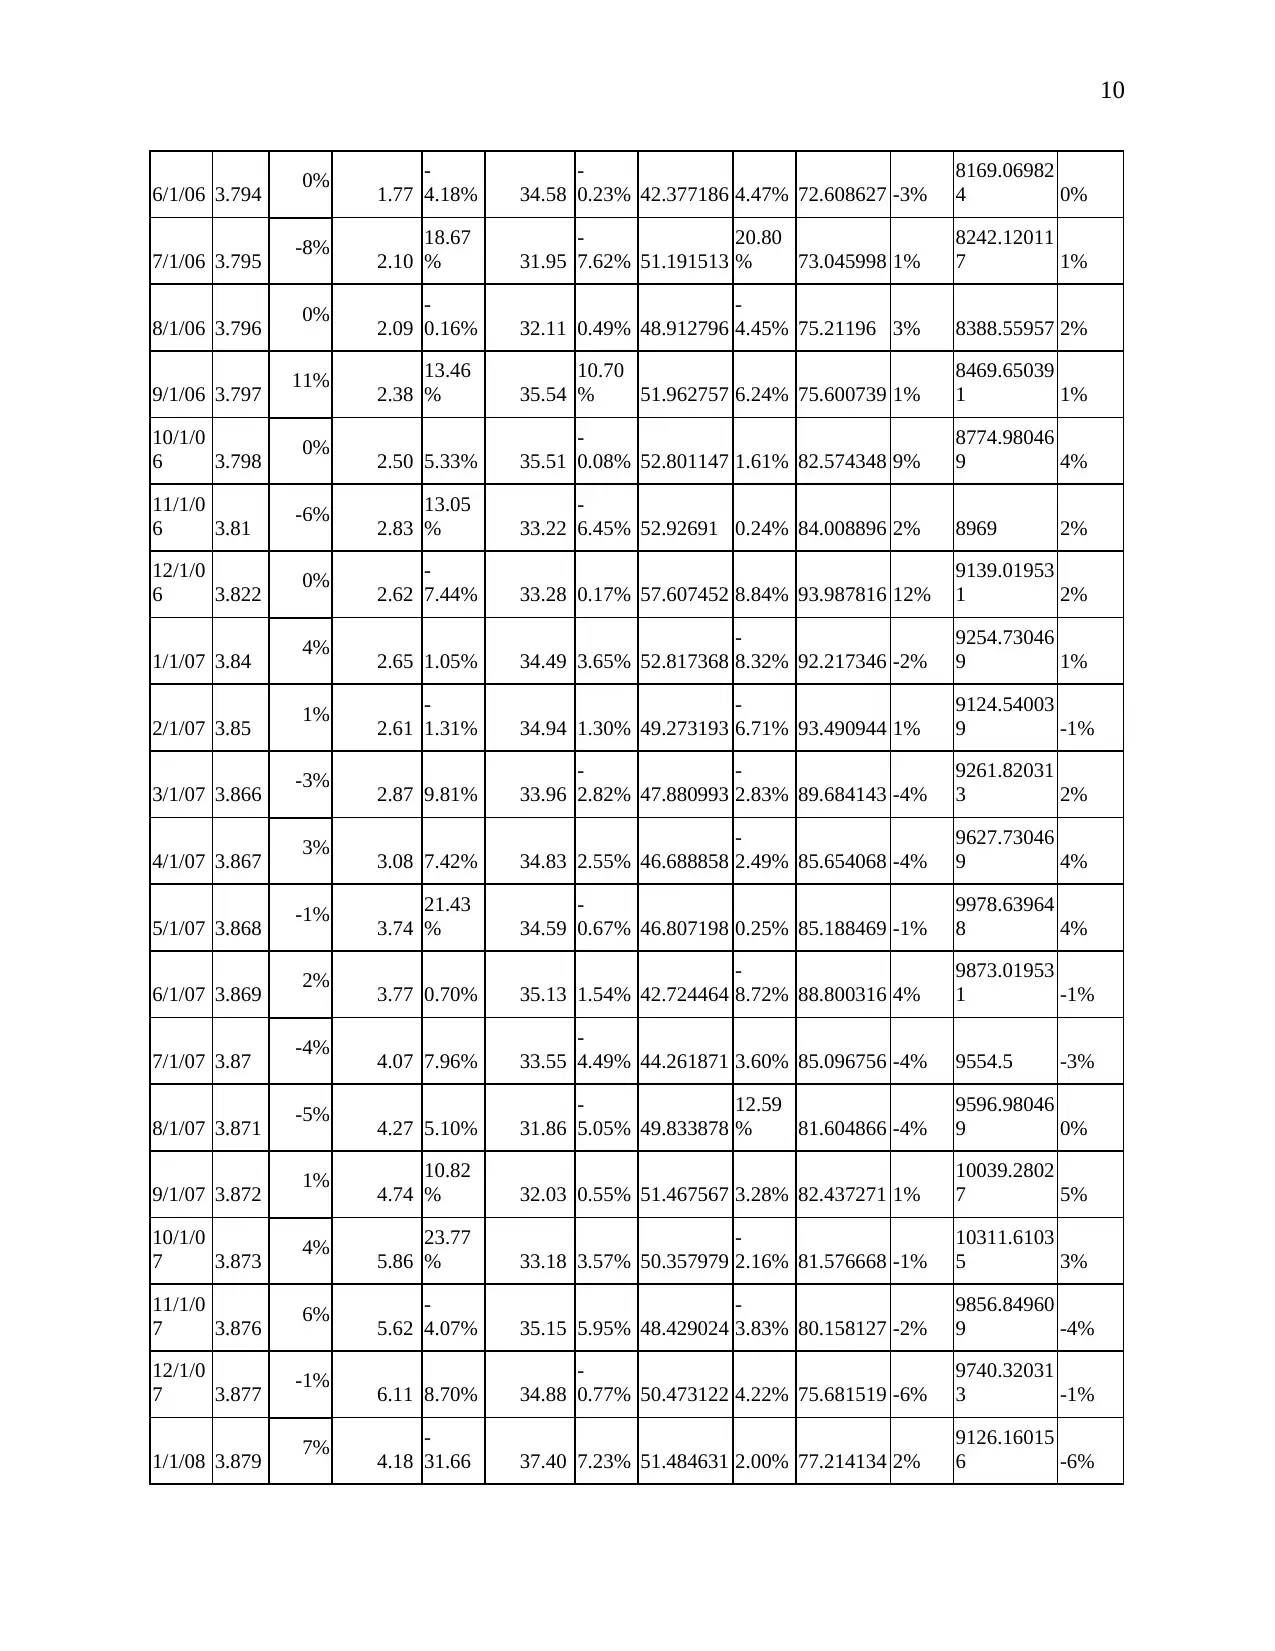
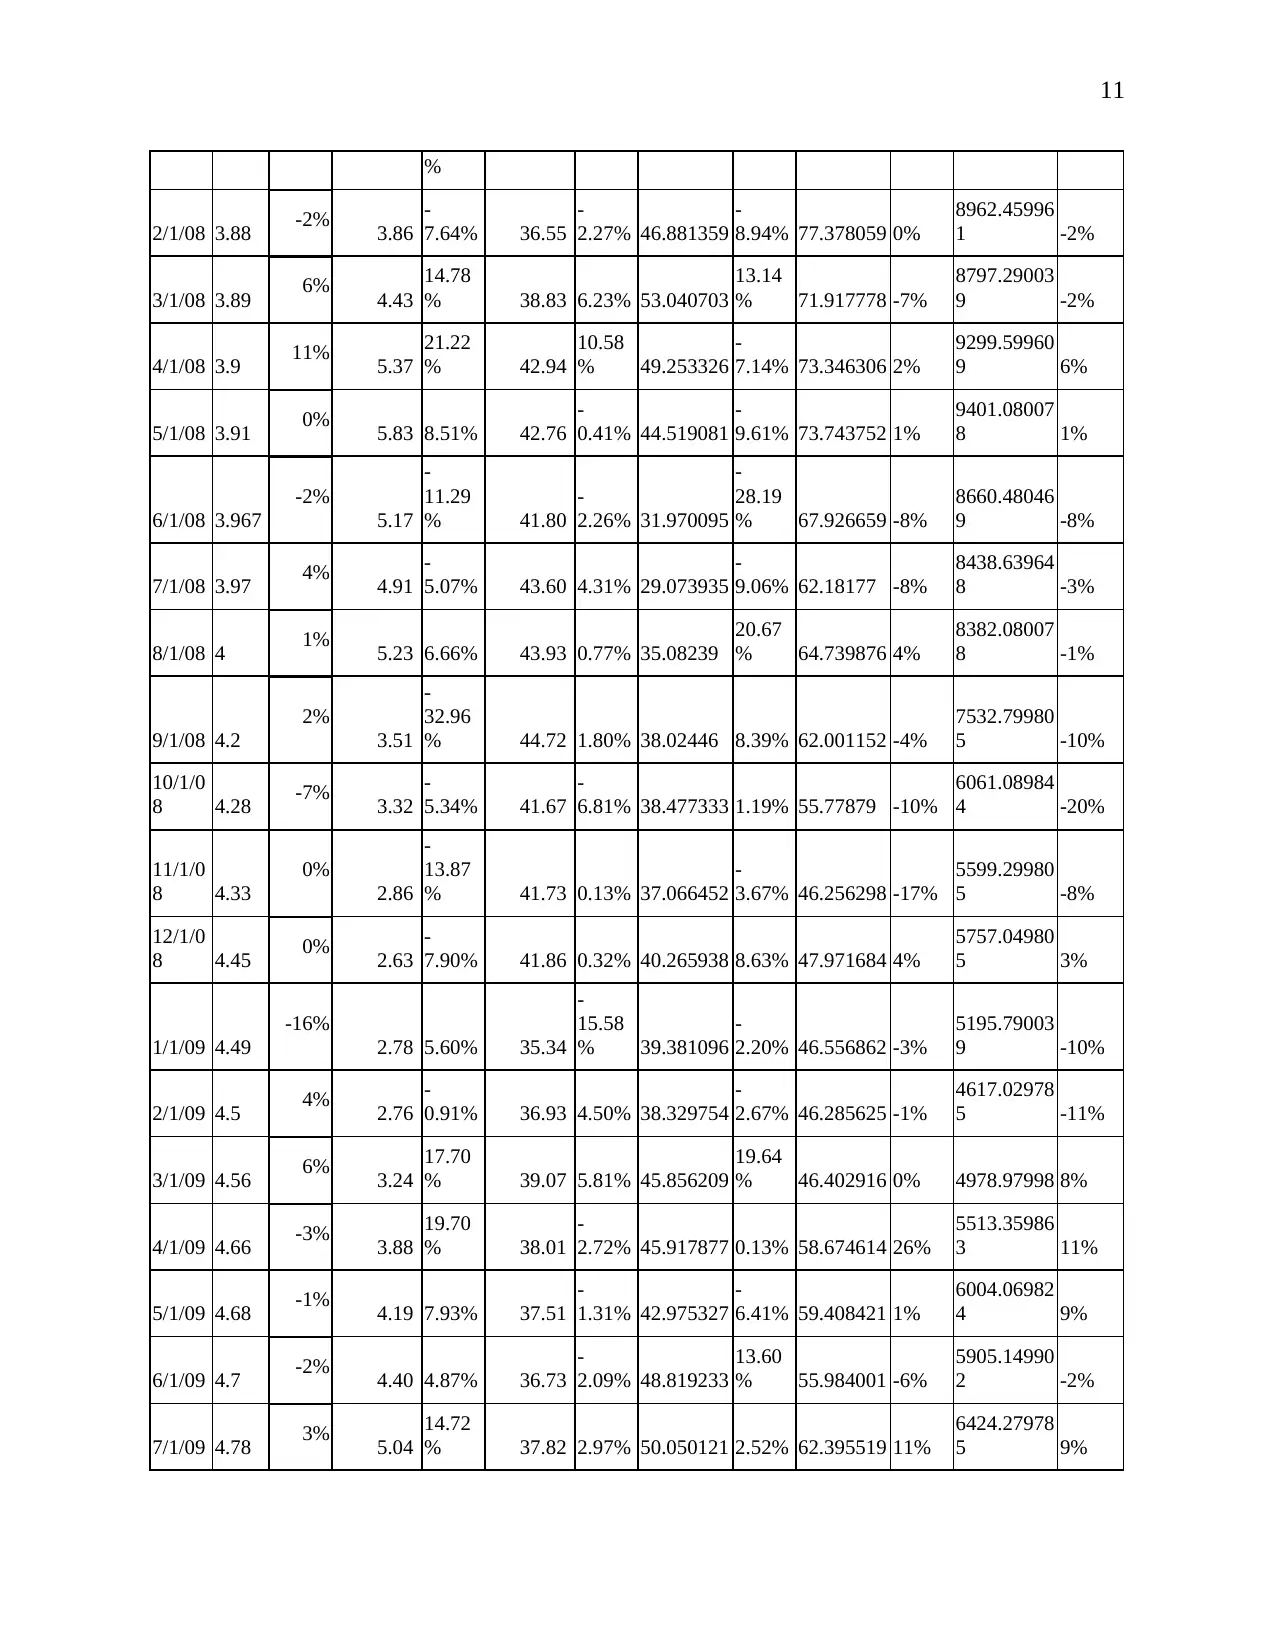
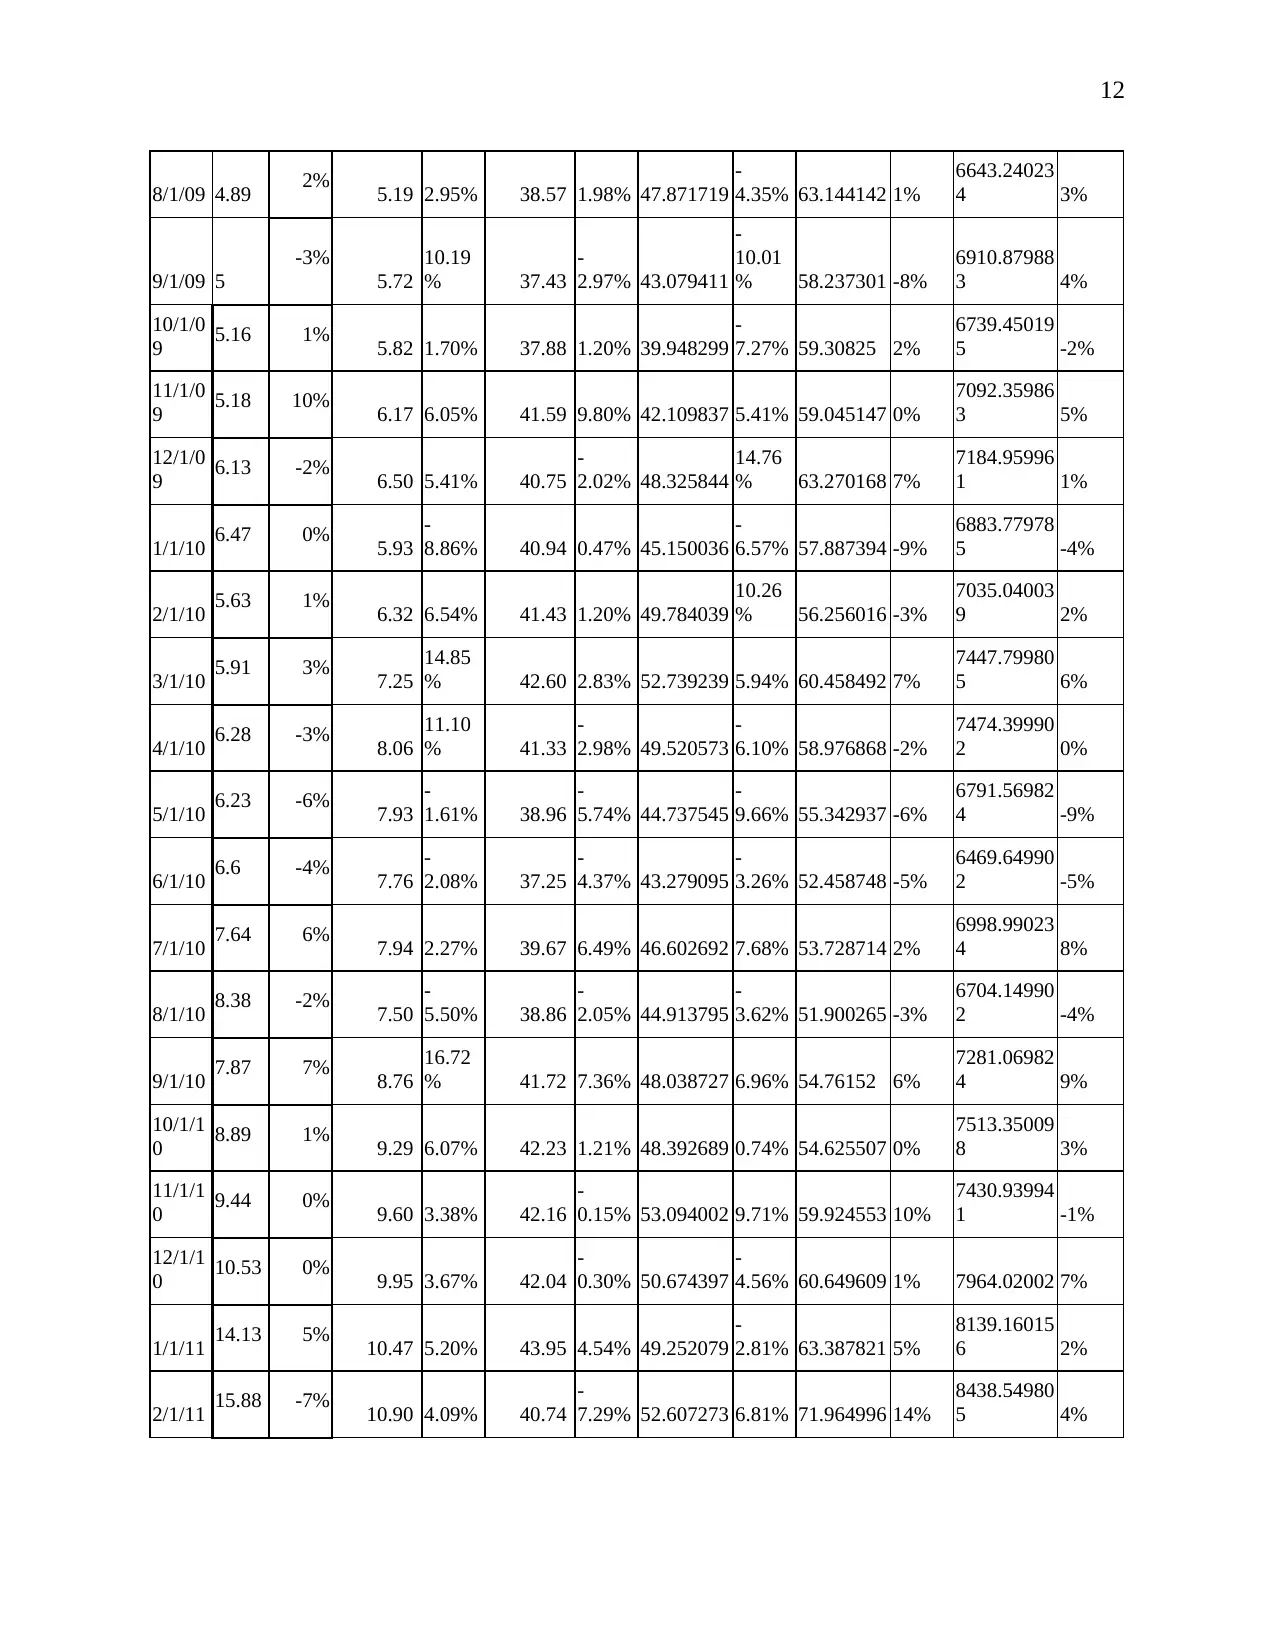
The table below shows the adjusted monthly closing prices and the return rate of the
Netflix, Coca-Cola, Walmart, Apple and Toyota engines including the estimated return on the
portfolio are computed on the basis of the portfolio information given below.
Table 1
Netflix Apple Inc. Walmart Coke
Toyota Motor
Co. Ltd. NYSE
Date
Adj
Close
Retur
n
Adj
Close
Retur
n
Adj
Close
Retur
n Adj Close
Retur
n Adj Close
Retur
n Adj Close
Marke
t
Retur
n on
Index
1/1/00 1.3
0.8
0
37.3
4 36.891979 0 56.72797 0%
6574.00976
6 0%
2/1/00 1.62
-11%
0.88
10.48
% 33.25
-
10.96
% 36.687531
-
0.55% 52.867542 -7%
6266.41992
2 -5%
3/1/00 1.77 16% 1.05
18.48
% 38.53
15.90
% 38.677509 5.42% 67.618423 28%
6848.60986
3 9%
5
retailers and vendors (Roon, Nijman, & Werker, 2003).
Walmart is an irresistible shopping force which has yet to reach any opposing force. It is
also the world's first retailer and the world's biggest sales business with a workforce of 2.2
million. Walmart offers foodstuffs and services, running 5,400 US outlets, with about 4,800
Walmart stores. Walmart does have an international division of approximately 6,000 sites; is
one of the number 1 retailer in Canada and Mexico, operates through regional branches,
functioning in Africa, Latin America, Asia and Europe. Every week, around 265 million people
visit Walmart stores and websites.
The table below shows the adjusted monthly closing prices and the return rate of the
Netflix, Coca-Cola, Walmart, Apple and Toyota engines including the estimated return on the
portfolio are computed on the basis of the portfolio information given below.
Table 1
Netflix Apple Inc. Walmart Coke
Toyota Motor
Co. Ltd. NYSE
Date
Adj
Close
Retur
n
Adj
Close
Retur
n
Adj
Close
Retur
n Adj Close
Retur
n Adj Close
Retur
n Adj Close
Marke
t
Retur
n on
Index
1/1/00 1.3
0.8
0
37.3
4 36.891979 0 56.72797 0%
6574.00976
6 0%
2/1/00 1.62
-11%
0.88
10.48
% 33.25
-
10.96
% 36.687531
-
0.55% 52.867542 -7%
6266.41992
2 -5%
3/1/00 1.77 16% 1.05
18.48
% 38.53
15.90
% 38.677509 5.42% 67.618423 28%
6848.60986
3 9%
5
4/1/00 1.89 -2% 0.96
-
8.65% 37.81
-
1.87% 37.261917
-
3.66% 65.115356 -4%
6811.16992
2 -1%
5/1/00 2
4%
0.65
-
32.29
% 39.35 4.06% 35.618011
-
4.41% 59.536362 -9% 6805.25 0%
6/1/00 2.12 0% 0.81
24.70
% 39.35 0.00% 33.410534
-
6.20% 60.717285 2%
6798.16992
2 0%
7/1/00 2.3 -4% 0.78
-
2.98% 37.77
-
4.02% 32.309086
-
3.30% 55.138313 -9%
6773.85009
8 0%
8/1/00 2.4
-14%
0.94
19.93
% 32.56
-
13.80
% 29.417778
-
8.95% 56.848682 3%
7132.29980
5 5%
9/1/00 2.45
1%
0.40
-
57.74
% 32.90 1.05% 30.988274 5.34% 51.147511 -10%
7010.81005
9 -2%
10/1/0
0 2.5
-6%
0.30
-
24.03
% 31.05
-
5.61% 26.600962
-
14.16
% 52.324055 2%
7042.31982
4 0%
11/1/0
0 2.56
15%
0.25
-
15.65
% 35.72
15.01
% 25.215502
-
5.21% 46.525513 -11%
6659.12011
7 -5%
12/1/0
0 2.6 2% 0.23
-
9.85% 36.36 1.80% 28.192682
11.81
% 41.105686 -12%
6945.56982
4 4%
1/1/01 2.62 7% 0.33
45.38
% 38.92 7.05% 30.379232 7.76% 44.475113 8%
7017.14990
2 1%
2/1/01 2.66
-12%
0.28
-
15.61
% 34.32
-
11.81
% 29.030096
-
4.44% 45.448086 2%
6629.08984
4 -6%
3/1/01 2.67 1% 0.34
20.93
% 34.60 0.82% 30.28676 4.33% 46.199005 2%
6298.35009
8 -5%
4/1/01 2.7 3% 0.39
15.50
% 35.51 2.61% 29.741903
-
1.80% 44.326443 -4% 6712.52002 7%
5/1/01 2.89
0%
0.31
-
21.73
% 35.51 0.02% 30.191292 1.51% 46.64389 5%
6784.85009
8 1%
6/1/01 2.9 -6% 0.36
16.54
% 33.49
-
5.70% 29.655142
-
1.78% 46.120171 -1%
6574.31982
4 -3%
7/1/01 2.98
15%
0.29
-
19.18
% 38.42
14.71
% 27.891653
-
5.95% 43.403378 -6%
6523.35986
3 -1%
8/1/01 3
-14%
0.29
-
1.28% 33.02
-
14.04
% 30.408773 9.02% 39.999191 -8%
6215.66015
6 -5%
6
-
8.65% 37.81
-
1.87% 37.261917
-
3.66% 65.115356 -4%
6811.16992
2 -1%
5/1/00 2
4%
0.65
-
32.29
% 39.35 4.06% 35.618011
-
4.41% 59.536362 -9% 6805.25 0%
6/1/00 2.12 0% 0.81
24.70
% 39.35 0.00% 33.410534
-
6.20% 60.717285 2%
6798.16992
2 0%
7/1/00 2.3 -4% 0.78
-
2.98% 37.77
-
4.02% 32.309086
-
3.30% 55.138313 -9%
6773.85009
8 0%
8/1/00 2.4
-14%
0.94
19.93
% 32.56
-
13.80
% 29.417778
-
8.95% 56.848682 3%
7132.29980
5 5%
9/1/00 2.45
1%
0.40
-
57.74
% 32.90 1.05% 30.988274 5.34% 51.147511 -10%
7010.81005
9 -2%
10/1/0
0 2.5
-6%
0.30
-
24.03
% 31.05
-
5.61% 26.600962
-
14.16
% 52.324055 2%
7042.31982
4 0%
11/1/0
0 2.56
15%
0.25
-
15.65
% 35.72
15.01
% 25.215502
-
5.21% 46.525513 -11%
6659.12011
7 -5%
12/1/0
0 2.6 2% 0.23
-
9.85% 36.36 1.80% 28.192682
11.81
% 41.105686 -12%
6945.56982
4 4%
1/1/01 2.62 7% 0.33
45.38
% 38.92 7.05% 30.379232 7.76% 44.475113 8%
7017.14990
2 1%
2/1/01 2.66
-12%
0.28
-
15.61
% 34.32
-
11.81
% 29.030096
-
4.44% 45.448086 2%
6629.08984
4 -6%
3/1/01 2.67 1% 0.34
20.93
% 34.60 0.82% 30.28676 4.33% 46.199005 2%
6298.35009
8 -5%
4/1/01 2.7 3% 0.39
15.50
% 35.51 2.61% 29.741903
-
1.80% 44.326443 -4% 6712.52002 7%
5/1/01 2.89
0%
0.31
-
21.73
% 35.51 0.02% 30.191292 1.51% 46.64389 5%
6784.85009
8 1%
6/1/01 2.9 -6% 0.36
16.54
% 33.49
-
5.70% 29.655142
-
1.78% 46.120171 -1%
6574.31982
4 -3%
7/1/01 2.98
15%
0.29
-
19.18
% 38.42
14.71
% 27.891653
-
5.95% 43.403378 -6%
6523.35986
3 -1%
8/1/01 3
-14%
0.29
-
1.28% 33.02
-
14.04
% 30.408773 9.02% 39.999191 -8%
6215.66015
6 -5%
6
⊘ This is a preview!⊘
Do you want full access?
Subscribe today to unlock all pages.
Trusted by 1+ million students worldwide
9/1/01 3.01
3%
0.24
-
16.39
% 34.02 3.02% 28.632313
-
5.84% 33.943676 -15%
5750.41992
2 -7%
10/1/0
1 3.06 4% 0.27
13.22
% 35.38 4.00% 29.011551 1.32% 32.323086 -5%
5776.85009
8 0%
11/1/0
1 3.33 7% 0.33
21.30
% 37.96 7.30% 28.139305
-
3.01% 34.096916 5%
6125.04003
9 6%
12/1/0
1 3.38 4% 0.34 2.82% 39.61 4.35% 28.905918 2.72% 33.479355 -2%
6236.39013
7 2%
1/1/02 3.4 4% 0.38
12.88
% 41.33 4.35% 32.066795
10.94
% 34.399113 3%
6116.89990
2 -2%
2/1/02 3.44
3%
0.33
-
12.22
% 42.73 3.38% 33.784649 5.36% 33.80127 -2%
6117.95996
1 0%
3/1/02 3.46 -1% 0.37 9.08% 42.24
-
1.15% 37.624153
11.36
% 38.202991 13%
6348.79003
9 4%
4/1/02 3.48 -9% 0.37 2.53% 38.54
-
8.77% 37.747009 0.33% 36.158195 -5%
6071.22021
5 -4%
5/1/02 3.49 -3% 0.36
-
4.00% 37.33
-
3.15% 37.961998 0.57% 36.514294 1% 6035.27002 -1%
6/1/02 3.5
2%
0.27
-
23.95
% 37.95 1.68% 33.187317
-
12.58
% 34.95137 -4%
5636.54003
9 -7%
7/1/02 3.51
-10%
0.24
-
13.88
% 33.98
-
10.48
% 36.814754
10.93
% 31.634289 -9%
5195.60986
3 -8%
8/1/02 3.52 9% 0.23
-
3.34% 36.95 8.74% 37.324146 1.38% 32.999374 4%
5239.81005
9 1%
9/1/02 3.53 -8% 0.22
-
1.70% 34.02
-
7.93% 36.405628
-
2.46% 33.698395 2%
4709.95996
1 -10%
10/1/0
2 3.54 9% 0.25
10.83
% 37.05 8.90% 41.358047
13.60
% 32.18856 -4%
5000.31982
4 6%
11/1/0
2 3.55 1% 0.24
-
3.55% 37.29 0.65% 44.424194 7.41% 35.036522 9%
5236.85009
8 5%
12/1/0
2 3.56 -6% 0.22
-
7.55% 34.94
-
6.29% 50.300129
13.23
% 35.102745 0% 5000 -5%
1/1/03 3.57 -5% 0.22 0.21% 33.12
-
5.23% 53.169525 5.70% 31.658703 -10%
4868.68017
6 -3%
2/1/03 3.58
1%
0.23 4.53% 33.30 0.54% 46.32354
-
12.88
% 31.446772 -1%
4716.06982
4 -3%
3/1/03 3.59 8% - 36.05 8.26% 39.061947 - 29.771107 -5% 4730.20996 0%
7
3%
0.24
-
16.39
% 34.02 3.02% 28.632313
-
5.84% 33.943676 -15%
5750.41992
2 -7%
10/1/0
1 3.06 4% 0.27
13.22
% 35.38 4.00% 29.011551 1.32% 32.323086 -5%
5776.85009
8 0%
11/1/0
1 3.33 7% 0.33
21.30
% 37.96 7.30% 28.139305
-
3.01% 34.096916 5%
6125.04003
9 6%
12/1/0
1 3.38 4% 0.34 2.82% 39.61 4.35% 28.905918 2.72% 33.479355 -2%
6236.39013
7 2%
1/1/02 3.4 4% 0.38
12.88
% 41.33 4.35% 32.066795
10.94
% 34.399113 3%
6116.89990
2 -2%
2/1/02 3.44
3%
0.33
-
12.22
% 42.73 3.38% 33.784649 5.36% 33.80127 -2%
6117.95996
1 0%
3/1/02 3.46 -1% 0.37 9.08% 42.24
-
1.15% 37.624153
11.36
% 38.202991 13%
6348.79003
9 4%
4/1/02 3.48 -9% 0.37 2.53% 38.54
-
8.77% 37.747009 0.33% 36.158195 -5%
6071.22021
5 -4%
5/1/02 3.49 -3% 0.36
-
4.00% 37.33
-
3.15% 37.961998 0.57% 36.514294 1% 6035.27002 -1%
6/1/02 3.5
2%
0.27
-
23.95
% 37.95 1.68% 33.187317
-
12.58
% 34.95137 -4%
5636.54003
9 -7%
7/1/02 3.51
-10%
0.24
-
13.88
% 33.98
-
10.48
% 36.814754
10.93
% 31.634289 -9%
5195.60986
3 -8%
8/1/02 3.52 9% 0.23
-
3.34% 36.95 8.74% 37.324146 1.38% 32.999374 4%
5239.81005
9 1%
9/1/02 3.53 -8% 0.22
-
1.70% 34.02
-
7.93% 36.405628
-
2.46% 33.698395 2%
4709.95996
1 -10%
10/1/0
2 3.54 9% 0.25
10.83
% 37.05 8.90% 41.358047
13.60
% 32.18856 -4%
5000.31982
4 6%
11/1/0
2 3.55 1% 0.24
-
3.55% 37.29 0.65% 44.424194 7.41% 35.036522 9%
5236.85009
8 5%
12/1/0
2 3.56 -6% 0.22
-
7.55% 34.94
-
6.29% 50.300129
13.23
% 35.102745 0% 5000 -5%
1/1/03 3.57 -5% 0.22 0.21% 33.12
-
5.23% 53.169525 5.70% 31.658703 -10%
4868.68017
6 -3%
2/1/03 3.58
1%
0.23 4.53% 33.30 0.54% 46.32354
-
12.88
% 31.446772 -1%
4716.06982
4 -3%
3/1/03 3.59 8% - 36.05 8.26% 39.061947 - 29.771107 -5% 4730.20996 0%
7
Paraphrase This Document
Need a fresh take? Get an instant paraphrase of this document with our AI Paraphraser
0.22 5.80%
15.68
% 1
4/1/03 3.6 8% 0.22 0.57% 39.09 8.43% 39.719494 1.68% 30.180204 1%
5131.56005
9 8%
5/1/03 3.61 -7% 0.28
26.23
% 36.51
-
6.59% 39.281136
-
1.10% 31.77986 5%
5435.37011
7 6%
6/1/03 3.62 2% 0.29 6.18% 37.25 2.01% 42.950878 9.34% 34.52594 9%
5505.16992
2 1%
7/1/03 3.63 4% 0.33
10.60
% 38.87 4.34% 43.776863 1.92% 34.192684 -1%
5558.99023
4 1%
8/1/03 3.64 6% 0.35 7.26% 41.13 5.83% 40.040295
-
8.54% 36.918755 8%
5660.16015
6 2%
9/1/03 3.65 -6% 0.32
-
8.36% 38.82
-
5.61% 39.583145
-
1.14% 39.691509 8%
5644.02978
5 0%
10/1/0
3 3.666 6% 0.35
10.47
% 40.98 5.55% 39.923084 0.86% 38.880852 -2%
5959.00976
6 6%
11/1/0
3 3.678 -5% 0.32
-
8.65% 38.74
-
5.47% 42.342186 6.06% 39.91954 3% 6073.02002 2%
12/1/0
3 3.71 -5% 0.33 2.20% 36.94
-
4.65% 41.987865
-
0.84% 46.071335 15% 6464 6%
1/1/04 3.726 2% 0.35 5.57% 37.56 1.69% 40.319805
-
3.97% 44.496525 -3%
6551.62988
3 1%
2/1/04 3.73 11% 0.37 6.03% 41.54
10.60
% 41.304745 2.44% 46.325966 4%
6692.37011
7 2%
3/1/04 3.74 0% 0.42
13.04
% 41.63 0.22% 40.7528
-
1.34% 49.924553 8%
6599.06005
9 -1%
4/1/04 3.747 -4% 0.40
-
4.66% 39.84
-
4.29% 42.245628 3.66% 49.358135 -1%
6439.41992
2 -2%
5/1/04 3.748 -2% 0.43 8.84% 38.96
-
2.23% 44.36108 5.01% 48.778328 -1%
6484.72021
5 1%
6/1/04
3.748
2 -6% 0.50
15.97
% 36.79
-
5.57% 46.333763 4.45% 55.028168 13%
6602.99023
4 2%
7/1/04
3.748
3 1% 0.50
-
0.61% 37.14 0.97% 45.467571
-
1.87% 53.935959 -2%
6403.14990
2 -3%
8/1/04
3.748
5 -1% 0.53 6.65% 36.90
-
0.64% 45.178837
-
0.64% 53.389866 -1%
6454.22021
5 1%
9/1/04
3.748
6 1% 0.60
12.35
% 37.36 1.25% 43.529343
-
3.65% 51.495361 -4% 6570.25 2%
10/1/0
4 3.749 1% 0.81
35.23
% 37.87 1.35% 42.594612
-
2.15% 52.626842 2%
6692.70996
1 2%
8
11/1/0
4 3.75 -3% 1.03
27.96
% 36.56
-
3.45% 42.240055
-
0.83% 50.673416 -4%
7005.72021
5 5%
12/1/0
4 3.76 1% 0.99
-
3.95% 37.10 1.46% 46.191463 9.35% 55.529816 10%
7250.06005
9 3%
1/1/05 3.771 -1% 1.19
19.41
% 36.89
-
0.55% 43.381931
-
6.08% 53.033813 -4%
7089.83007
8 -2%
2/1/05 3.772 -2% 1.38
16.67
% 36.34
-
1.51% 43.414307 0.07% 52.755714 -1% 7321.22998 3%
3/1/05 3.773 -3% 1.29
-
7.11% 35.28
-
2.91% 42.54744
-
2.00% 50.449589 -4%
7167.52978
5 -2%
4/1/05 3.775
-6%
1.11
-
13.46
% 33.29
-
5.65% 38.814049
-
8.77% 49.635555 -2%
7008.31982
4 -2%
5/1/05 3.777 0% 1.23
10.26
% 33.35 0.19% 39.448494 1.63% 48.952904 -1%
7134.33007
8 2%
6/1/05 3.781 2% 1.14
-
7.42% 34.14 2.38% 41.306656 4.71% 48.802723 0%
7217.77978
5 1%
7/1/05 3.782 2% 1.32
15.87
% 34.96 2.39% 42.998486 4.10% 51.785908 6%
7476.66015
6 4%
8/1/05 3.783 -9% 1.45 9.94% 31.85
-
8.90% 39.96629
-
7.05% 55.963734 8%
7496.08984
4 0%
9/1/05 3.784 -2% 1.65
14.33
% 31.14
-
2.23% 40.195671 0.57% 63.056484 13% 7632.97998 2%
10/1/0
5 3.785 8% 1.78 7.42% 33.62 7.96% 37.460651
-
6.80% 63.874668 1%
7433.12011
7 -3%
11/1/0
5 3.787 3% 2.09
17.76
% 34.51 2.64% 37.78096 0.86% 66.586296 4%
7645.27978
5 3%
12/1/0
5 3.788 -4% 2.22 6.00% 33.26
-
3.62% 35.512421
-
6.00% 72.002663 8%
7753.95019
5 1%
1/1/06 3.789 -1% 2.33 5.04% 32.87
-
1.17% 37.122852 4.53% 71.376358 -1%
8106.54980
5 5%
2/1/06 3.79 -2% 2.11
-
9.30% 32.33
-
1.63% 37.354103 0.62% 73.551193 3%
8060.60986
3 -1%
3/1/06 3.791 4% 1.94
-
8.42% 33.67 4.14% 38.195904 2.25% 74.948326 2%
8233.20019
5 2%
4/1/06 3.792 -4% 2.17
12.23
% 32.22
-
4.33% 40.022682 4.78% 81.314186 8%
8471.42968
8 3%
5/1/06 3.793
8%
1.84
-
15.09
% 34.66 7.59% 40.562397 1.35% 74.545502 -8%
8189.10986
3 -3%
9
⊘ This is a preview!⊘
Do you want full access?
Subscribe today to unlock all pages.
Trusted by 1+ million students worldwide
6/1/06 3.794 0% 1.77
-
4.18% 34.58
-
0.23% 42.377186 4.47% 72.608627 -3%
8169.06982
4 0%
7/1/06 3.795 -8% 2.10
18.67
% 31.95
-
7.62% 51.191513
20.80
% 73.045998 1%
8242.12011
7 1%
8/1/06 3.796 0% 2.09
-
0.16% 32.11 0.49% 48.912796
-
4.45% 75.21196 3% 8388.55957 2%
9/1/06 3.797 11% 2.38
13.46
% 35.54
10.70
% 51.962757 6.24% 75.600739 1%
8469.65039
1 1%
10/1/0
6 3.798 0% 2.50 5.33% 35.51
-
0.08% 52.801147 1.61% 82.574348 9%
8774.98046
9 4%
11/1/0
6 3.81 -6% 2.83
13.05
% 33.22
-
6.45% 52.92691 0.24% 84.008896 2% 8969 2%
12/1/0
6 3.822 0% 2.62
-
7.44% 33.28 0.17% 57.607452 8.84% 93.987816 12%
9139.01953
1 2%
1/1/07 3.84 4% 2.65 1.05% 34.49 3.65% 52.817368
-
8.32% 92.217346 -2%
9254.73046
9 1%
2/1/07 3.85 1% 2.61
-
1.31% 34.94 1.30% 49.273193
-
6.71% 93.490944 1%
9124.54003
9 -1%
3/1/07 3.866 -3% 2.87 9.81% 33.96
-
2.82% 47.880993
-
2.83% 89.684143 -4%
9261.82031
3 2%
4/1/07 3.867 3% 3.08 7.42% 34.83 2.55% 46.688858
-
2.49% 85.654068 -4%
9627.73046
9 4%
5/1/07 3.868 -1% 3.74
21.43
% 34.59
-
0.67% 46.807198 0.25% 85.188469 -1%
9978.63964
8 4%
6/1/07 3.869 2% 3.77 0.70% 35.13 1.54% 42.724464
-
8.72% 88.800316 4%
9873.01953
1 -1%
7/1/07 3.87 -4% 4.07 7.96% 33.55
-
4.49% 44.261871 3.60% 85.096756 -4% 9554.5 -3%
8/1/07 3.871 -5% 4.27 5.10% 31.86
-
5.05% 49.833878
12.59
% 81.604866 -4%
9596.98046
9 0%
9/1/07 3.872 1% 4.74
10.82
% 32.03 0.55% 51.467567 3.28% 82.437271 1%
10039.2802
7 5%
10/1/0
7 3.873 4% 5.86
23.77
% 33.18 3.57% 50.357979
-
2.16% 81.576668 -1%
10311.6103
5 3%
11/1/0
7 3.876 6% 5.62
-
4.07% 35.15 5.95% 48.429024
-
3.83% 80.158127 -2%
9856.84960
9 -4%
12/1/0
7 3.877 -1% 6.11 8.70% 34.88
-
0.77% 50.473122 4.22% 75.681519 -6%
9740.32031
3 -1%
1/1/08 3.879 7% 4.18
-
31.66 37.40 7.23% 51.484631 2.00% 77.214134 2%
9126.16015
6 -6%
10
-
4.18% 34.58
-
0.23% 42.377186 4.47% 72.608627 -3%
8169.06982
4 0%
7/1/06 3.795 -8% 2.10
18.67
% 31.95
-
7.62% 51.191513
20.80
% 73.045998 1%
8242.12011
7 1%
8/1/06 3.796 0% 2.09
-
0.16% 32.11 0.49% 48.912796
-
4.45% 75.21196 3% 8388.55957 2%
9/1/06 3.797 11% 2.38
13.46
% 35.54
10.70
% 51.962757 6.24% 75.600739 1%
8469.65039
1 1%
10/1/0
6 3.798 0% 2.50 5.33% 35.51
-
0.08% 52.801147 1.61% 82.574348 9%
8774.98046
9 4%
11/1/0
6 3.81 -6% 2.83
13.05
% 33.22
-
6.45% 52.92691 0.24% 84.008896 2% 8969 2%
12/1/0
6 3.822 0% 2.62
-
7.44% 33.28 0.17% 57.607452 8.84% 93.987816 12%
9139.01953
1 2%
1/1/07 3.84 4% 2.65 1.05% 34.49 3.65% 52.817368
-
8.32% 92.217346 -2%
9254.73046
9 1%
2/1/07 3.85 1% 2.61
-
1.31% 34.94 1.30% 49.273193
-
6.71% 93.490944 1%
9124.54003
9 -1%
3/1/07 3.866 -3% 2.87 9.81% 33.96
-
2.82% 47.880993
-
2.83% 89.684143 -4%
9261.82031
3 2%
4/1/07 3.867 3% 3.08 7.42% 34.83 2.55% 46.688858
-
2.49% 85.654068 -4%
9627.73046
9 4%
5/1/07 3.868 -1% 3.74
21.43
% 34.59
-
0.67% 46.807198 0.25% 85.188469 -1%
9978.63964
8 4%
6/1/07 3.869 2% 3.77 0.70% 35.13 1.54% 42.724464
-
8.72% 88.800316 4%
9873.01953
1 -1%
7/1/07 3.87 -4% 4.07 7.96% 33.55
-
4.49% 44.261871 3.60% 85.096756 -4% 9554.5 -3%
8/1/07 3.871 -5% 4.27 5.10% 31.86
-
5.05% 49.833878
12.59
% 81.604866 -4%
9596.98046
9 0%
9/1/07 3.872 1% 4.74
10.82
% 32.03 0.55% 51.467567 3.28% 82.437271 1%
10039.2802
7 5%
10/1/0
7 3.873 4% 5.86
23.77
% 33.18 3.57% 50.357979
-
2.16% 81.576668 -1%
10311.6103
5 3%
11/1/0
7 3.876 6% 5.62
-
4.07% 35.15 5.95% 48.429024
-
3.83% 80.158127 -2%
9856.84960
9 -4%
12/1/0
7 3.877 -1% 6.11 8.70% 34.88
-
0.77% 50.473122 4.22% 75.681519 -6%
9740.32031
3 -1%
1/1/08 3.879 7% 4.18
-
31.66 37.40 7.23% 51.484631 2.00% 77.214134 2%
9126.16015
6 -6%
10
Paraphrase This Document
Need a fresh take? Get an instant paraphrase of this document with our AI Paraphraser
%
2/1/08 3.88 -2% 3.86
-
7.64% 36.55
-
2.27% 46.881359
-
8.94% 77.378059 0%
8962.45996
1 -2%
3/1/08 3.89 6% 4.43
14.78
% 38.83 6.23% 53.040703
13.14
% 71.917778 -7%
8797.29003
9 -2%
4/1/08 3.9 11% 5.37
21.22
% 42.94
10.58
% 49.253326
-
7.14% 73.346306 2%
9299.59960
9 6%
5/1/08 3.91 0% 5.83 8.51% 42.76
-
0.41% 44.519081
-
9.61% 73.743752 1%
9401.08007
8 1%
6/1/08 3.967
-2%
5.17
-
11.29
% 41.80
-
2.26% 31.970095
-
28.19
% 67.926659 -8%
8660.48046
9 -8%
7/1/08 3.97 4% 4.91
-
5.07% 43.60 4.31% 29.073935
-
9.06% 62.18177 -8%
8438.63964
8 -3%
8/1/08 4 1% 5.23 6.66% 43.93 0.77% 35.08239
20.67
% 64.739876 4%
8382.08007
8 -1%
9/1/08 4.2
2%
3.51
-
32.96
% 44.72 1.80% 38.02446 8.39% 62.001152 -4%
7532.79980
5 -10%
10/1/0
8 4.28 -7% 3.32
-
5.34% 41.67
-
6.81% 38.477333 1.19% 55.77879 -10%
6061.08984
4 -20%
11/1/0
8 4.33
0%
2.86
-
13.87
% 41.73 0.13% 37.066452
-
3.67% 46.256298 -17%
5599.29980
5 -8%
12/1/0
8 4.45 0% 2.63
-
7.90% 41.86 0.32% 40.265938 8.63% 47.971684 4%
5757.04980
5 3%
1/1/09 4.49
-16%
2.78 5.60% 35.34
-
15.58
% 39.381096
-
2.20% 46.556862 -3%
5195.79003
9 -10%
2/1/09 4.5 4% 2.76
-
0.91% 36.93 4.50% 38.329754
-
2.67% 46.285625 -1%
4617.02978
5 -11%
3/1/09 4.56 6% 3.24
17.70
% 39.07 5.81% 45.856209
19.64
% 46.402916 0% 4978.97998 8%
4/1/09 4.66 -3% 3.88
19.70
% 38.01
-
2.72% 45.917877 0.13% 58.674614 26%
5513.35986
3 11%
5/1/09 4.68 -1% 4.19 7.93% 37.51
-
1.31% 42.975327
-
6.41% 59.408421 1%
6004.06982
4 9%
6/1/09 4.7 -2% 4.40 4.87% 36.73
-
2.09% 48.819233
13.60
% 55.984001 -6%
5905.14990
2 -2%
7/1/09 4.78 3% 5.04
14.72
% 37.82 2.97% 50.050121 2.52% 62.395519 11%
6424.27978
5 9%
11
8/1/09 4.89 2% 5.19 2.95% 38.57 1.98% 47.871719
-
4.35% 63.144142 1%
6643.24023
4 3%
9/1/09 5
-3%
5.72
10.19
% 37.43
-
2.97% 43.079411
-
10.01
% 58.237301 -8%
6910.87988
3 4%
10/1/0
9 5.16 1% 5.82 1.70% 37.88 1.20% 39.948299
-
7.27% 59.30825 2%
6739.45019
5 -2%
11/1/0
9 5.18 10% 6.17 6.05% 41.59 9.80% 42.109837 5.41% 59.045147 0%
7092.35986
3 5%
12/1/0
9 6.13 -2% 6.50 5.41% 40.75
-
2.02% 48.325844
14.76
% 63.270168 7%
7184.95996
1 1%
1/1/10 6.47 0% 5.93
-
8.86% 40.94 0.47% 45.150036
-
6.57% 57.887394 -9%
6883.77978
5 -4%
2/1/10 5.63 1% 6.32 6.54% 41.43 1.20% 49.784039
10.26
% 56.256016 -3%
7035.04003
9 2%
3/1/10 5.91 3% 7.25
14.85
% 42.60 2.83% 52.739239 5.94% 60.458492 7%
7447.79980
5 6%
4/1/10 6.28 -3% 8.06
11.10
% 41.33
-
2.98% 49.520573
-
6.10% 58.976868 -2%
7474.39990
2 0%
5/1/10 6.23 -6% 7.93
-
1.61% 38.96
-
5.74% 44.737545
-
9.66% 55.342937 -6%
6791.56982
4 -9%
6/1/10 6.6 -4% 7.76
-
2.08% 37.25
-
4.37% 43.279095
-
3.26% 52.458748 -5%
6469.64990
2 -5%
7/1/10 7.64 6% 7.94 2.27% 39.67 6.49% 46.602692 7.68% 53.728714 2%
6998.99023
4 8%
8/1/10 8.38 -2% 7.50
-
5.50% 38.86
-
2.05% 44.913795
-
3.62% 51.900265 -3%
6704.14990
2 -4%
9/1/10 7.87 7% 8.76
16.72
% 41.72 7.36% 48.038727 6.96% 54.76152 6%
7281.06982
4 9%
10/1/1
0 8.89 1% 9.29 6.07% 42.23 1.21% 48.392689 0.74% 54.625507 0%
7513.35009
8 3%
11/1/1
0 9.44 0% 9.60 3.38% 42.16
-
0.15% 53.094002 9.71% 59.924553 10%
7430.93994
1 -1%
12/1/1
0 10.53 0% 9.95 3.67% 42.04
-
0.30% 50.674397
-
4.56% 60.649609 1% 7964.02002 7%
1/1/11 14.13 5% 10.47 5.20% 43.95 4.54% 49.252079
-
2.81% 63.387821 5%
8139.16015
6 2%
2/1/11 15.88 -7% 10.90 4.09% 40.74
-
7.29% 52.607273 6.81% 71.964996 14%
8438.54980
5 4%
12
-
4.35% 63.144142 1%
6643.24023
4 3%
9/1/09 5
-3%
5.72
10.19
% 37.43
-
2.97% 43.079411
-
10.01
% 58.237301 -8%
6910.87988
3 4%
10/1/0
9 5.16 1% 5.82 1.70% 37.88 1.20% 39.948299
-
7.27% 59.30825 2%
6739.45019
5 -2%
11/1/0
9 5.18 10% 6.17 6.05% 41.59 9.80% 42.109837 5.41% 59.045147 0%
7092.35986
3 5%
12/1/0
9 6.13 -2% 6.50 5.41% 40.75
-
2.02% 48.325844
14.76
% 63.270168 7%
7184.95996
1 1%
1/1/10 6.47 0% 5.93
-
8.86% 40.94 0.47% 45.150036
-
6.57% 57.887394 -9%
6883.77978
5 -4%
2/1/10 5.63 1% 6.32 6.54% 41.43 1.20% 49.784039
10.26
% 56.256016 -3%
7035.04003
9 2%
3/1/10 5.91 3% 7.25
14.85
% 42.60 2.83% 52.739239 5.94% 60.458492 7%
7447.79980
5 6%
4/1/10 6.28 -3% 8.06
11.10
% 41.33
-
2.98% 49.520573
-
6.10% 58.976868 -2%
7474.39990
2 0%
5/1/10 6.23 -6% 7.93
-
1.61% 38.96
-
5.74% 44.737545
-
9.66% 55.342937 -6%
6791.56982
4 -9%
6/1/10 6.6 -4% 7.76
-
2.08% 37.25
-
4.37% 43.279095
-
3.26% 52.458748 -5%
6469.64990
2 -5%
7/1/10 7.64 6% 7.94 2.27% 39.67 6.49% 46.602692 7.68% 53.728714 2%
6998.99023
4 8%
8/1/10 8.38 -2% 7.50
-
5.50% 38.86
-
2.05% 44.913795
-
3.62% 51.900265 -3%
6704.14990
2 -4%
9/1/10 7.87 7% 8.76
16.72
% 41.72 7.36% 48.038727 6.96% 54.76152 6%
7281.06982
4 9%
10/1/1
0 8.89 1% 9.29 6.07% 42.23 1.21% 48.392689 0.74% 54.625507 0%
7513.35009
8 3%
11/1/1
0 9.44 0% 9.60 3.38% 42.16
-
0.15% 53.094002 9.71% 59.924553 10%
7430.93994
1 -1%
12/1/1
0 10.53 0% 9.95 3.67% 42.04
-
0.30% 50.674397
-
4.56% 60.649609 1% 7964.02002 7%
1/1/11 14.13 5% 10.47 5.20% 43.95 4.54% 49.252079
-
2.81% 63.387821 5%
8139.16015
6 2%
2/1/11 15.88 -7% 10.90 4.09% 40.74
-
7.29% 52.607273 6.81% 71.964996 14%
8438.54980
5 4%
12
⊘ This is a preview!⊘
Do you want full access?
Subscribe today to unlock all pages.
Trusted by 1+ million students worldwide
1 out of 29


Your All-in-One AI-Powered Toolkit for Academic Success.
+13062052269
info@desklib.com
Available 24*7 on WhatsApp / Email
![[object Object]](/_next/static/media/star-bottom.7253800d.svg)
Unlock your academic potential
Copyright © 2020–2026 A2Z Services. All Rights Reserved. Developed and managed by ZUCOL.