Evaluating Risk, Return, and Leverage in Portfolio Management

Verified

Added on  2023/04/24

|6
|609
|381
Report
AI Summary
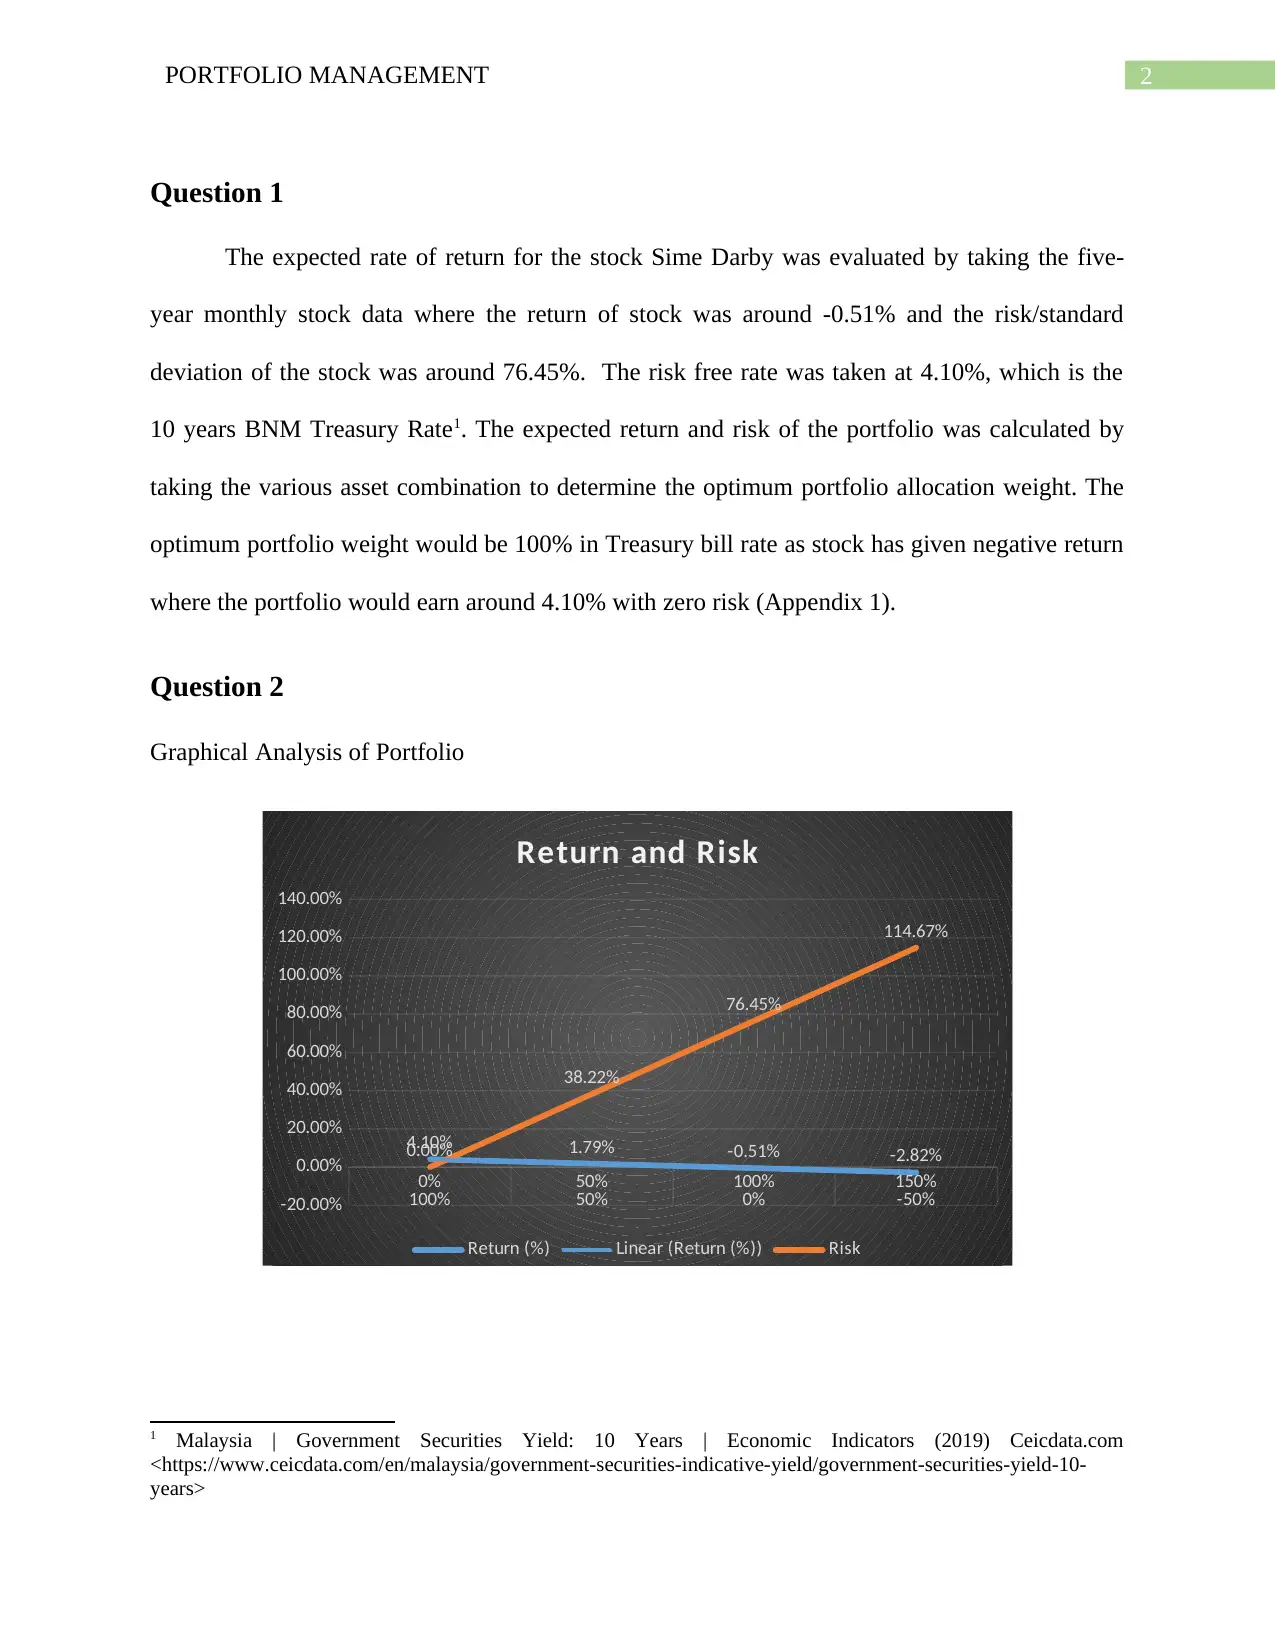
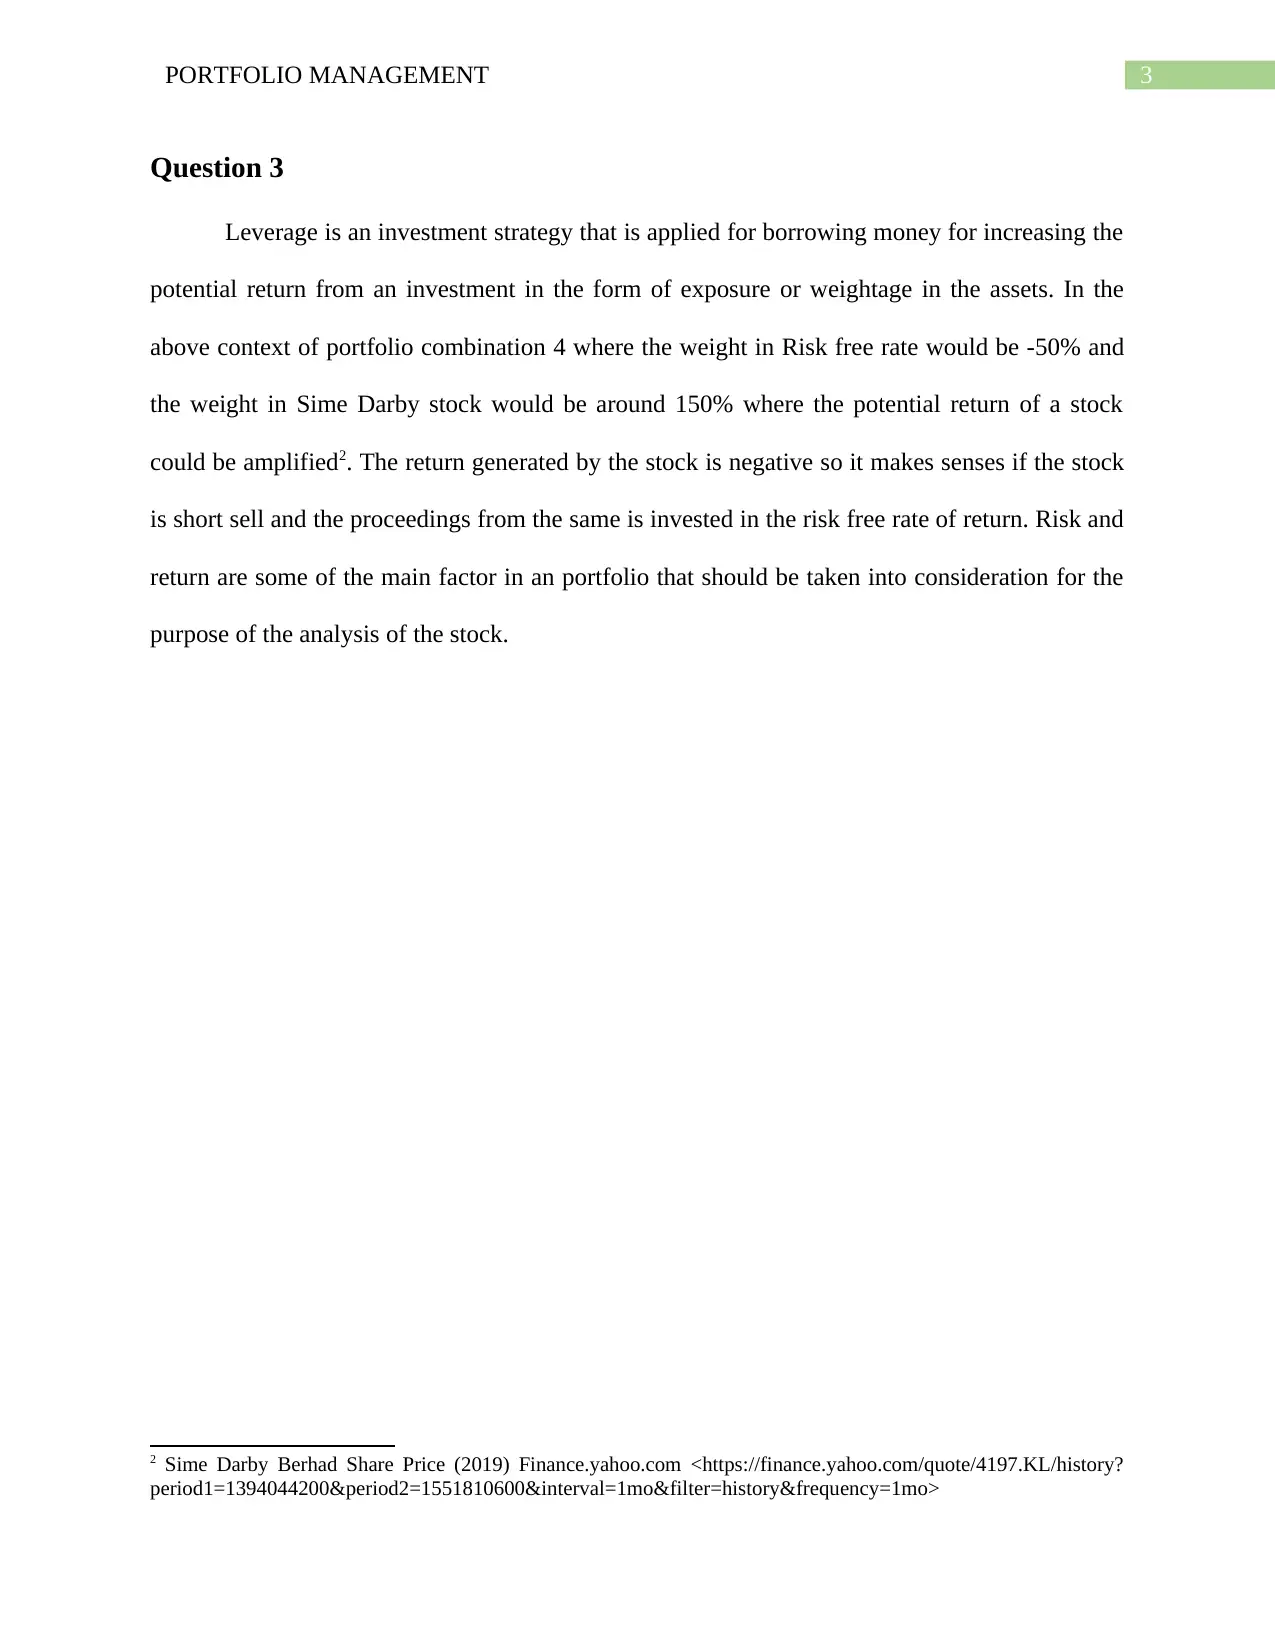
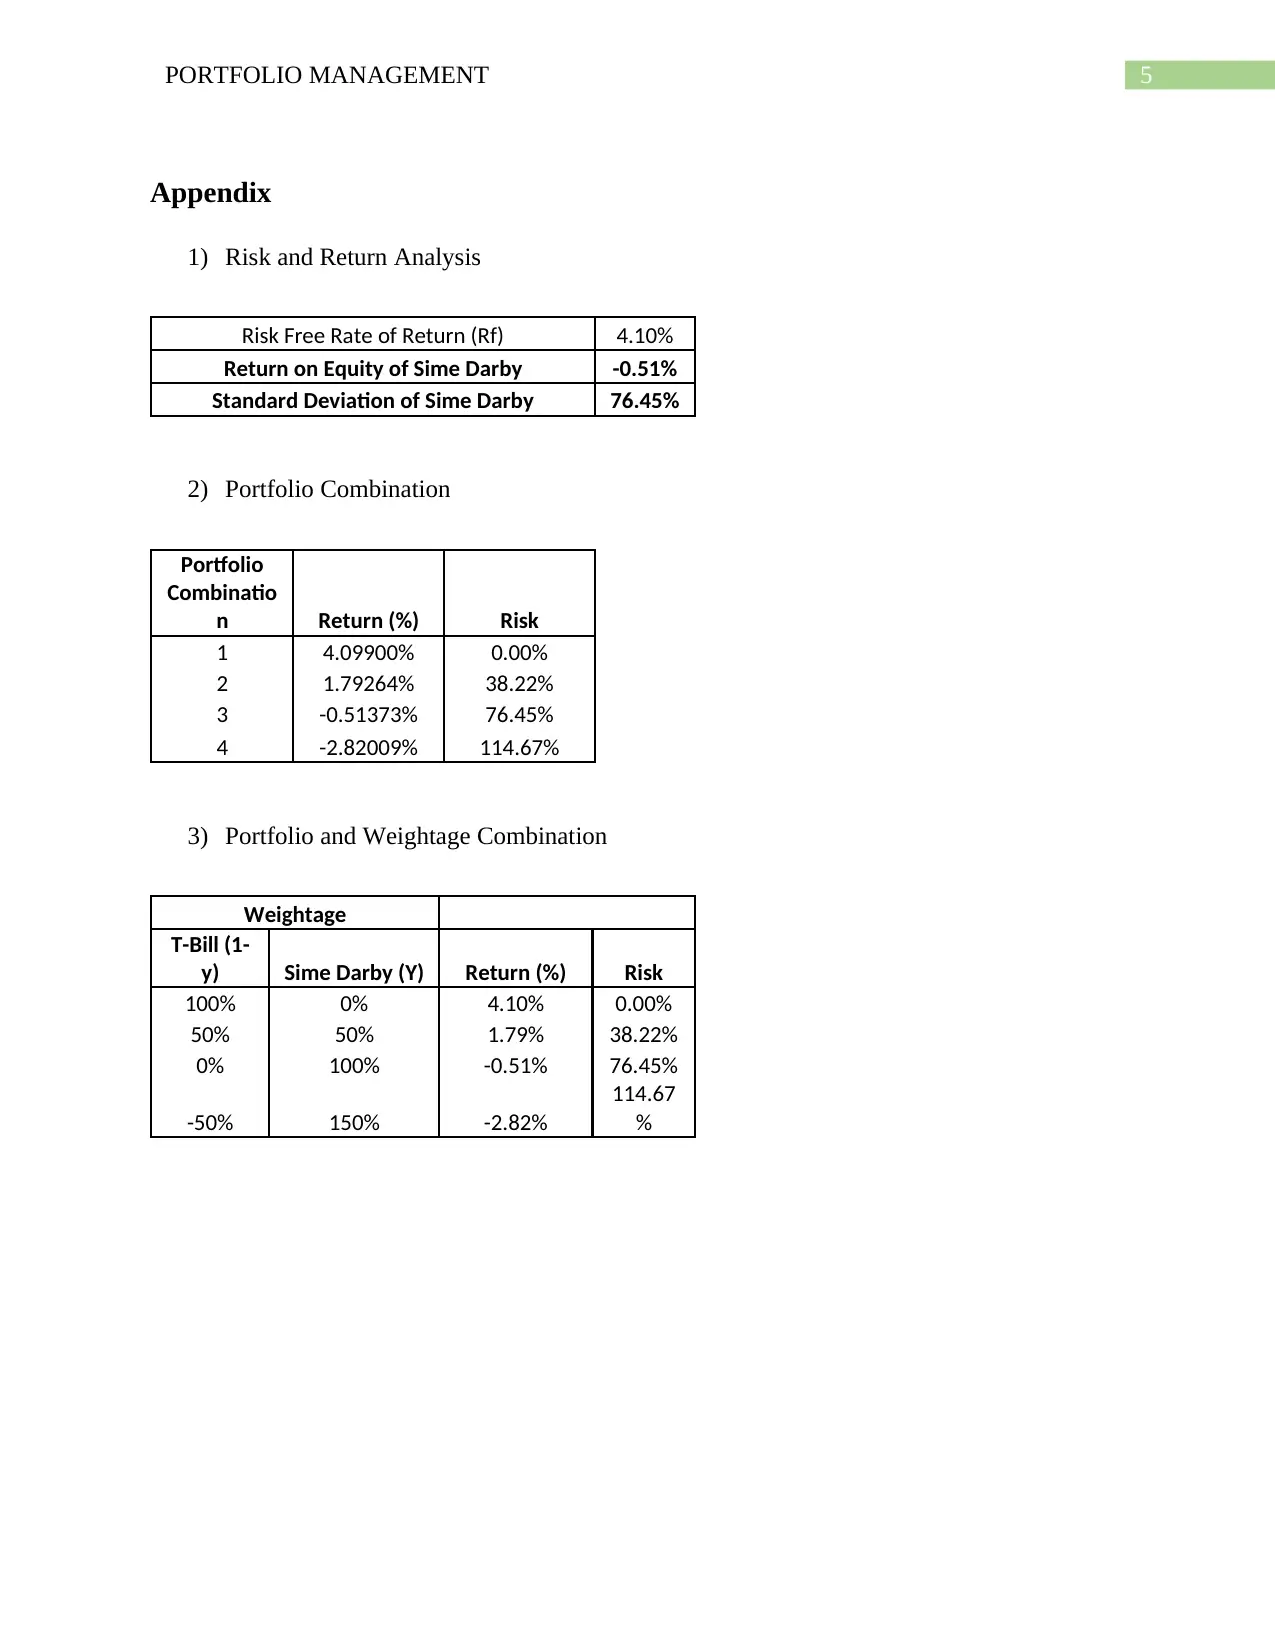
This report evaluates portfolio management strategies, focusing on risk, return, and leverage, using the stock of Sime Darby as an example. The analysis involves calculating the expected rate of return and risk associated with the stock, considering a risk-free rate based on the 10-year BNM Treasury Rate. The optimum portfolio allocation weight is determined by examining various asset combinations, revealing a preference for Treasury bills due to the stock's negative return. The report further explores the concept of leverage, illustrating how borrowing can amplify potential returns, and it discusses the importance of considering risk and return in portfolio analysis. Desklib provides students with access to this and other solved assignments.
Document Page
Running head: PORTFOLIO MANAGEMENT
Portfolio Management
Name of the Student:
Name of the University:
Author’s Note:
tabler-icon-diamond-filled.svg

Paraphrase This Document

Need a fresh take? Get an instant paraphrase of this document with our AI Paraphraser
Document Page
1PORTFOLIO MANAGEMENT
Table of Contents
Question 1........................................................................................................................................2
Question 2........................................................................................................................................2
Question 3........................................................................................................................................3
Reference.........................................................................................................................................4
Appendix..........................................................................................................................................5
Document Page
2PORTFOLIO MANAGEMENT
Question 1
The expected rate of return for the stock Sime Darby was evaluated by taking the five-
year monthly stock data where the return of stock was around -0.51% and the risk/standard
deviation of the stock was around 76.45%. The risk free rate was taken at 4.10%, which is the
10 years BNM Treasury Rate1. The expected return and risk of the portfolio was calculated by
taking the various asset combination to determine the optimum portfolio allocation weight. The
optimum portfolio weight would be 100% in Treasury bill rate as stock has given negative return
where the portfolio would earn around 4.10% with zero risk (Appendix 1).
Question 2
Graphical Analysis of Portfolio
1 Malaysia | Government Securities Yield: 10 Years | Economic Indicators (2019) Ceicdata.com
<https://www.ceicdata.com/en/malaysia/government-securities-indicative-yield/government-securities-yield-10-
years>
0% 50% 100% 150%
100% 50% 0% -50%-20.00%
0.00%
20.00%
40.00%
60.00%
80.00%
100.00%
120.00%
140.00%
4.10% 1.79% -0.51% -2.82%0.00%
38.22%
76.45%
114.67%
Return and Risk
Return (%) Linear (Return (%)) Risk
Document Page
3PORTFOLIO MANAGEMENT
Question 3
Leverage is an investment strategy that is applied for borrowing money for increasing the
potential return from an investment in the form of exposure or weightage in the assets. In the
above context of portfolio combination 4 where the weight in Risk free rate would be -50% and
the weight in Sime Darby stock would be around 150% where the potential return of a stock
could be amplified2. The return generated by the stock is negative so it makes senses if the stock
is short sell and the proceedings from the same is invested in the risk free rate of return. Risk and
return are some of the main factor in an portfolio that should be taken into consideration for the
purpose of the analysis of the stock.
2 Sime Darby Berhad Share Price (2019) Finance.yahoo.com <https://finance.yahoo.com/quote/4197.KL/history?
period1=1394044200&period2=1551810600&interval=1mo&filter=history&frequency=1mo>
tabler-icon-diamond-filled.svg

Paraphrase This Document

Need a fresh take? Get an instant paraphrase of this document with our AI Paraphraser
Document Page
4PORTFOLIO MANAGEMENT
Reference
Malaysia | Government Securities Yield: 10 Years | Economic Indicators (2019) Ceicdata.com
<https://www.ceicdata.com/en/malaysia/government-securities-indicative-yield/government-
securities-yield-10-years>
Sime Darby Berhad Share Price (2019) Finance.yahoo.com
https://finance.yahoo.com/quote/4197.KL/history?
period1=1394044200&period2=1551810600&interval=1mo&filter=history&frequency=1mo
Document Page
5PORTFOLIO MANAGEMENT
Appendix
1) Risk and Return Analysis
Risk Free Rate of Return (Rf) 4.10%
Return on Equity of Sime Darby -0.51%
Standard Deviation of Sime Darby 76.45%
2) Portfolio Combination
Portfolio
Combinatio
n Return (%) Risk
1 4.09900% 0.00%
2 1.79264% 38.22%
3 -0.51373% 76.45%
4 -2.82009% 114.67%
3) Portfolio and Weightage Combination
Weightage
T-Bill (1-
y) Sime Darby (Y) Return (%) Risk
100% 0% 4.10% 0.00%
50% 50% 1.79% 38.22%
0% 100% -0.51% 76.45%
-50% 150% -2.82%
114.67
%
chevron_up_icon
1 out of 6
circle_padding
hide_on_mobile
zoom_out_icon
[object Object]