MAF707 Finance: Portfolio Management Report, Trimester 1, 2019
VerifiedAdded on 2023/02/01
|19
|3859
|94
Report
AI Summary
This finance portfolio management report analyzes two Australian Stock Exchange-listed companies: AGL Energy Limited (energy) and Amcor Limited (packaging). The report examines their financial performance through a detailed financial ratio analysis, including liquidity, efficiency, leverage, and profitability ratios, using data from 2016, 2017, and 2018. The discussion covers each company's business operations, strategic positioning, and financial health. The report evaluates the current and quick ratios for liquidity, trade receivables and payables for efficiency, debt-to-equity, debt-to-asset, and equity-to-total-asset ratios for leverage, and return on asset and equity for profitability. The analysis reveals the financial strengths and weaknesses of each company, offering insights into their ability to meet obligations, manage assets, and generate profits. The conclusion summarizes the key findings, providing an overview of the companies' financial performance and strategic positions. This document is a comprehensive analysis of the companies' financial health.
Running head: FINANCE PORTFOLIO MANAGEMENT
Finance Portfolio Management
Name of the student:
Name of the university:
Author Note:
Finance Portfolio Management
Name of the student:
Name of the university:
Author Note:
Paraphrase This Document
Need a fresh take? Get an instant paraphrase of this document with our AI Paraphraser
1FINANCE PORTFOLIO MANAGEMENT
Table of Contents
Introduction:...............................................................................................................................2
Discussion:.................................................................................................................................3
Financial Ratio Analysis........................................................................................................4
Efficiency Ratio.....................................................................................................................6
Leverage Ratio.......................................................................................................................7
Profitability Ratio.................................................................................................................10
Business and Analysis of the Strategic Position..................................................................11
Conclusion................................................................................................................................15
2FINANCE PORTFOLIO MANAGEMENT
Introduction:
The research is conducted on the two chosen company which is further listed in the
Australian Stock Exchange which are the AGL energy limited which is energy based industry
and the other company is the Amcor limited which is the utilities based industry. The chosen
company for this assignment are from different line of industry and detailed analysis has been
made in the following study.
⊘ This is a preview!⊘
Do you want full access?
Subscribe today to unlock all pages.
Trusted by 1+ million students worldwide
3FINANCE PORTFOLIO MANAGEMENT
Discussion:
AGL energy limited is the Australian listed company which deals with the generation
and transaction of electricity and gas for domestic and commercial purpose. AGL energy
limited further provides electricity, natural gas, and telecommunication facilities to
commercial and domestic clients in the south-east New South Wales and Australian Capital
Terrain. The sustainable growth of AGL energy limited all over the world shaped a value
addition of the business. The company retains most of electricity proposals obtainable for
South Australia clients, with the changes being the discounts and other circumstances. The
responsibility towards the corporate sustainability development is that AGL energy takes
certain actions about the wellbeing of the community and the environment.
Amcor limited is also listed in the Australian Stock Exchange which deals with the
packaging of materials which consists the flexible packaging, inflexible containers, specialty
cartons, closures and services for food, beverage and many other similar products. This
company provides major packaging solution all over the world and thus considered as one of
the global packaging company.
In the research study of both the company, it is needed to analyze the key financial
ratios of the two business in order to understand the financial performance of the business in
that case. Ratio analysis is an important instrument which is adopted by the business as a
dimension of the financial statement analysis of the company. The key ratios of the company
must be analyzed in order to understand the current and the past financial performance of the
business.
Paraphrase This Document
Need a fresh take? Get an instant paraphrase of this document with our AI Paraphraser
4FINANCE PORTFOLIO MANAGEMENT
Financial Ratio Analysis
The financial ratio analysis plays significant role in order to understand the financial
performance of the company from the annual report of the last three years which are the
2018, 2017 and 2016. The values and the figures have been taken from the consolidated
income statement and balance sheet of the company.
Liquidity Ratio
Liquidity ratio is one of the significant financial ratios which specify that whether the
current assets of the business are adequate to meet the short and the long term obligations of
the business when it becomes outstanding. Under the liquidity ratio there are two ratios which
are the current ratio and the quick ratios (Robinson et al. 2015).
The analysis of liquidity ratio of the business, the performance of the working capital
of the business can be examined which is further known as the display of liquidity. The term
liquidity refers to the ability of a company to covert assets into cash quickly and cheaply. A
higher liquidity ratio of the company indicates that more liquidity has improved exposure of
the outstanding debts in the business. The evaluation is done on the past three year’s annual
report.
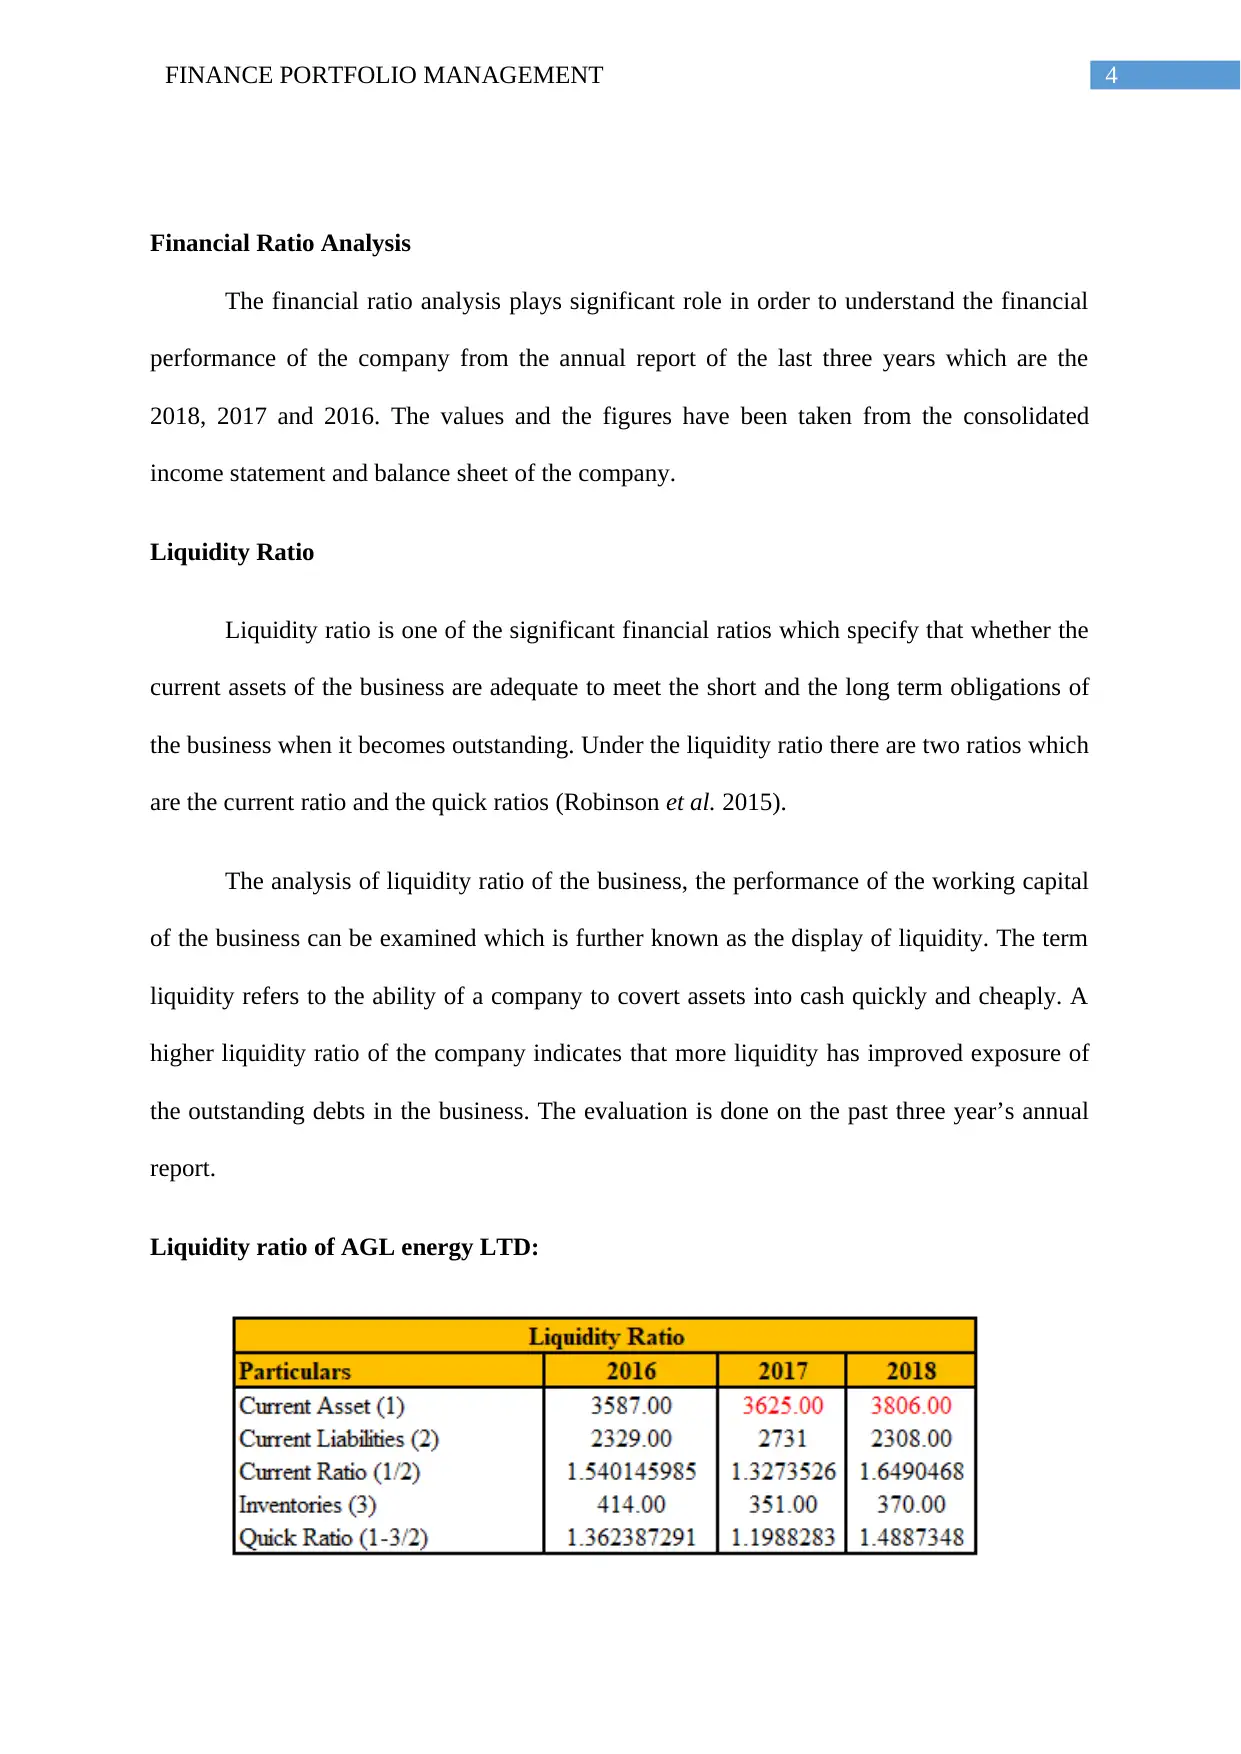
Liquidity ratio of AGL energy LTD:
Financial Ratio Analysis
The financial ratio analysis plays significant role in order to understand the financial
performance of the company from the annual report of the last three years which are the
2018, 2017 and 2016. The values and the figures have been taken from the consolidated
income statement and balance sheet of the company.
Liquidity Ratio
Liquidity ratio is one of the significant financial ratios which specify that whether the
current assets of the business are adequate to meet the short and the long term obligations of
the business when it becomes outstanding. Under the liquidity ratio there are two ratios which
are the current ratio and the quick ratios (Robinson et al. 2015).
The analysis of liquidity ratio of the business, the performance of the working capital
of the business can be examined which is further known as the display of liquidity. The term
liquidity refers to the ability of a company to covert assets into cash quickly and cheaply. A
higher liquidity ratio of the company indicates that more liquidity has improved exposure of
the outstanding debts in the business. The evaluation is done on the past three year’s annual
report.
Liquidity ratio of AGL energy LTD:
5FINANCE PORTFOLIO MANAGEMENT
From the above evaluation of the current ratio of AGL energy limited it can be
interpreted that as the standard of the current ratio is 1:1. This further means that the current
ratio of the company is satisfactory. This indicates that the company have the capacity to pay
off its current liabilities by utilizing the current assets. The ratio was at peak in the year 2018
which was about 1.61.
The quick ratio of AGL energy limited indicates that the capacity of the company in
order to meet the short term obligation in the business by excluding the inventories from the
current assets. The standard quick ratio is 1:1 which indicates the company’s performance in
terms of liquidity is good as the ratio is above the standard.
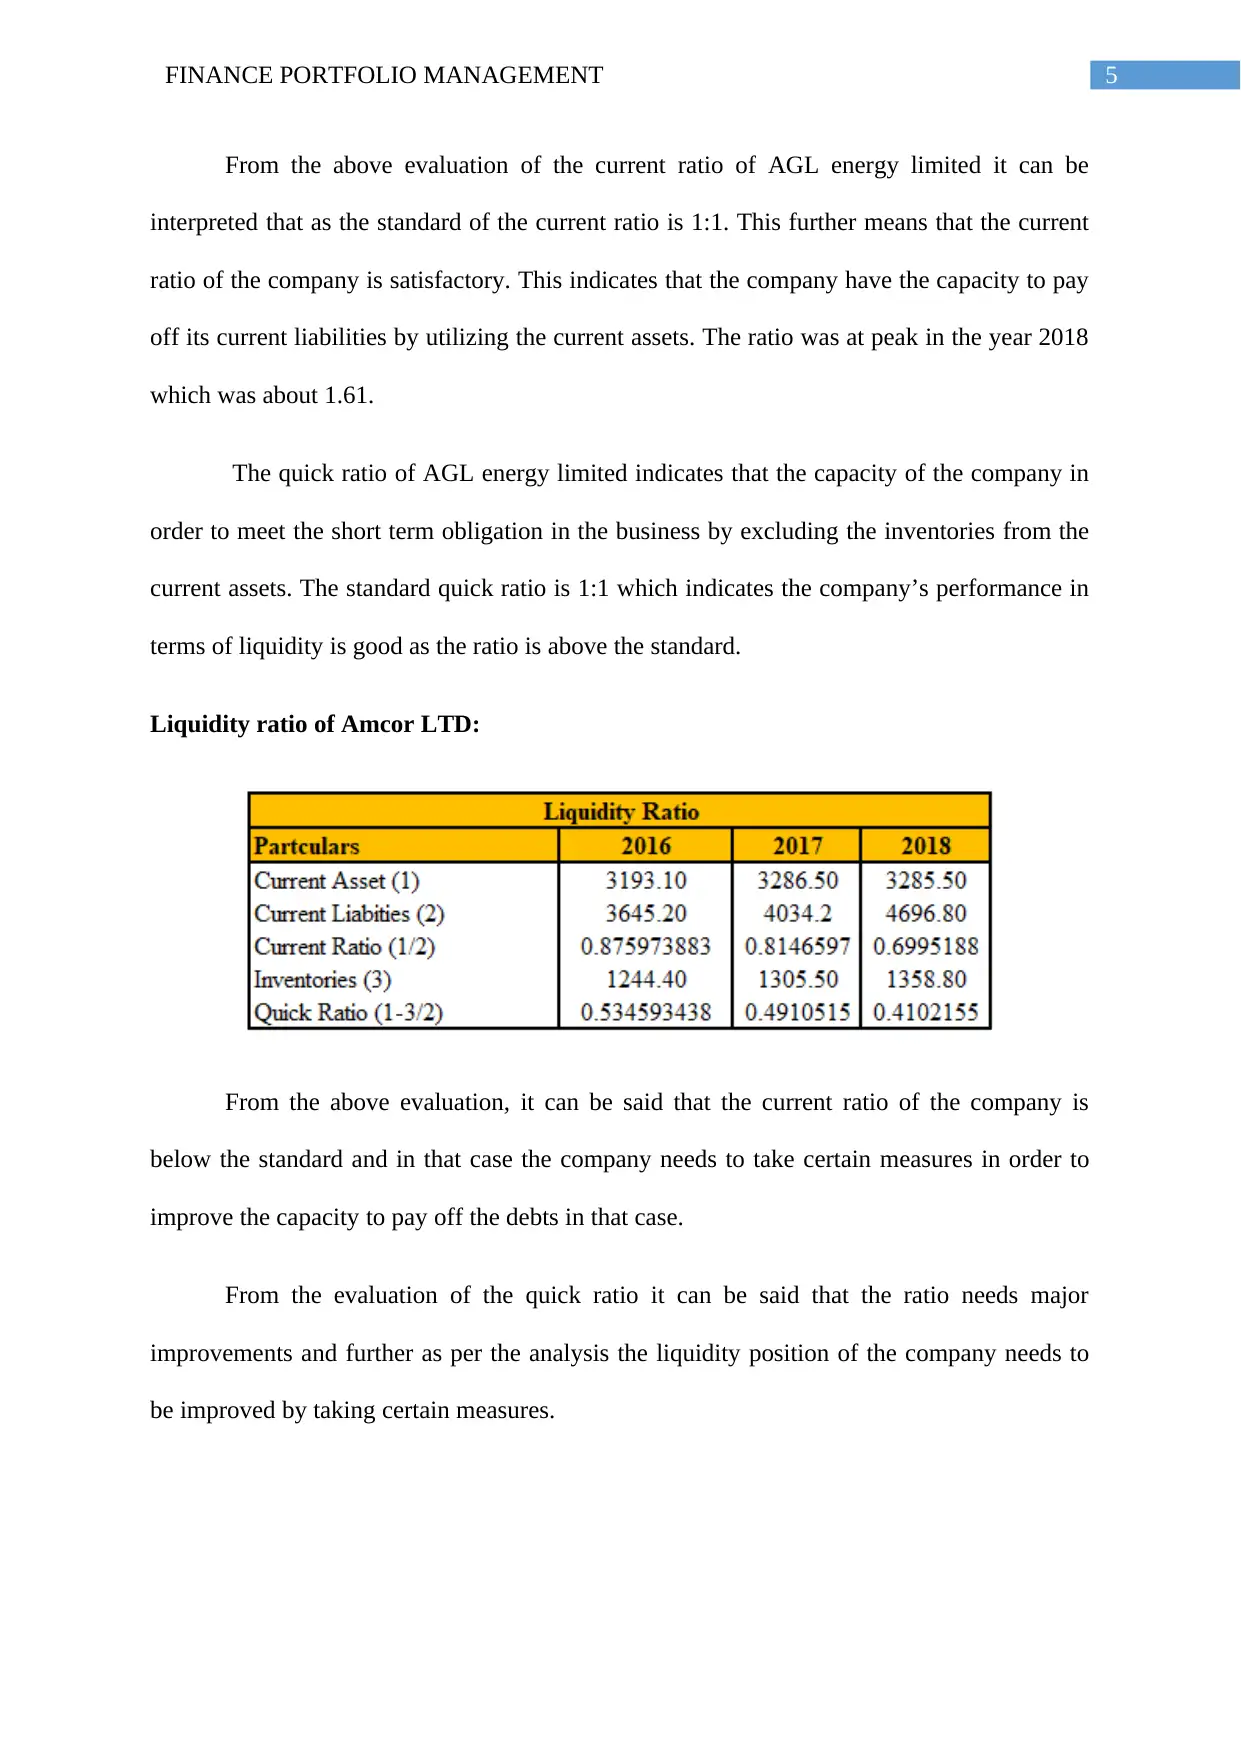
Liquidity ratio of Amcor LTD:
From the above evaluation, it can be said that the current ratio of the company is
below the standard and in that case the company needs to take certain measures in order to
improve the capacity to pay off the debts in that case.
From the evaluation of the quick ratio it can be said that the ratio needs major
improvements and further as per the analysis the liquidity position of the company needs to
be improved by taking certain measures.
From the above evaluation of the current ratio of AGL energy limited it can be
interpreted that as the standard of the current ratio is 1:1. This further means that the current
ratio of the company is satisfactory. This indicates that the company have the capacity to pay
off its current liabilities by utilizing the current assets. The ratio was at peak in the year 2018
which was about 1.61.
The quick ratio of AGL energy limited indicates that the capacity of the company in
order to meet the short term obligation in the business by excluding the inventories from the
current assets. The standard quick ratio is 1:1 which indicates the company’s performance in
terms of liquidity is good as the ratio is above the standard.
Liquidity ratio of Amcor LTD:
From the above evaluation, it can be said that the current ratio of the company is
below the standard and in that case the company needs to take certain measures in order to
improve the capacity to pay off the debts in that case.
From the evaluation of the quick ratio it can be said that the ratio needs major
improvements and further as per the analysis the liquidity position of the company needs to
be improved by taking certain measures.
⊘ This is a preview!⊘
Do you want full access?
Subscribe today to unlock all pages.
Trusted by 1+ million students worldwide
6FINANCE PORTFOLIO MANAGEMENT
Efficiency Ratio
The efficiency ratio of the company measures the expenses which is stated as a
percentage of revenue. This ratio helps to analyze the efficiency of the company to use its
assets and liabilities internally. An efficiency ratio of the company is evaluated to find out the
turnover of the receivables, repayment of the liabilities, and usage of equity and further the
general use of the machinery and inventory (Barr and McClellan 2018).
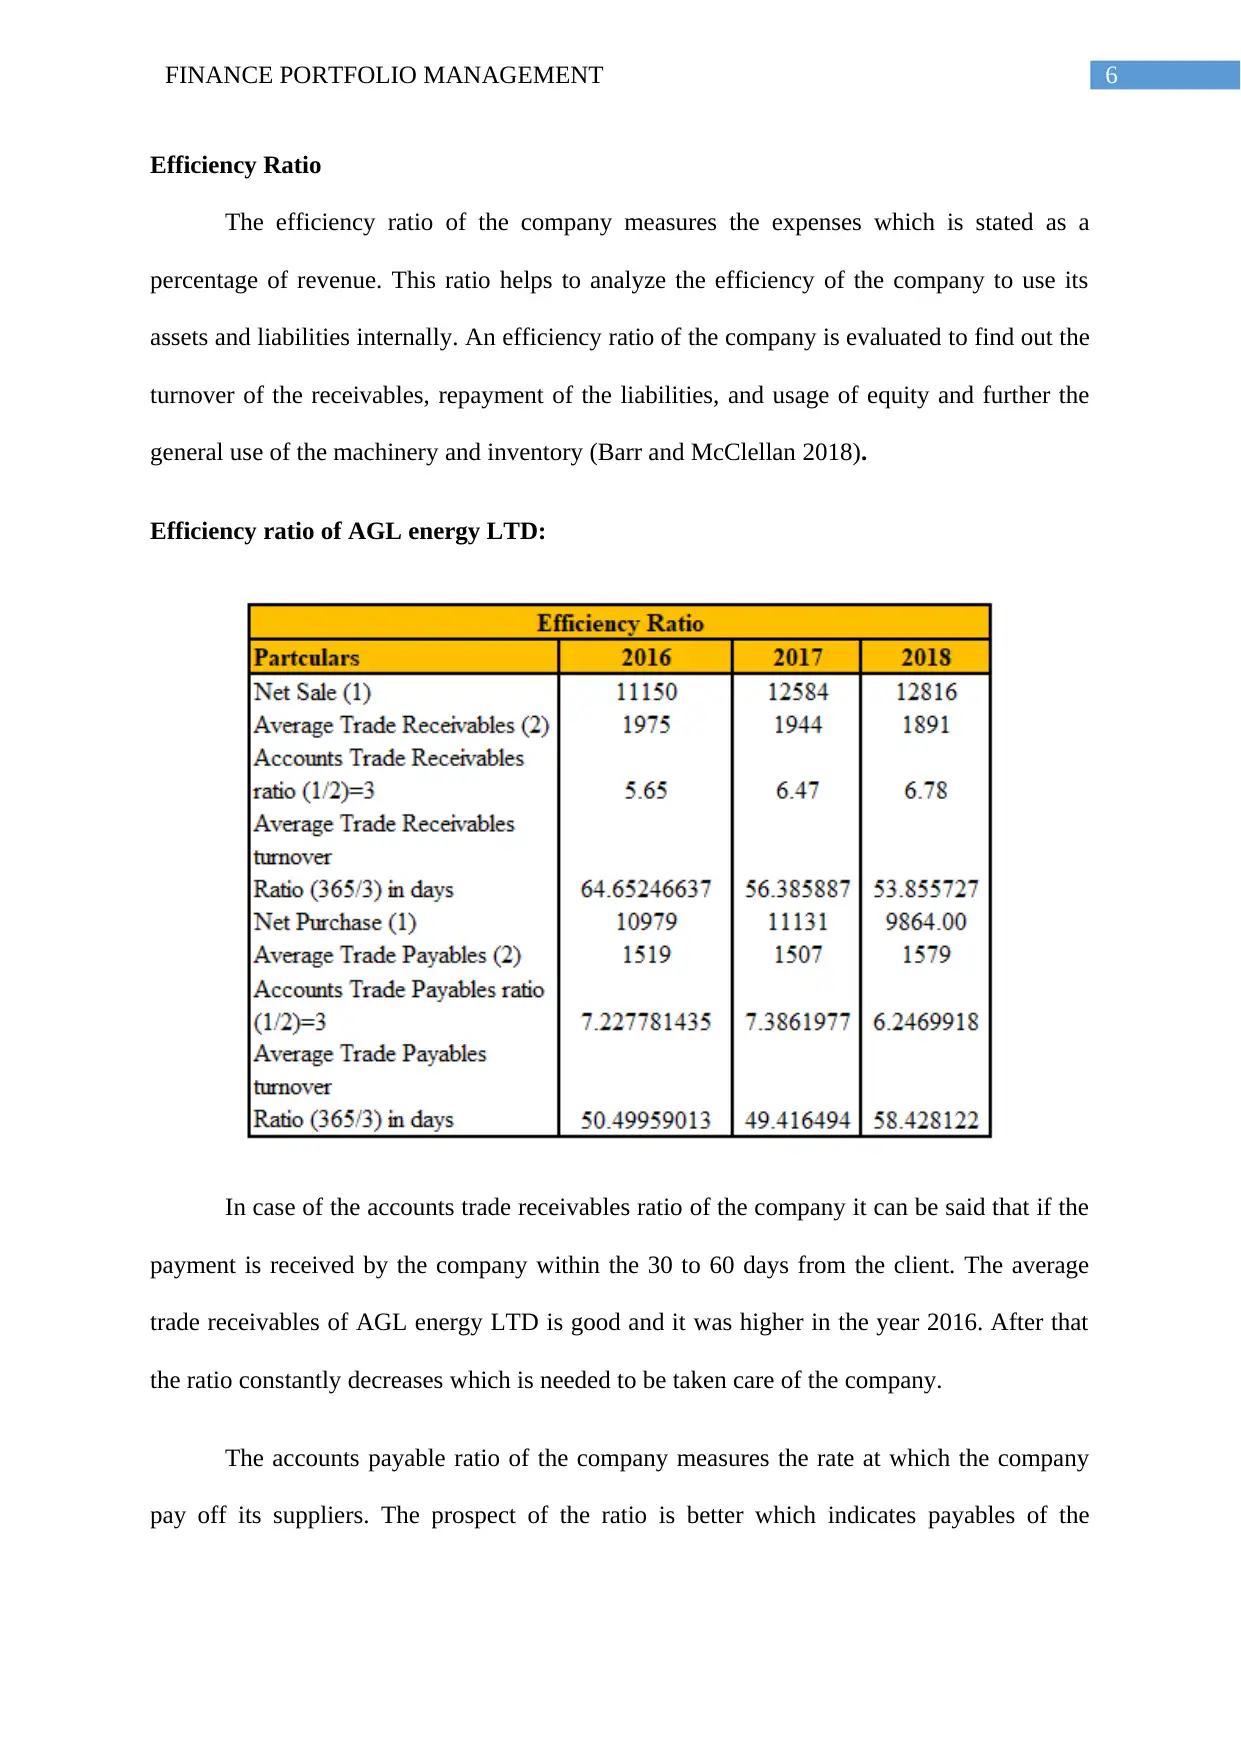
Efficiency ratio of AGL energy LTD:
In case of the accounts trade receivables ratio of the company it can be said that if the
payment is received by the company within the 30 to 60 days from the client. The average
trade receivables of AGL energy LTD is good and it was higher in the year 2016. After that
the ratio constantly decreases which is needed to be taken care of the company.
The accounts payable ratio of the company measures the rate at which the company
pay off its suppliers. The prospect of the ratio is better which indicates payables of the
Efficiency Ratio
The efficiency ratio of the company measures the expenses which is stated as a
percentage of revenue. This ratio helps to analyze the efficiency of the company to use its
assets and liabilities internally. An efficiency ratio of the company is evaluated to find out the
turnover of the receivables, repayment of the liabilities, and usage of equity and further the
general use of the machinery and inventory (Barr and McClellan 2018).
Efficiency ratio of AGL energy LTD:
In case of the accounts trade receivables ratio of the company it can be said that if the
payment is received by the company within the 30 to 60 days from the client. The average
trade receivables of AGL energy LTD is good and it was higher in the year 2016. After that
the ratio constantly decreases which is needed to be taken care of the company.
The accounts payable ratio of the company measures the rate at which the company
pay off its suppliers. The prospect of the ratio is better which indicates payables of the
Paraphrase This Document
Need a fresh take? Get an instant paraphrase of this document with our AI Paraphraser
7FINANCE PORTFOLIO MANAGEMENT
company to its suppliers is good. From the above evaluation of the ratio it can be said that
accounts payable ratio is satisfactory (Shoup 2017).
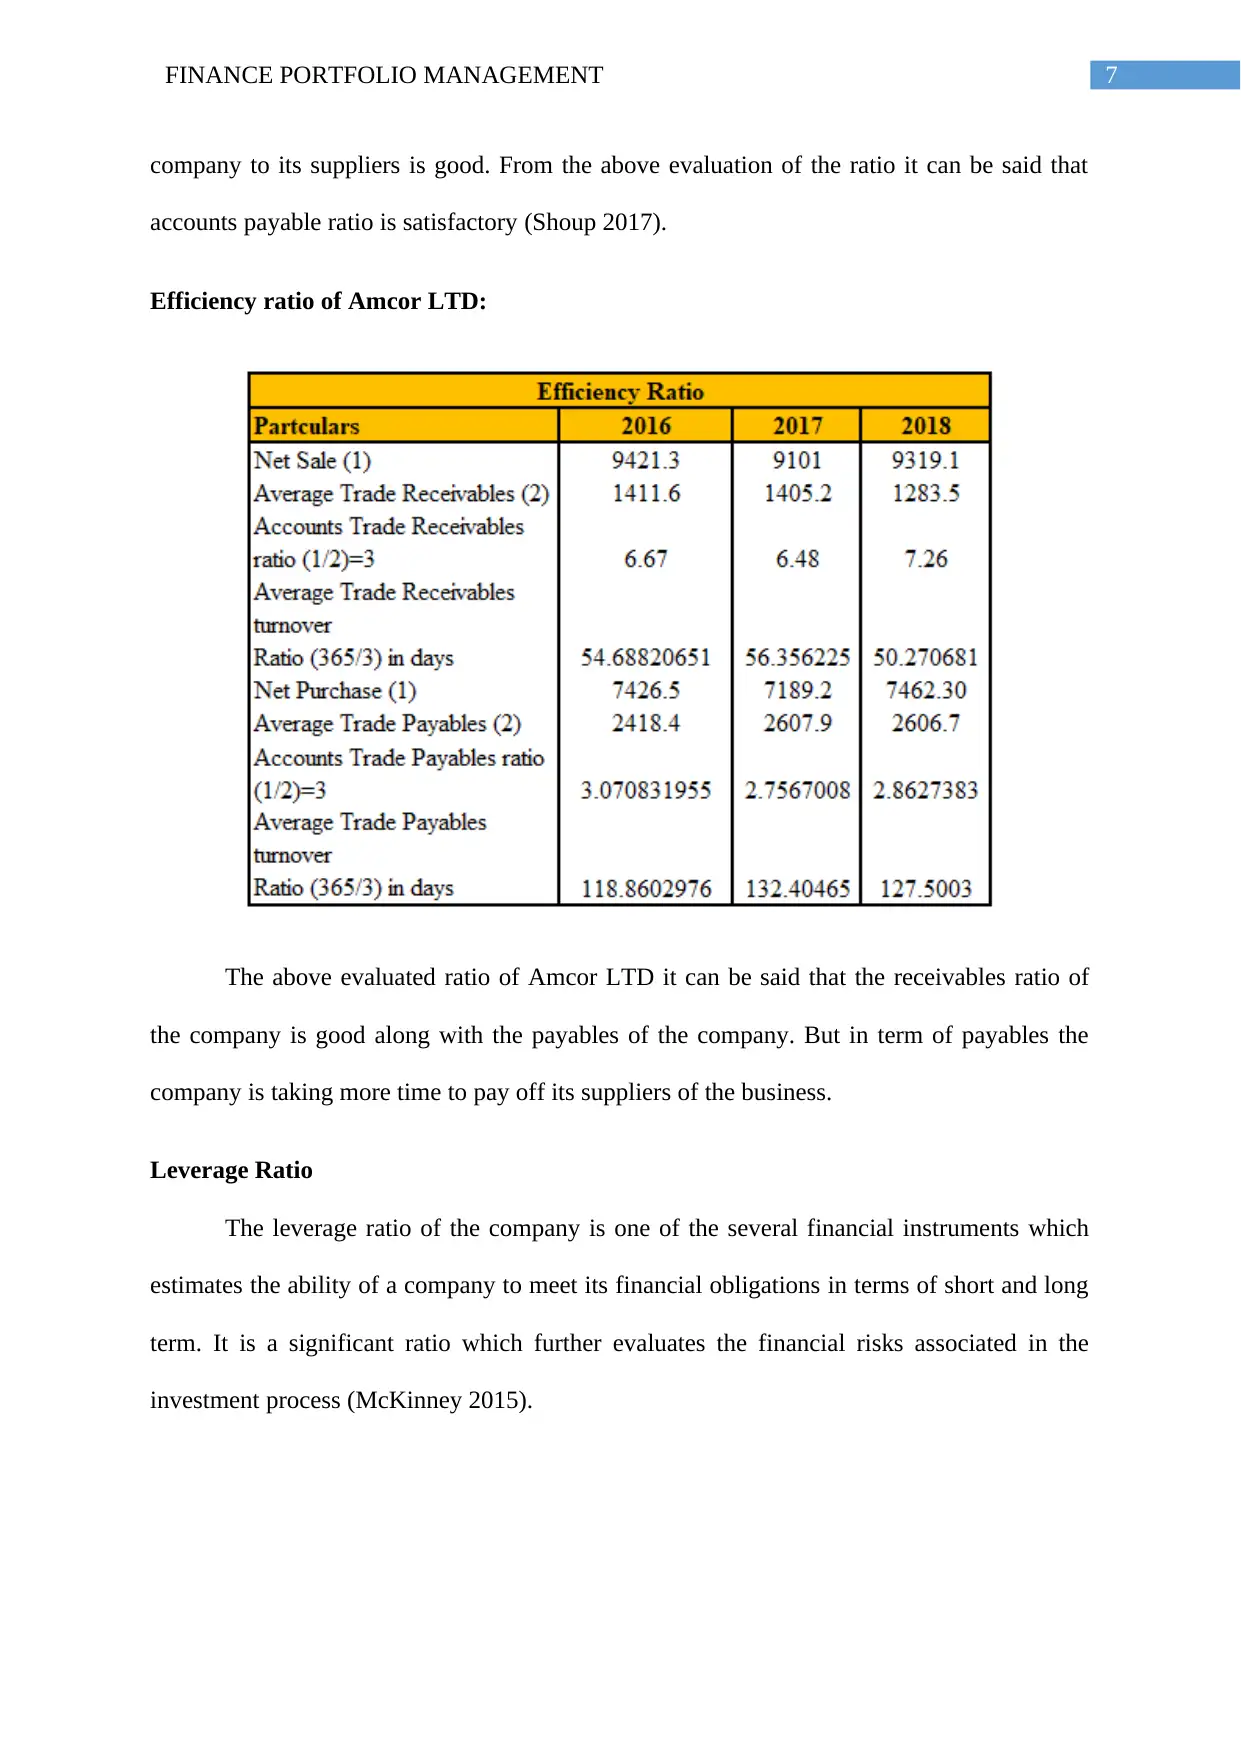
Efficiency ratio of Amcor LTD:
The above evaluated ratio of Amcor LTD it can be said that the receivables ratio of
the company is good along with the payables of the company. But in term of payables the
company is taking more time to pay off its suppliers of the business.
Leverage Ratio
The leverage ratio of the company is one of the several financial instruments which
estimates the ability of a company to meet its financial obligations in terms of short and long
term. It is a significant ratio which further evaluates the financial risks associated in the
investment process (McKinney 2015).
company to its suppliers is good. From the above evaluation of the ratio it can be said that
accounts payable ratio is satisfactory (Shoup 2017).
Efficiency ratio of Amcor LTD:
The above evaluated ratio of Amcor LTD it can be said that the receivables ratio of
the company is good along with the payables of the company. But in term of payables the
company is taking more time to pay off its suppliers of the business.
Leverage Ratio
The leverage ratio of the company is one of the several financial instruments which
estimates the ability of a company to meet its financial obligations in terms of short and long
term. It is a significant ratio which further evaluates the financial risks associated in the
investment process (McKinney 2015).
8FINANCE PORTFOLIO MANAGEMENT
Leverage Ratio of AGL energy LTD:
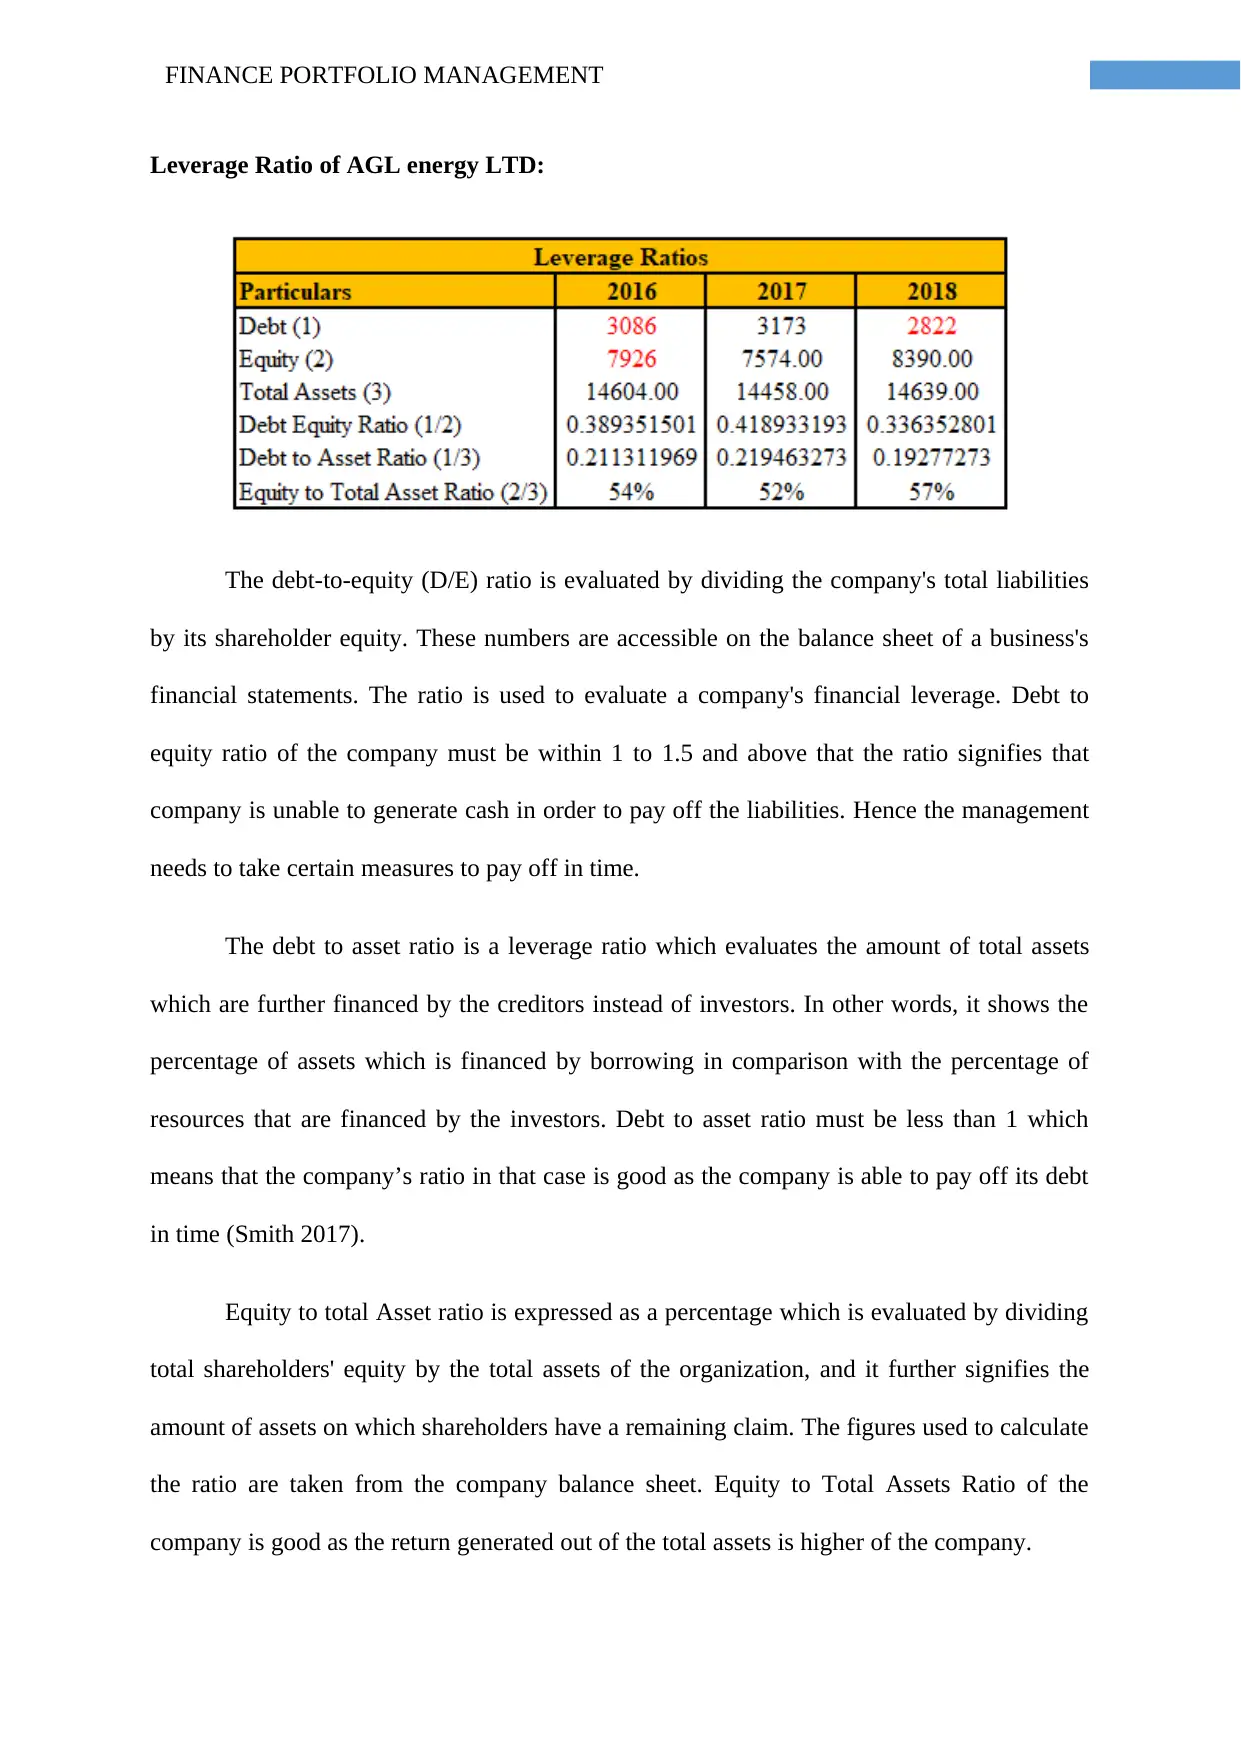
The debt-to-equity (D/E) ratio is evaluated by dividing the company's total liabilities
by its shareholder equity. These numbers are accessible on the balance sheet of a business's
financial statements. The ratio is used to evaluate a company's financial leverage. Debt to
equity ratio of the company must be within 1 to 1.5 and above that the ratio signifies that
company is unable to generate cash in order to pay off the liabilities. Hence the management
needs to take certain measures to pay off in time.
The debt to asset ratio is a leverage ratio which evaluates the amount of total assets
which are further financed by the creditors instead of investors. In other words, it shows the
percentage of assets which is financed by borrowing in comparison with the percentage of
resources that are financed by the investors. Debt to asset ratio must be less than 1 which
means that the company’s ratio in that case is good as the company is able to pay off its debt
in time (Smith 2017).
Equity to total Asset ratio is expressed as a percentage which is evaluated by dividing
total shareholders' equity by the total assets of the organization, and it further signifies the
amount of assets on which shareholders have a remaining claim. The figures used to calculate
the ratio are taken from the company balance sheet. Equity to Total Assets Ratio of the
company is good as the return generated out of the total assets is higher of the company.
Leverage Ratio of AGL energy LTD:
The debt-to-equity (D/E) ratio is evaluated by dividing the company's total liabilities
by its shareholder equity. These numbers are accessible on the balance sheet of a business's
financial statements. The ratio is used to evaluate a company's financial leverage. Debt to
equity ratio of the company must be within 1 to 1.5 and above that the ratio signifies that
company is unable to generate cash in order to pay off the liabilities. Hence the management
needs to take certain measures to pay off in time.
The debt to asset ratio is a leverage ratio which evaluates the amount of total assets
which are further financed by the creditors instead of investors. In other words, it shows the
percentage of assets which is financed by borrowing in comparison with the percentage of
resources that are financed by the investors. Debt to asset ratio must be less than 1 which
means that the company’s ratio in that case is good as the company is able to pay off its debt
in time (Smith 2017).
Equity to total Asset ratio is expressed as a percentage which is evaluated by dividing
total shareholders' equity by the total assets of the organization, and it further signifies the
amount of assets on which shareholders have a remaining claim. The figures used to calculate
the ratio are taken from the company balance sheet. Equity to Total Assets Ratio of the
company is good as the return generated out of the total assets is higher of the company.
⊘ This is a preview!⊘
Do you want full access?
Subscribe today to unlock all pages.
Trusted by 1+ million students worldwide
9FINANCE PORTFOLIO MANAGEMENT
Leverage Ratio of Amcor LTD:
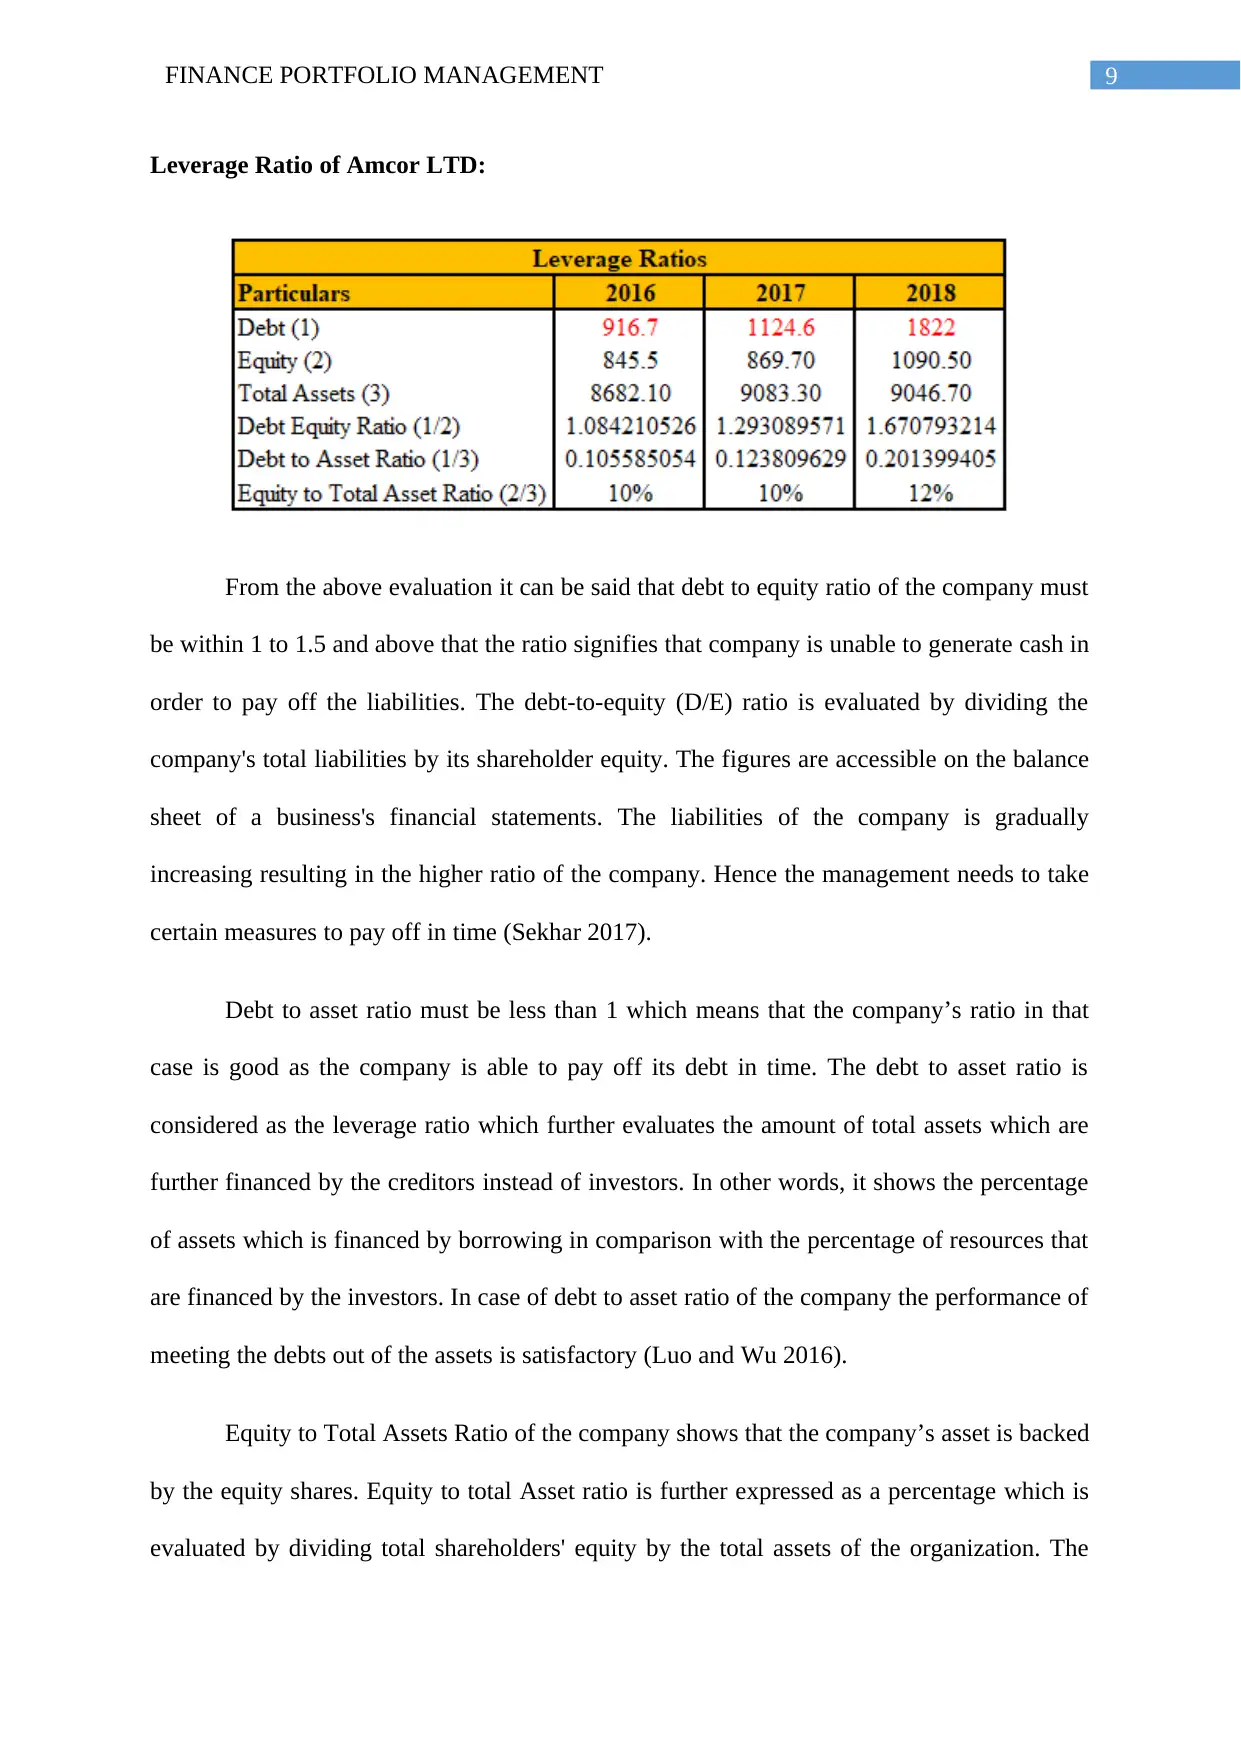
From the above evaluation it can be said that debt to equity ratio of the company must
be within 1 to 1.5 and above that the ratio signifies that company is unable to generate cash in
order to pay off the liabilities. The debt-to-equity (D/E) ratio is evaluated by dividing the
company's total liabilities by its shareholder equity. The figures are accessible on the balance
sheet of a business's financial statements. The liabilities of the company is gradually
increasing resulting in the higher ratio of the company. Hence the management needs to take
certain measures to pay off in time (Sekhar 2017).
Debt to asset ratio must be less than 1 which means that the company’s ratio in that
case is good as the company is able to pay off its debt in time. The debt to asset ratio is
considered as the leverage ratio which further evaluates the amount of total assets which are
further financed by the creditors instead of investors. In other words, it shows the percentage
of assets which is financed by borrowing in comparison with the percentage of resources that
are financed by the investors. In case of debt to asset ratio of the company the performance of
meeting the debts out of the assets is satisfactory (Luo and Wu 2016).
Equity to Total Assets Ratio of the company shows that the company’s asset is backed
by the equity shares. Equity to total Asset ratio is further expressed as a percentage which is
evaluated by dividing total shareholders' equity by the total assets of the organization. The
Leverage Ratio of Amcor LTD:
From the above evaluation it can be said that debt to equity ratio of the company must
be within 1 to 1.5 and above that the ratio signifies that company is unable to generate cash in
order to pay off the liabilities. The debt-to-equity (D/E) ratio is evaluated by dividing the
company's total liabilities by its shareholder equity. The figures are accessible on the balance
sheet of a business's financial statements. The liabilities of the company is gradually
increasing resulting in the higher ratio of the company. Hence the management needs to take
certain measures to pay off in time (Sekhar 2017).
Debt to asset ratio must be less than 1 which means that the company’s ratio in that
case is good as the company is able to pay off its debt in time. The debt to asset ratio is
considered as the leverage ratio which further evaluates the amount of total assets which are
further financed by the creditors instead of investors. In other words, it shows the percentage
of assets which is financed by borrowing in comparison with the percentage of resources that
are financed by the investors. In case of debt to asset ratio of the company the performance of
meeting the debts out of the assets is satisfactory (Luo and Wu 2016).
Equity to Total Assets Ratio of the company shows that the company’s asset is backed
by the equity shares. Equity to total Asset ratio is further expressed as a percentage which is
evaluated by dividing total shareholders' equity by the total assets of the organization. The
Paraphrase This Document
Need a fresh take? Get an instant paraphrase of this document with our AI Paraphraser
10FINANCE PORTFOLIO MANAGEMENT
ratio further signifies the amount of assets on which shareholders have a remaining claim.
The performance of the company as per the analysis is good in that case (Renz 2016).
Profitability Ratio
The profitability ratio of the company measures the profitability position of the
company in terms of the returns generated out of the revenue utilized by considering the cost
of sales of the company (Libby 2017).
Profitability Ratio of AGL energy LTD:
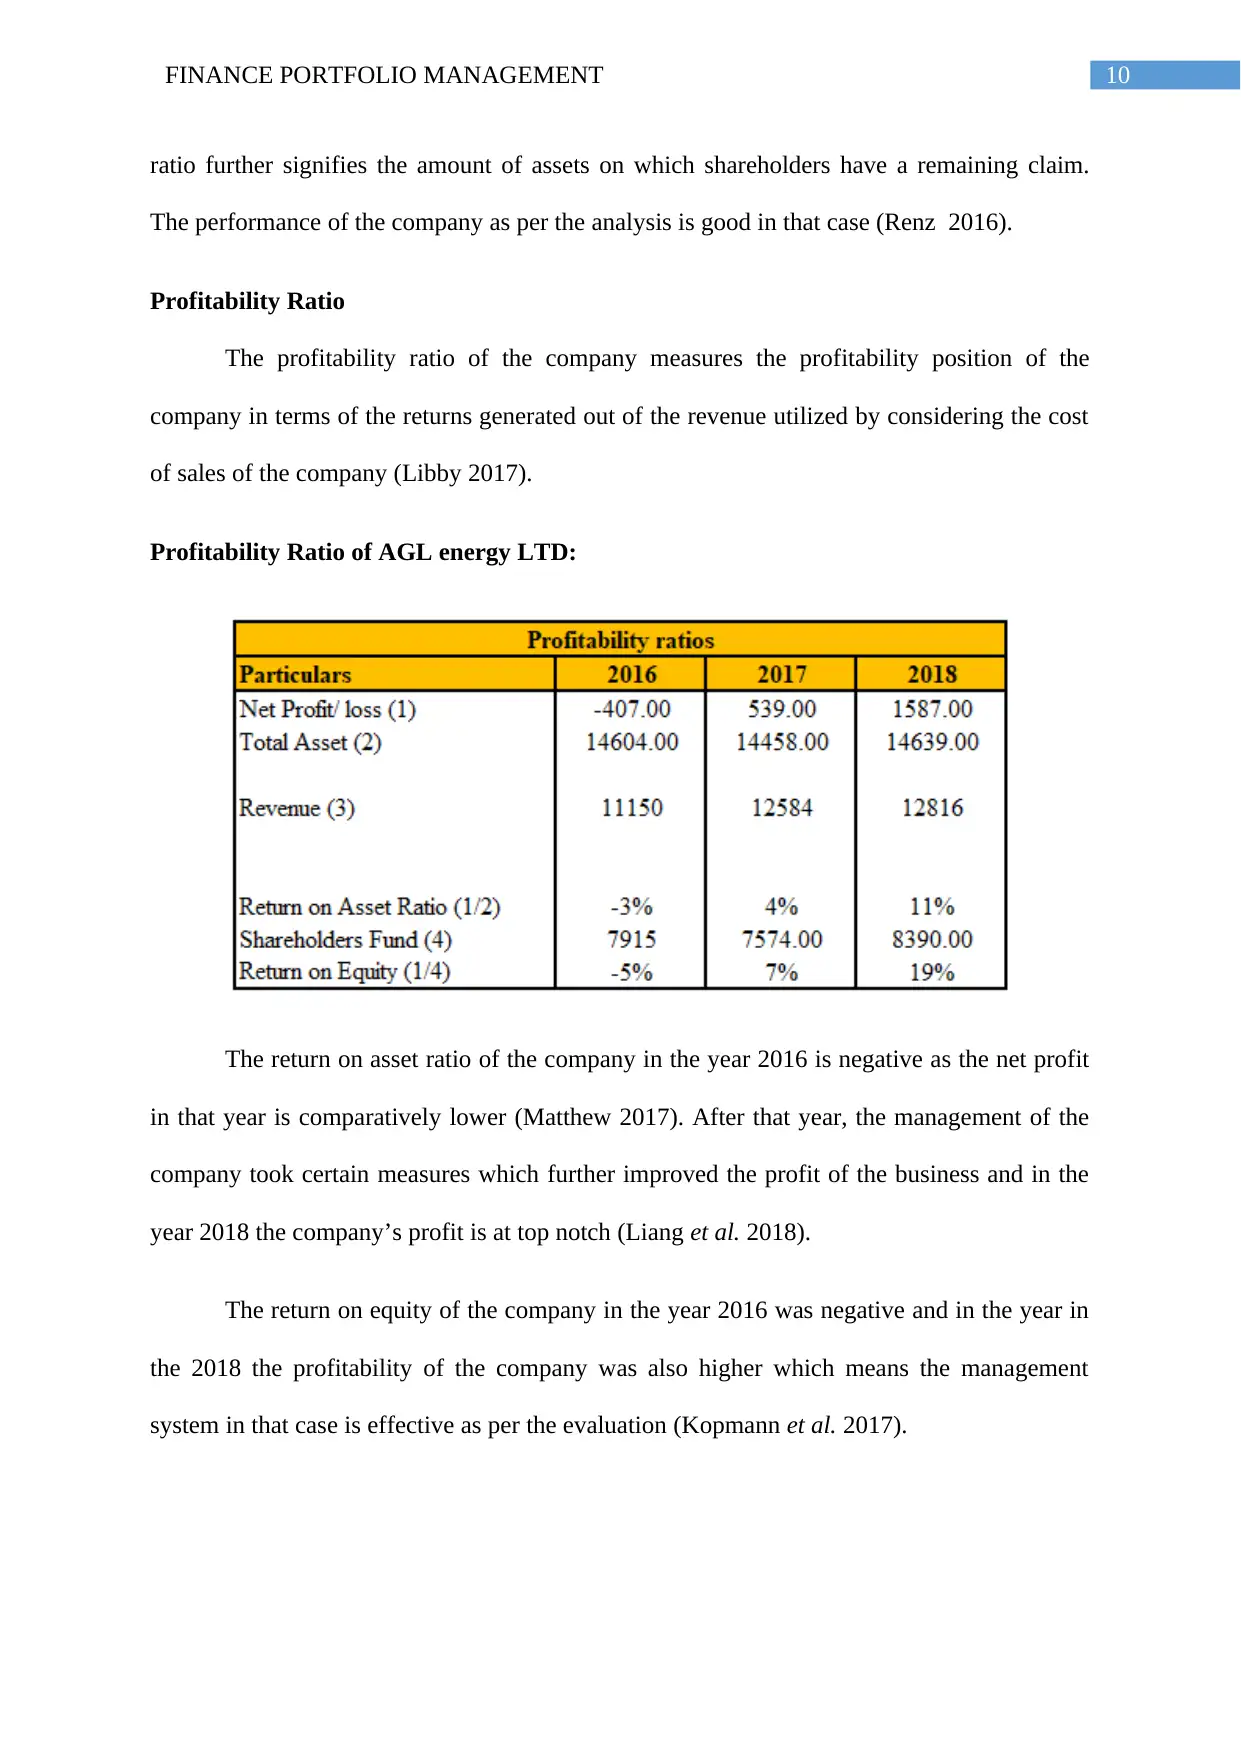
The return on asset ratio of the company in the year 2016 is negative as the net profit
in that year is comparatively lower (Matthew 2017). After that year, the management of the
company took certain measures which further improved the profit of the business and in the
year 2018 the company’s profit is at top notch (Liang et al. 2018).
The return on equity of the company in the year 2016 was negative and in the year in
the 2018 the profitability of the company was also higher which means the management
system in that case is effective as per the evaluation (Kopmann et al. 2017).
ratio further signifies the amount of assets on which shareholders have a remaining claim.
The performance of the company as per the analysis is good in that case (Renz 2016).
Profitability Ratio
The profitability ratio of the company measures the profitability position of the
company in terms of the returns generated out of the revenue utilized by considering the cost
of sales of the company (Libby 2017).
Profitability Ratio of AGL energy LTD:
The return on asset ratio of the company in the year 2016 is negative as the net profit
in that year is comparatively lower (Matthew 2017). After that year, the management of the
company took certain measures which further improved the profit of the business and in the
year 2018 the company’s profit is at top notch (Liang et al. 2018).
The return on equity of the company in the year 2016 was negative and in the year in
the 2018 the profitability of the company was also higher which means the management
system in that case is effective as per the evaluation (Kopmann et al. 2017).
11FINANCE PORTFOLIO MANAGEMENT
Profitability Ratio of Amcor LTD:
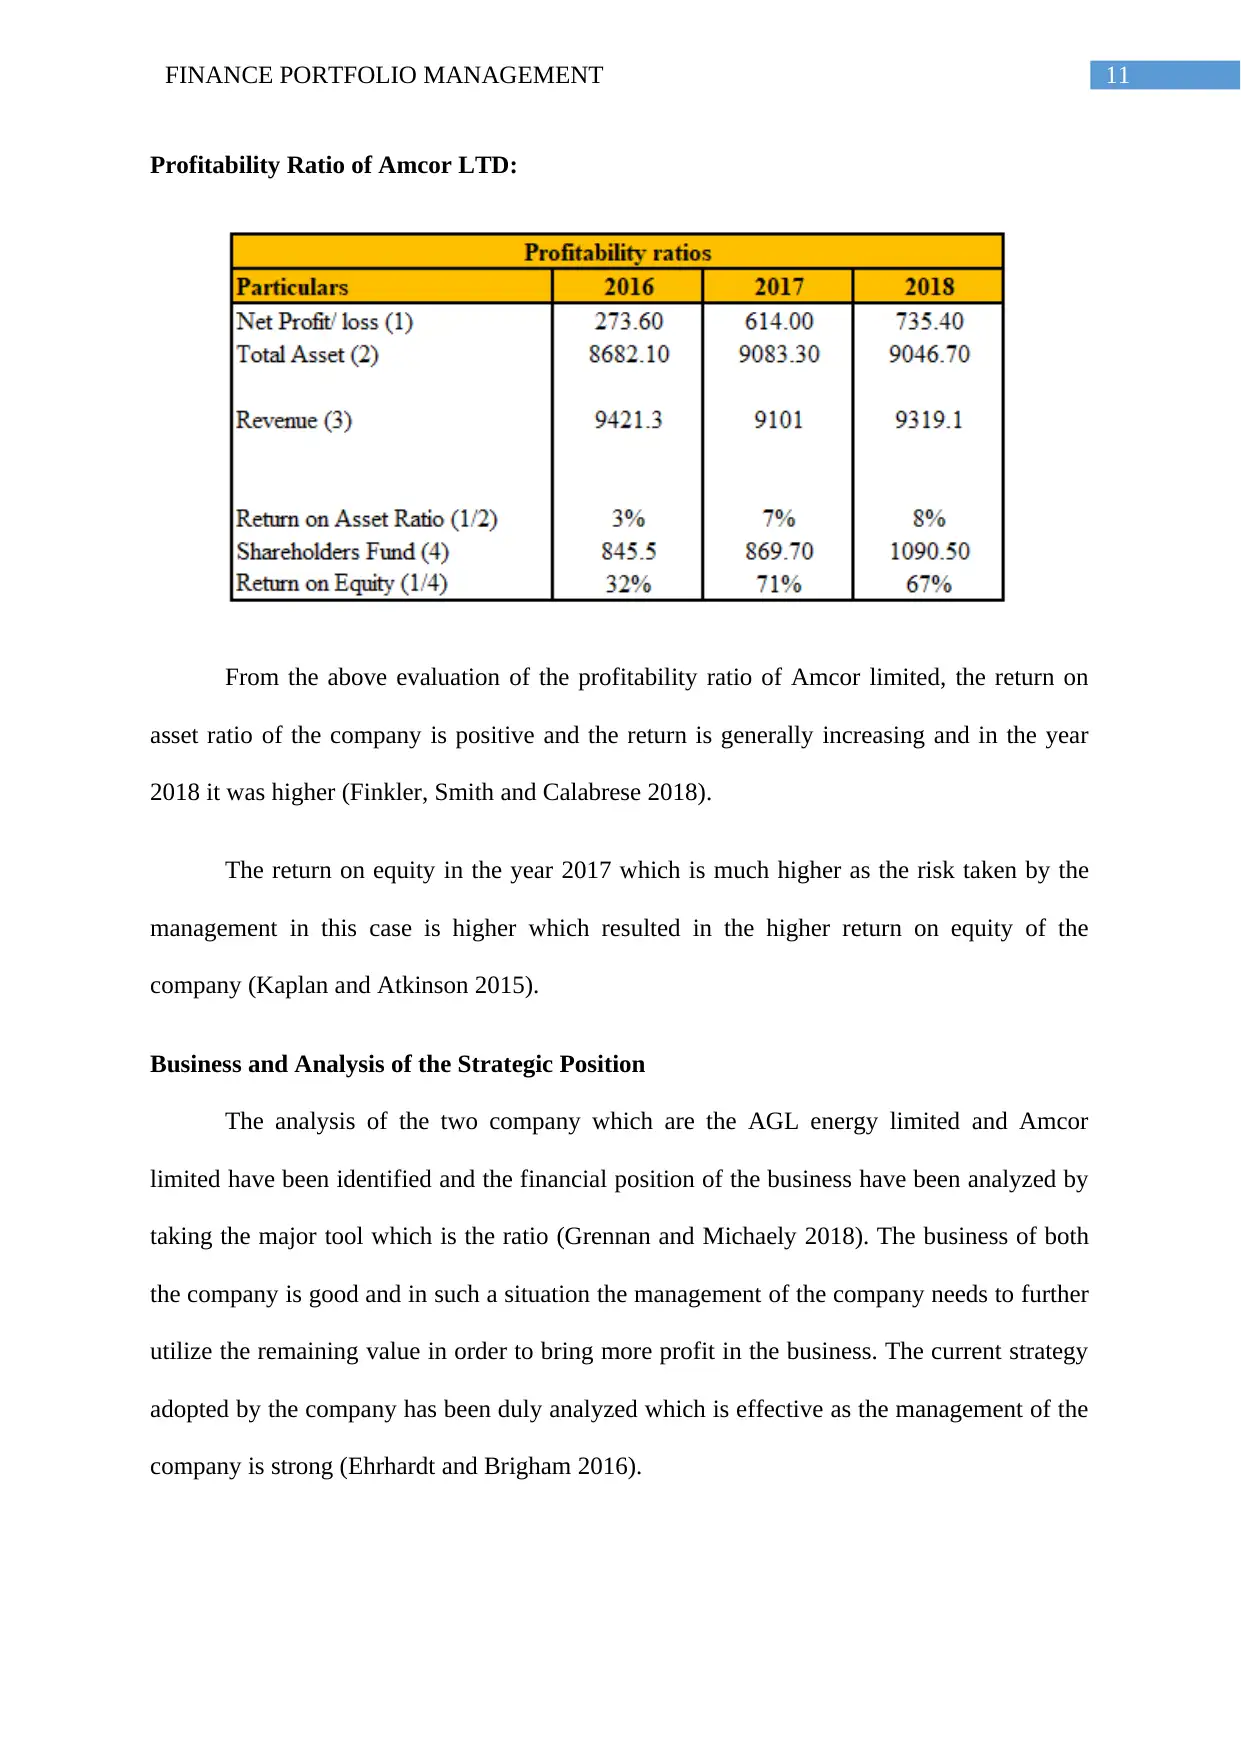
From the above evaluation of the profitability ratio of Amcor limited, the return on
asset ratio of the company is positive and the return is generally increasing and in the year
2018 it was higher (Finkler, Smith and Calabrese 2018).
The return on equity in the year 2017 which is much higher as the risk taken by the
management in this case is higher which resulted in the higher return on equity of the
company (Kaplan and Atkinson 2015).
Business and Analysis of the Strategic Position
The analysis of the two company which are the AGL energy limited and Amcor
limited have been identified and the financial position of the business have been analyzed by
taking the major tool which is the ratio (Grennan and Michaely 2018). The business of both
the company is good and in such a situation the management of the company needs to further
utilize the remaining value in order to bring more profit in the business. The current strategy
adopted by the company has been duly analyzed which is effective as the management of the
company is strong (Ehrhardt and Brigham 2016).
Profitability Ratio of Amcor LTD:
From the above evaluation of the profitability ratio of Amcor limited, the return on
asset ratio of the company is positive and the return is generally increasing and in the year
2018 it was higher (Finkler, Smith and Calabrese 2018).
The return on equity in the year 2017 which is much higher as the risk taken by the
management in this case is higher which resulted in the higher return on equity of the
company (Kaplan and Atkinson 2015).
Business and Analysis of the Strategic Position
The analysis of the two company which are the AGL energy limited and Amcor
limited have been identified and the financial position of the business have been analyzed by
taking the major tool which is the ratio (Grennan and Michaely 2018). The business of both
the company is good and in such a situation the management of the company needs to further
utilize the remaining value in order to bring more profit in the business. The current strategy
adopted by the company has been duly analyzed which is effective as the management of the
company is strong (Ehrhardt and Brigham 2016).
⊘ This is a preview!⊘
Do you want full access?
Subscribe today to unlock all pages.
Trusted by 1+ million students worldwide
1 out of 19
Related Documents


Your All-in-One AI-Powered Toolkit for Academic Success.
+13062052269
info@desklib.com
Available 24*7 on WhatsApp / Email
![[object Object]](/_next/static/media/star-bottom.7253800d.svg)
Unlock your academic potential
Copyright © 2020–2026 A2Z Services. All Rights Reserved. Developed and managed by ZUCOL.