Epeus Portfolio Management: AFCP8001 Assignment Report
VerifiedAdded on 2022/08/14
|16
|2019
|11
Report
AI Summary
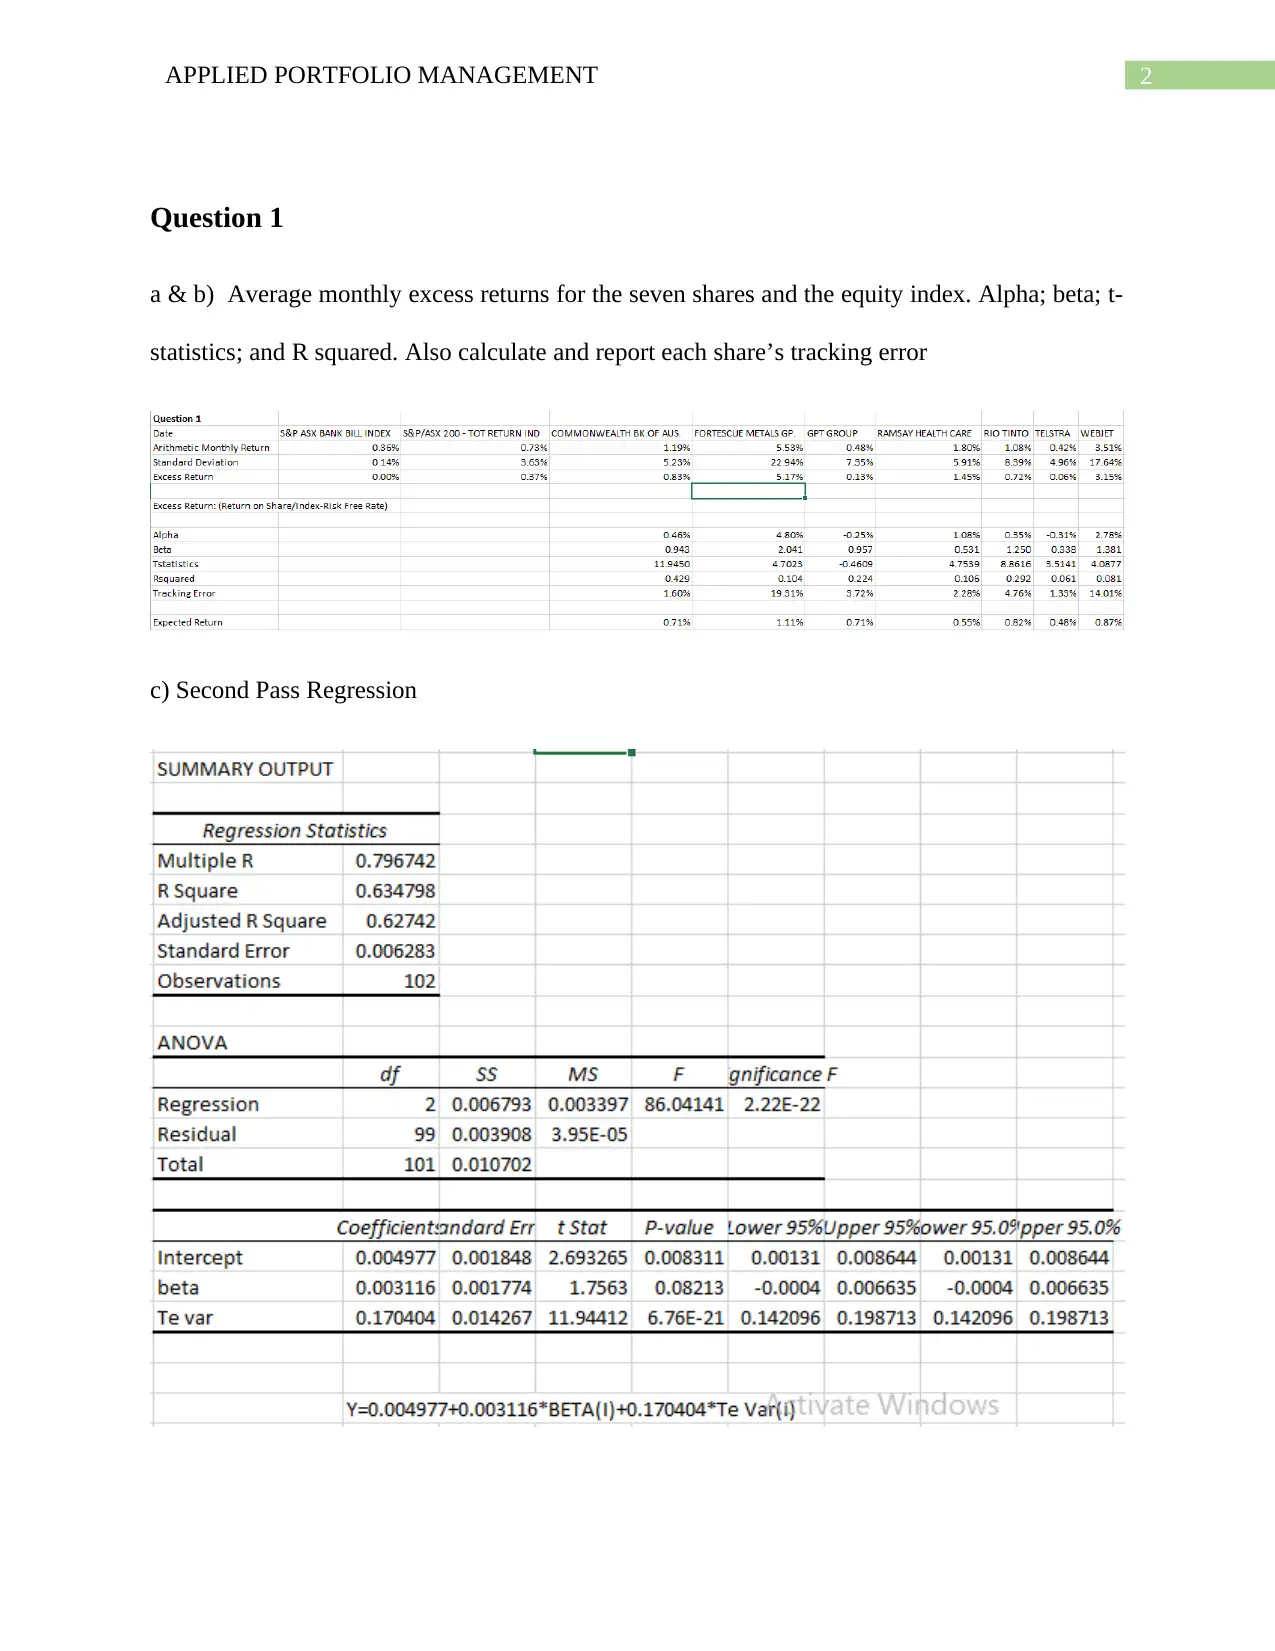
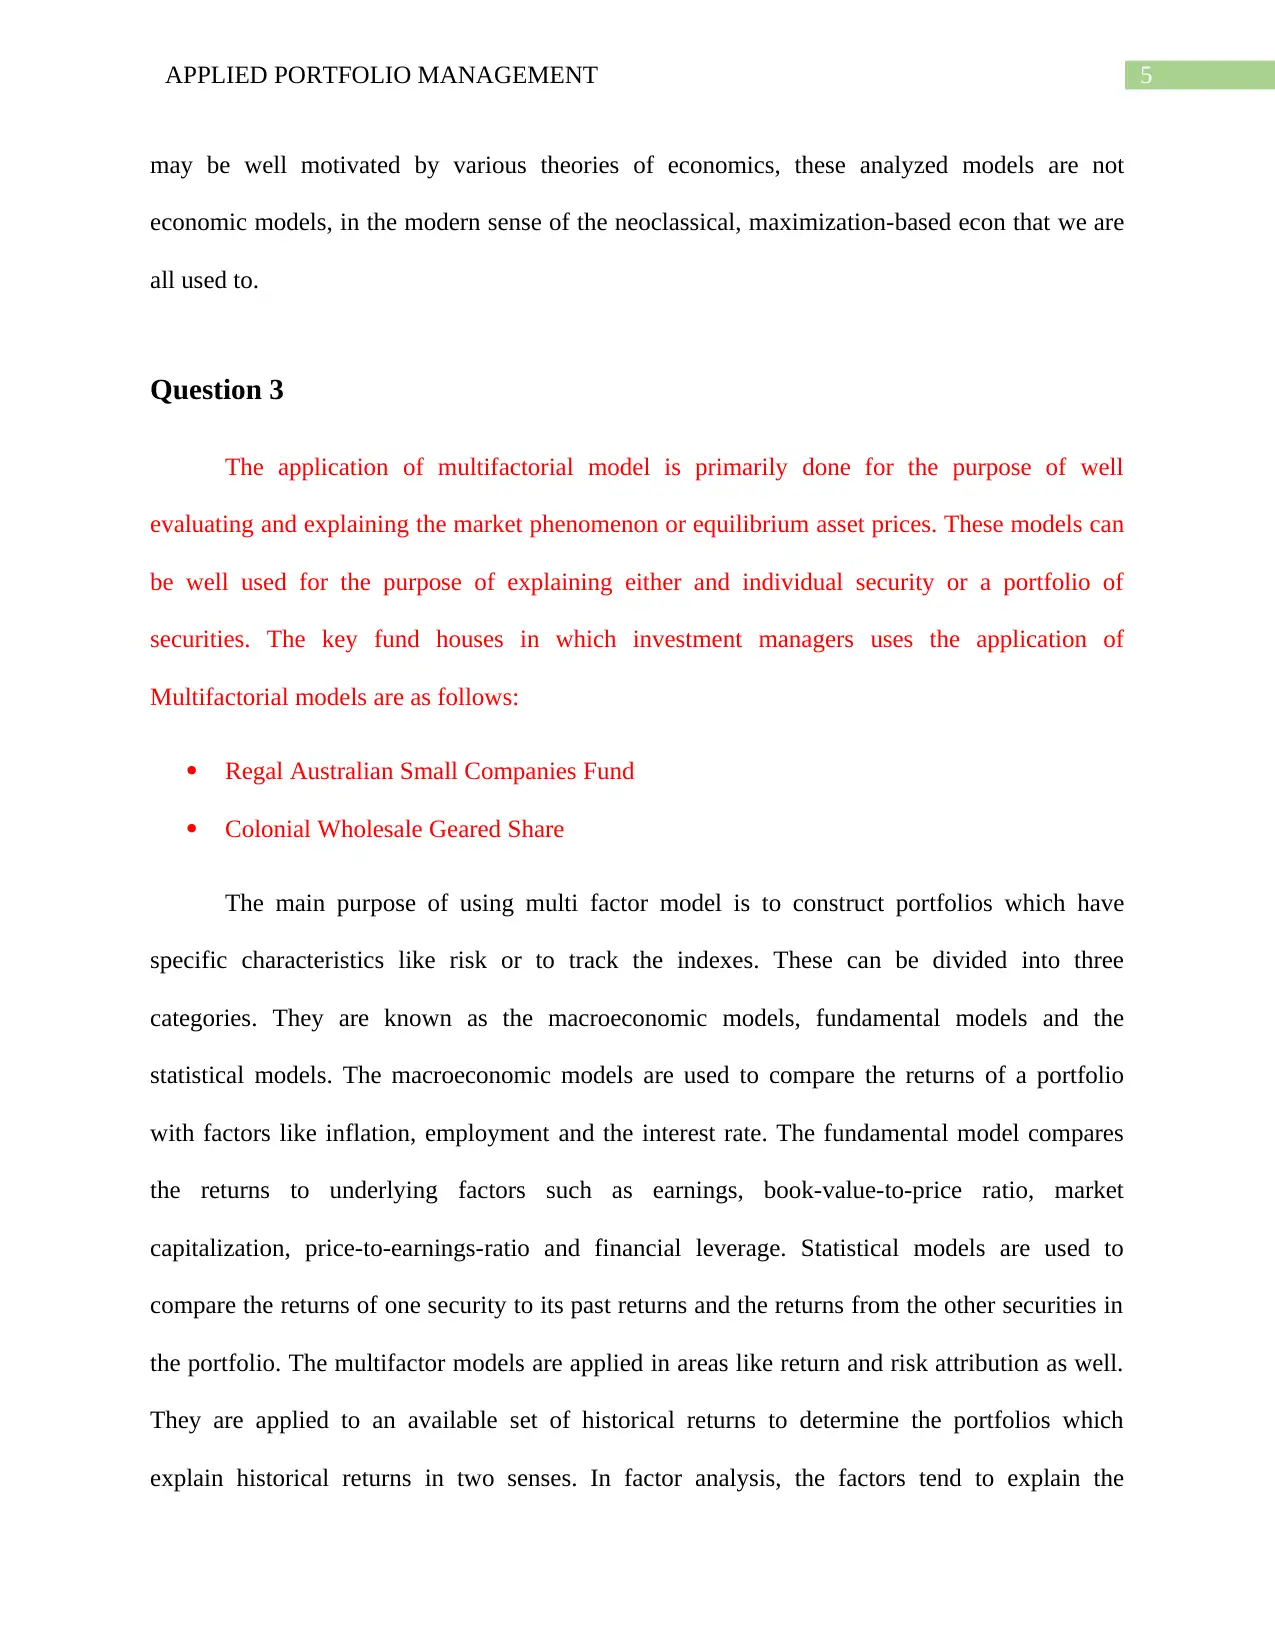
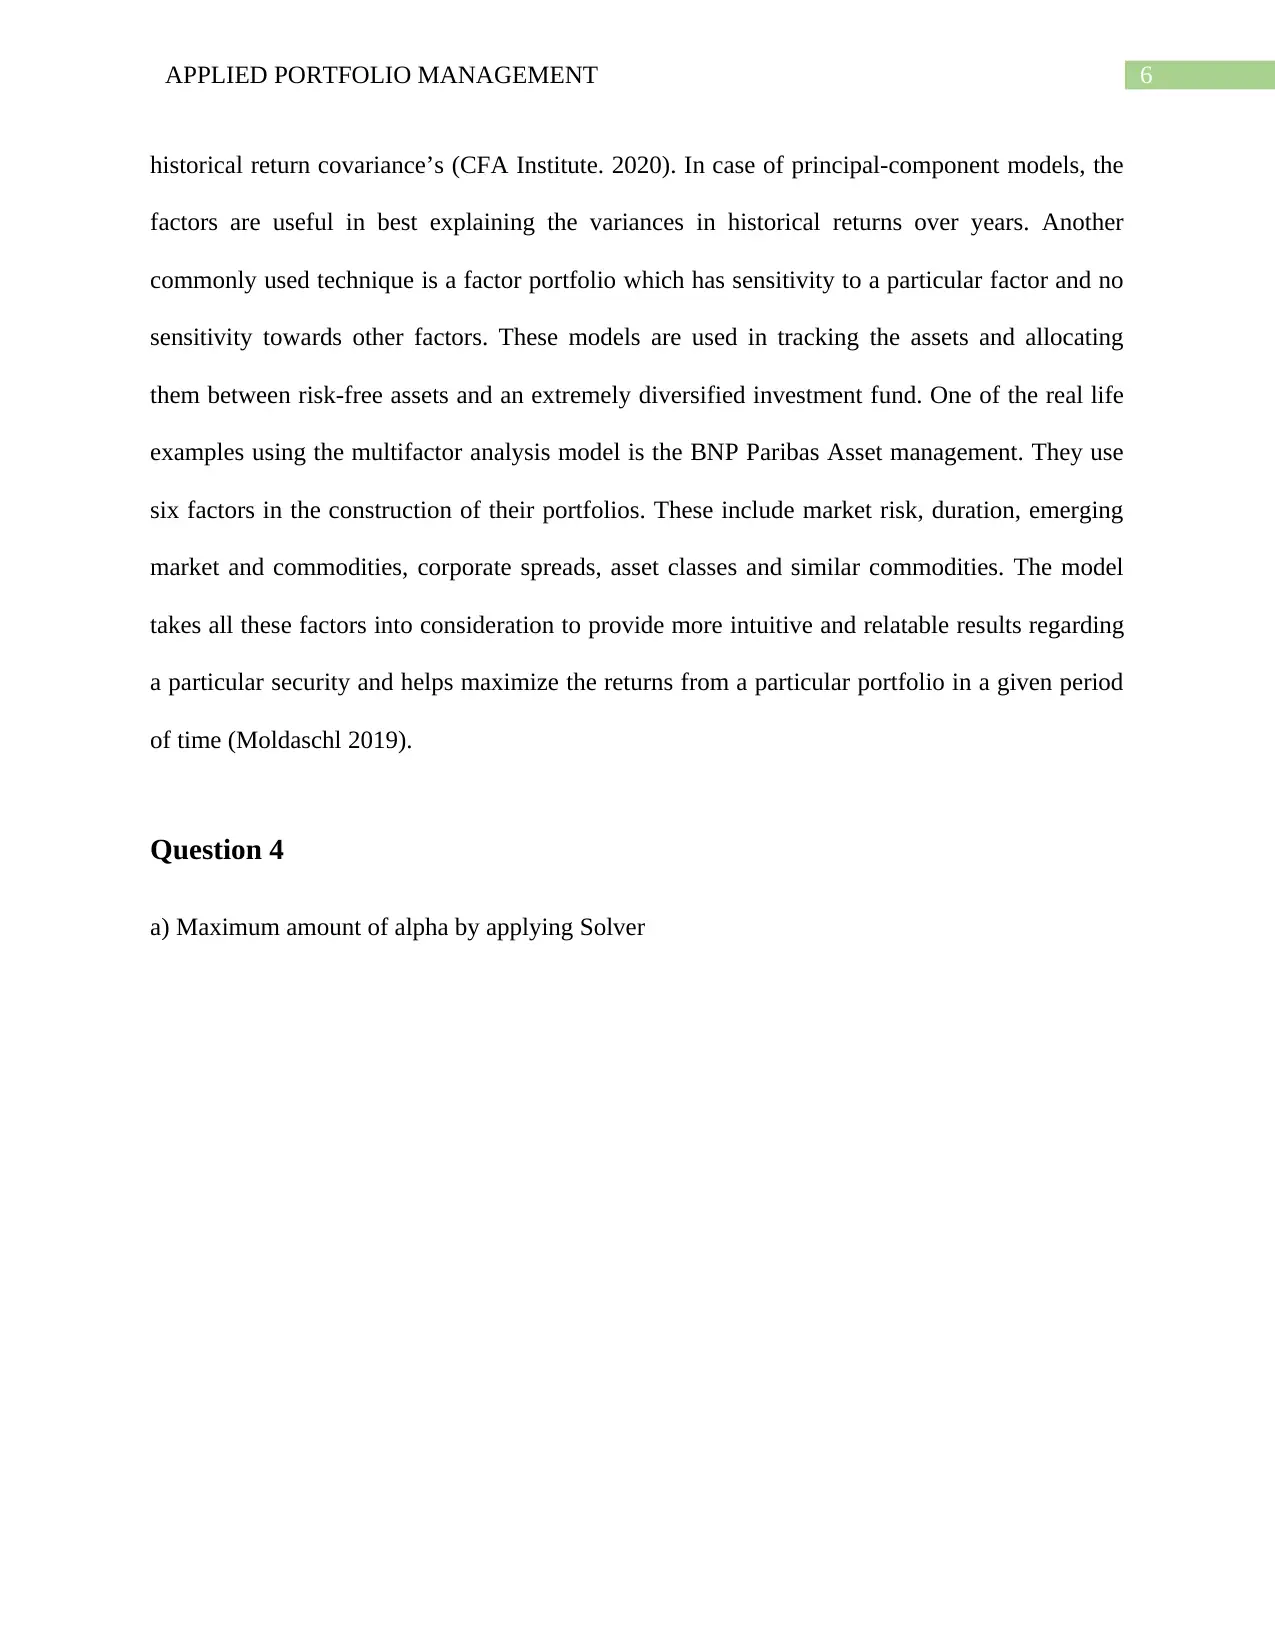
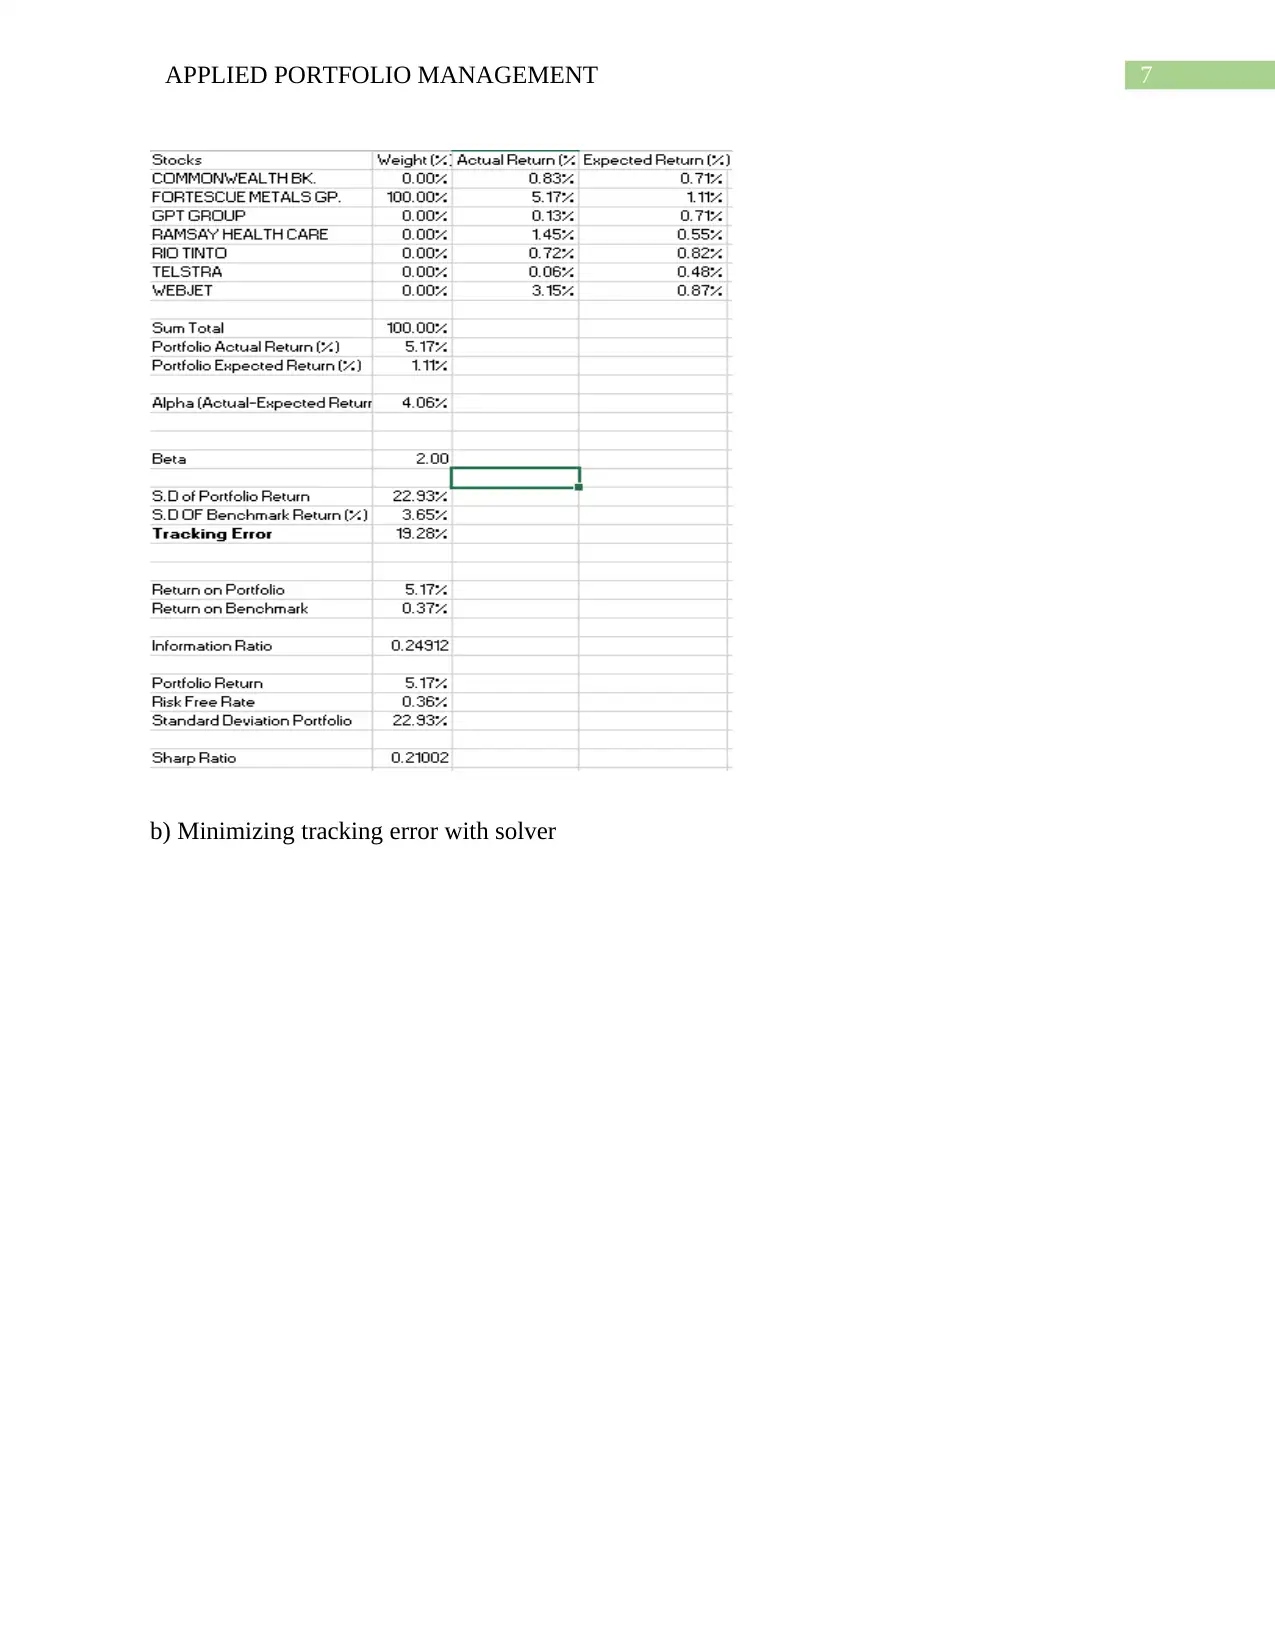
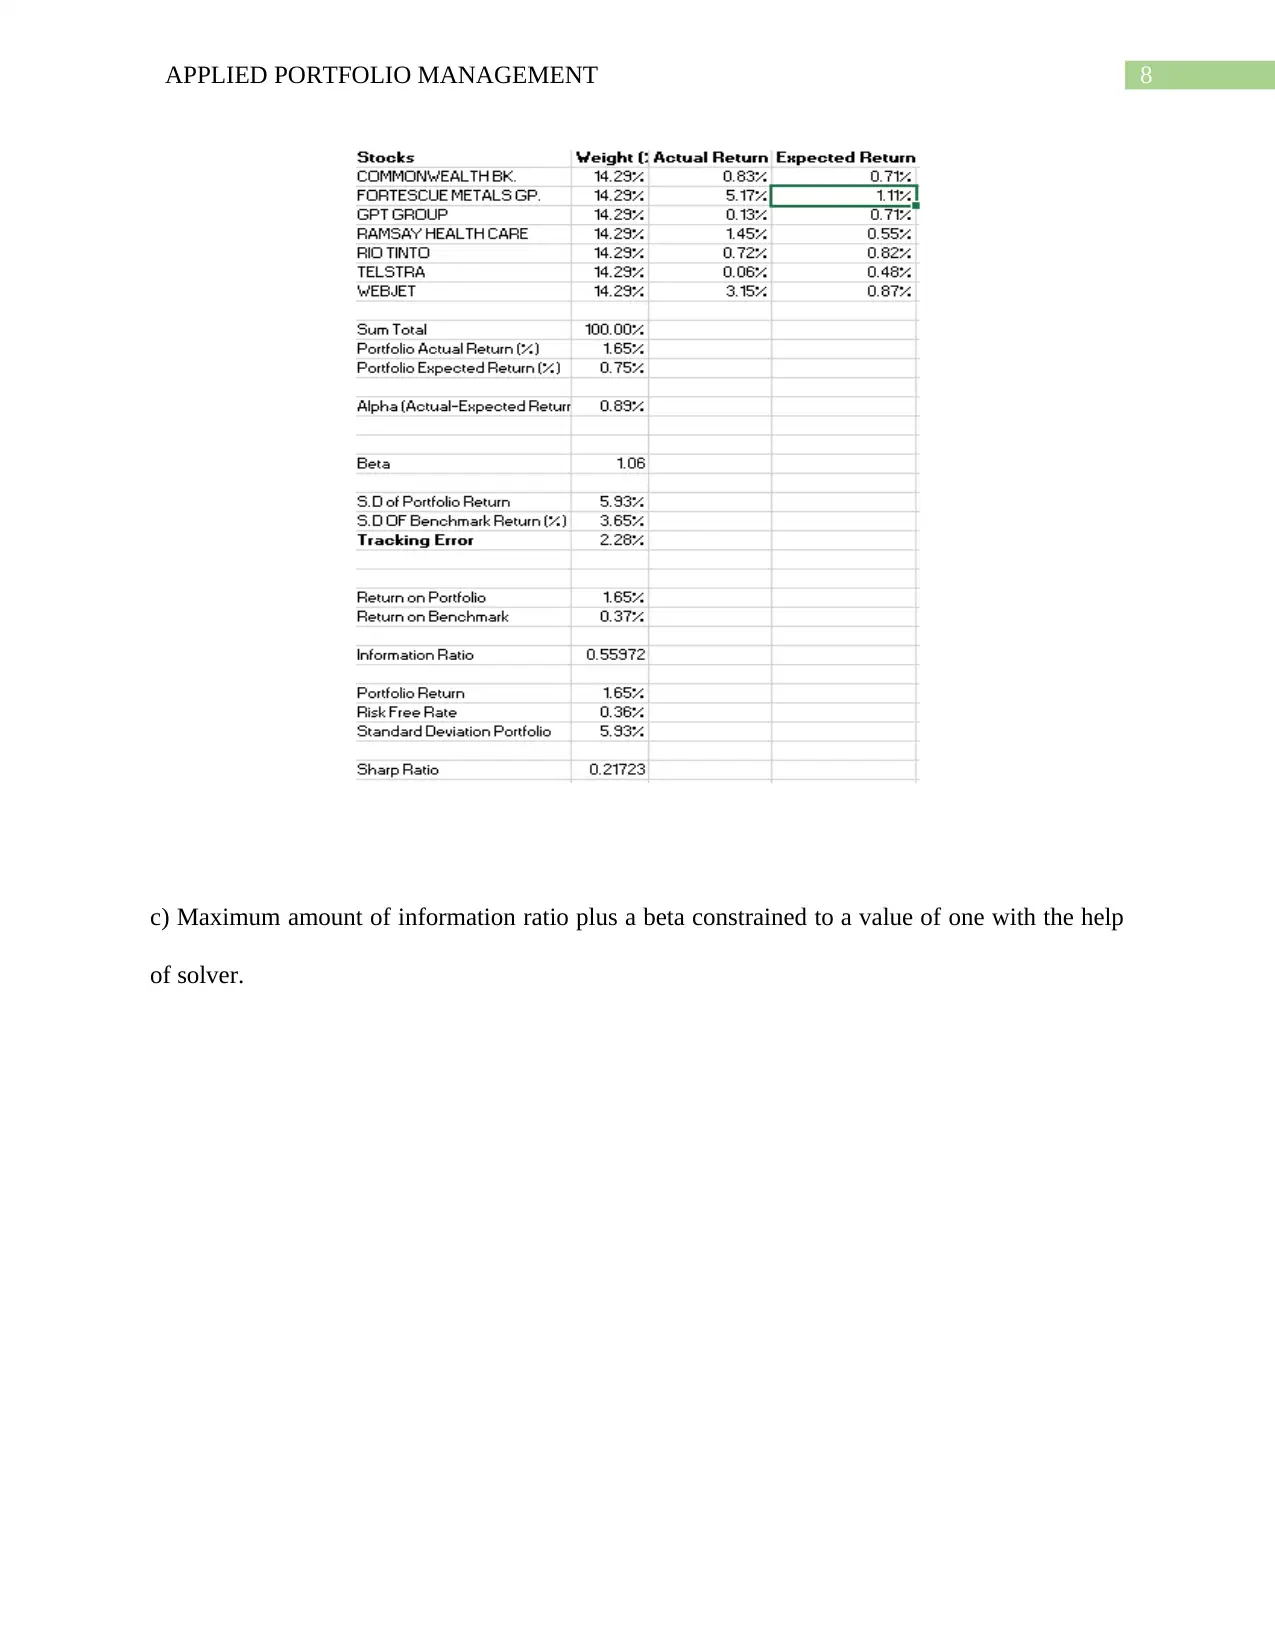
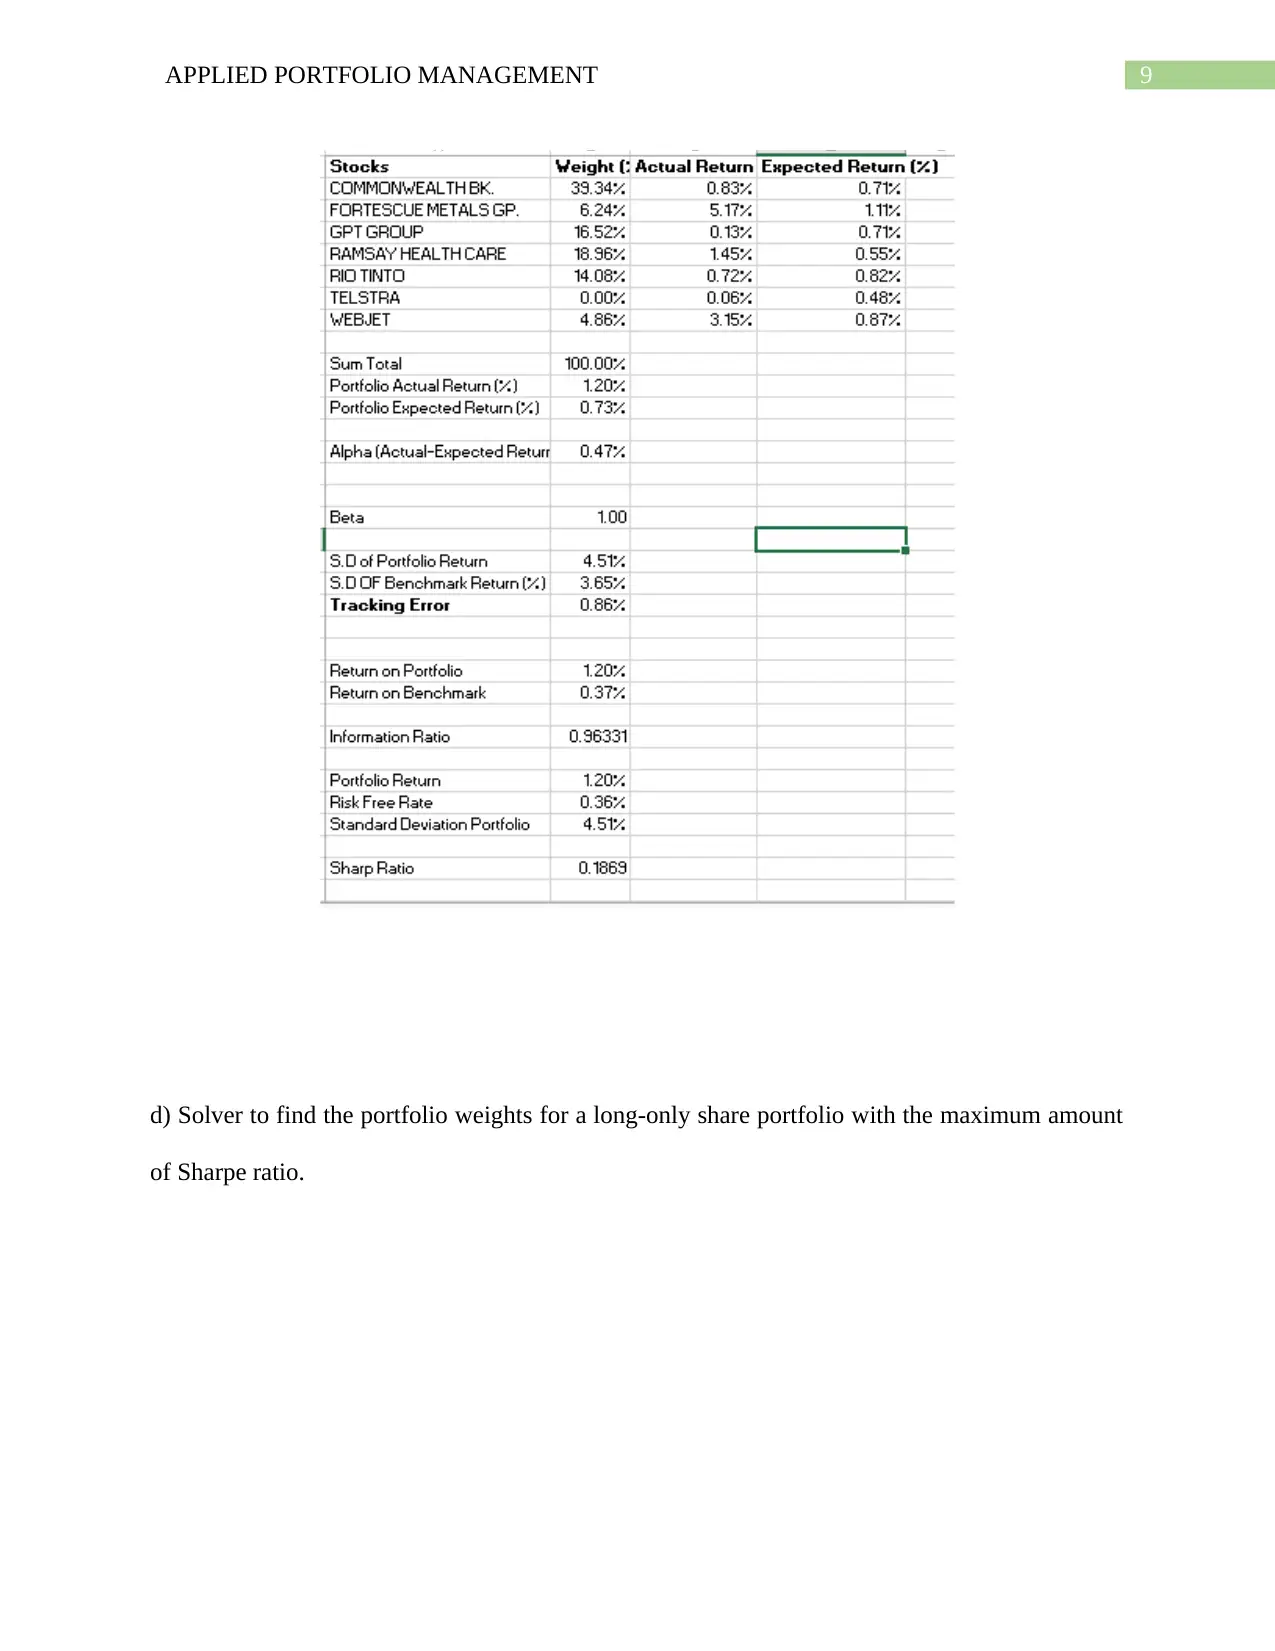
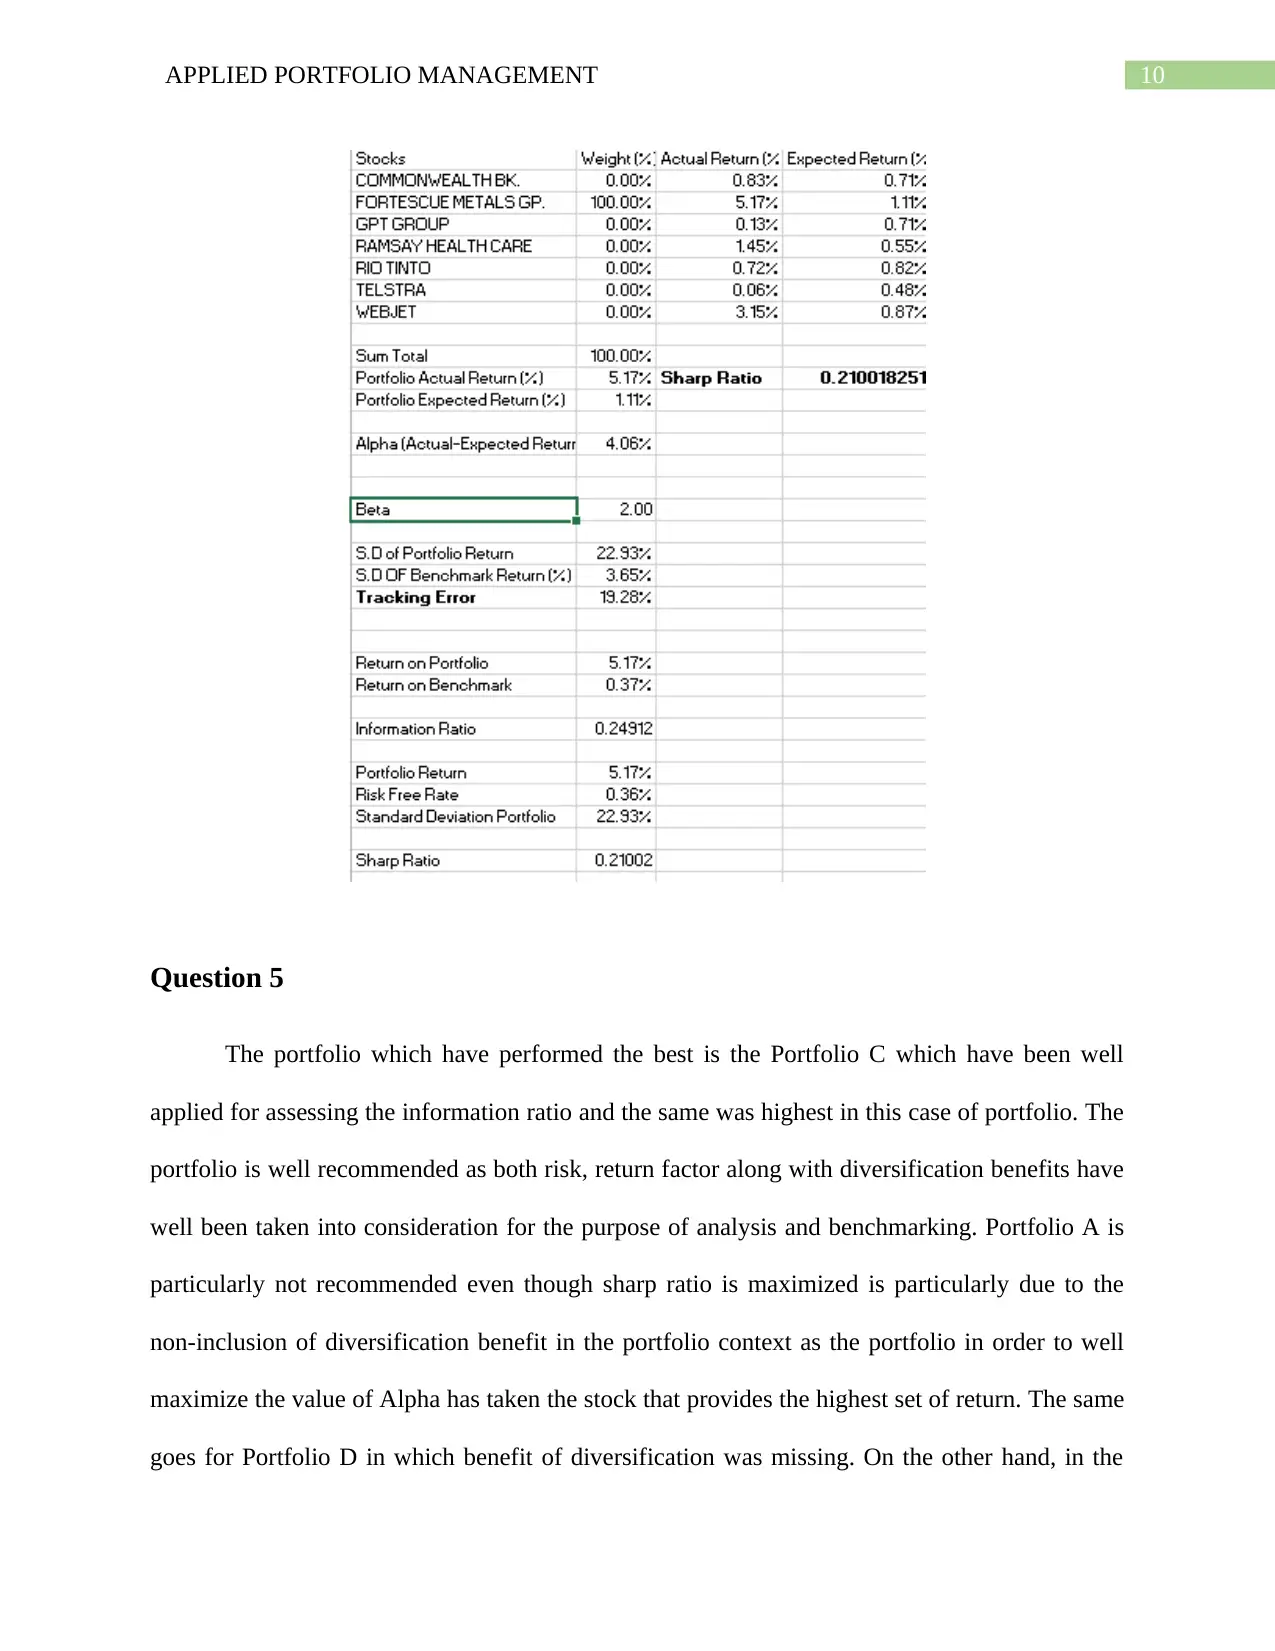
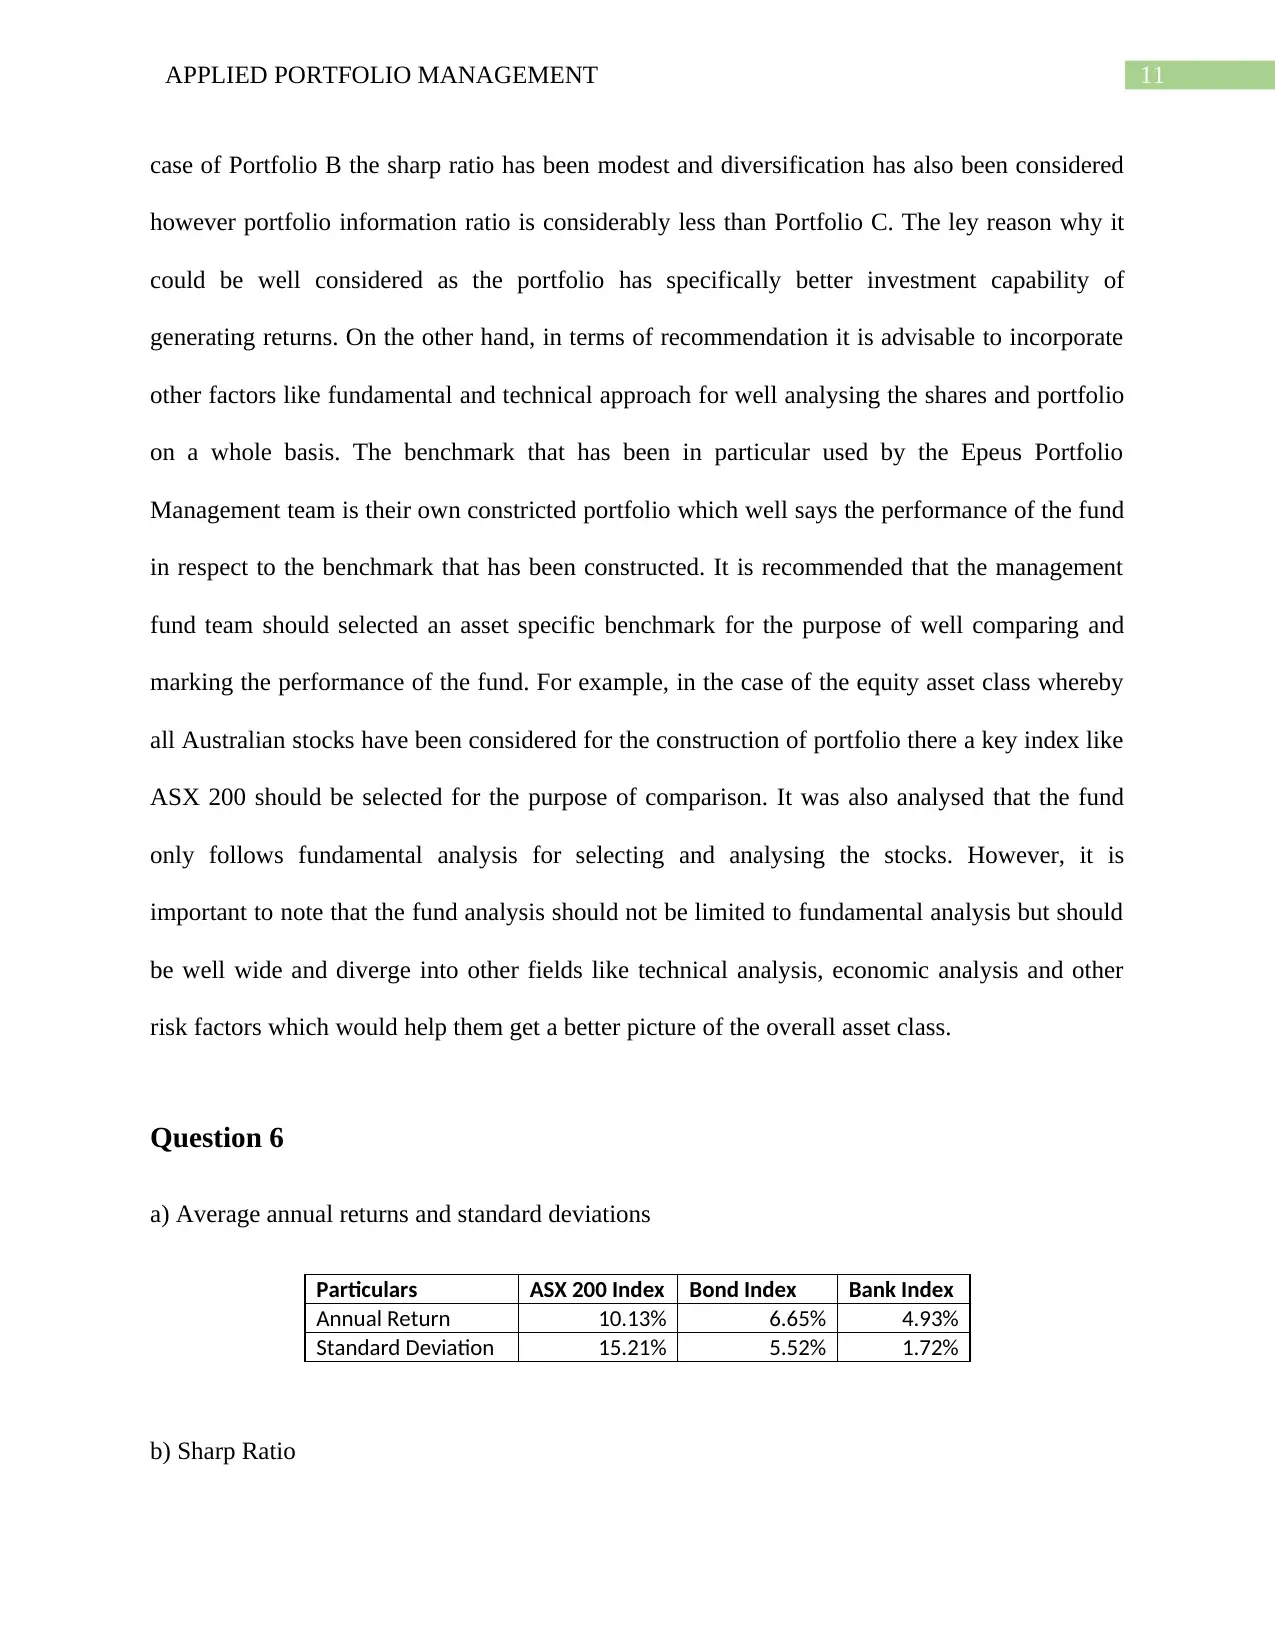
This report provides a comprehensive analysis of portfolio management principles, focusing on asset pricing models, multifactor models, and the application of robo-advisors. The report begins with an examination of average monthly excess returns, alpha, beta, and tracking error calculations for seven shares and an equity index, followed by a discussion of asset pricing models, including the Capital Asset Pricing Model (CAPM) and factor models. The report then delves into the application of multifactor models, outlining their use by investment managers and the different categories of these models, including macroeconomic, fundamental, and statistical models. The report further explores the use of Solver to optimize portfolios by maximizing alpha, minimizing tracking error, maximizing the information ratio with beta constraints, and maximizing the Sharpe ratio. Additionally, the report assesses the performance of different portfolios, recommending the best-performing portfolio based on information ratio and diversification benefits. The report also includes an analysis of market data, calculating Sharpe ratios and discussing the Capital Allocation Line and optimal risky portfolio. Finally, the report examines the role of robo-advisors in investment management, their benefits, and their suitability for firms like Epeus Portfolio Management. The report concludes by providing references to support the analysis and findings.

Running head: APPLIED PORTFOLIO MANAGEMENT
Applied Portfolio Management
Name of the Student:
Name of the University:
Author’s Note:
Applied Portfolio Management
Name of the Student:
Name of the University:
Author’s Note:
Paraphrase This Document
Need a fresh take? Get an instant paraphrase of this document with our AI Paraphraser

1APPLIED PORTFOLIO MANAGEMENT
Table of Contents
Question 1........................................................................................................................................2
Question 2........................................................................................................................................4
Question 3........................................................................................................................................5
Question 4........................................................................................................................................6
Question 5......................................................................................................................................10
Question 6......................................................................................................................................10
Question 7......................................................................................................................................12
References......................................................................................................................................14

2APPLIED PORTFOLIO MANAGEMENT
Question 1
a & b) Average monthly excess returns for the seven shares and the equity index. Alpha; beta; t-
statistics; and R squared. Also calculate and report each share’s tracking error
c) Second Pass Regression
Question 1
a & b) Average monthly excess returns for the seven shares and the equity index. Alpha; beta; t-
statistics; and R squared. Also calculate and report each share’s tracking error
c) Second Pass Regression
⊘ This is a preview!⊘
Do you want full access?
Subscribe today to unlock all pages.

Trusted by 1+ million students worldwide

3APPLIED PORTFOLIO MANAGEMENT
Paraphrase This Document
Need a fresh take? Get an instant paraphrase of this document with our AI Paraphraser

4APPLIED PORTFOLIO MANAGEMENT
d) Multi variable regression
Question 2
The asset pricing models which have been well used for calculating the return generated
on the equilibrium models which are basically economic models that well treat the assets prices
in the form of solutions to the consumer’s utility maximization problem. The most common
model that is used here is the Capital Asset Pricing Model or the CAPM Model which is well
used for the purpose of analysis and evaluation purpose. The models have been well used and
analysed in the form of solutions for he time series of various monthly data that has been
presented to us and for which equity risk premium, excess return, volatility/standard deviation
and volatility clustering puzzles have been well used for all of the seven shares. The monthly
data for the shares, index and the bank index considered as the risk free rate was well considered
for analysing and calculating the excess return of each of the share. In each of the seven shares
analysed Statistics and R-squared was also evaluated for the purpose of evaluating of stocks on a
risk/return basis.
The other key set of model that is well used is the application of factor model whereby
key input data of Fama-French Model has been well applied for assessing the value of the shares
by incorporating these factors. The models applied in evaluating the return of the share given a
certain case of consideration and factors require no-arbitrage conditions and some assumptions
about the overall structure of the capital markets. It is important to note that though these factors

5APPLIED PORTFOLIO MANAGEMENT
may be well motivated by various theories of economics, these analyzed models are not
economic models, in the modern sense of the neoclassical, maximization-based econ that we are
all used to.
Question 3
The application of multifactorial model is primarily done for the purpose of well
evaluating and explaining the market phenomenon or equilibrium asset prices. These models can
be well used for the purpose of explaining either and individual security or a portfolio of
securities. The key fund houses in which investment managers uses the application of
Multifactorial models are as follows:
Regal Australian Small Companies Fund
Colonial Wholesale Geared Share
The main purpose of using multi factor model is to construct portfolios which have
specific characteristics like risk or to track the indexes. These can be divided into three
categories. They are known as the macroeconomic models, fundamental models and the
statistical models. The macroeconomic models are used to compare the returns of a portfolio
with factors like inflation, employment and the interest rate. The fundamental model compares
the returns to underlying factors such as earnings, book-value-to-price ratio, market
capitalization, price-to-earnings-ratio and financial leverage. Statistical models are used to
compare the returns of one security to its past returns and the returns from the other securities in
the portfolio. The multifactor models are applied in areas like return and risk attribution as well.
They are applied to an available set of historical returns to determine the portfolios which
explain historical returns in two senses. In factor analysis, the factors tend to explain the
⊘ This is a preview!⊘
Do you want full access?
Subscribe today to unlock all pages.

Trusted by 1+ million students worldwide

6APPLIED PORTFOLIO MANAGEMENT
historical return covariance’s (CFA Institute. 2020). In case of principal-component models, the
factors are useful in best explaining the variances in historical returns over years. Another
commonly used technique is a factor portfolio which has sensitivity to a particular factor and no
sensitivity towards other factors. These models are used in tracking the assets and allocating
them between risk-free assets and an extremely diversified investment fund. One of the real life
examples using the multifactor analysis model is the BNP Paribas Asset management. They use
six factors in the construction of their portfolios. These include market risk, duration, emerging
market and commodities, corporate spreads, asset classes and similar commodities. The model
takes all these factors into consideration to provide more intuitive and relatable results regarding
a particular security and helps maximize the returns from a particular portfolio in a given period
of time (Moldaschl 2019).
Question 4
a) Maximum amount of alpha by applying Solver
Paraphrase This Document
Need a fresh take? Get an instant paraphrase of this document with our AI Paraphraser

7APPLIED PORTFOLIO MANAGEMENT
b) Minimizing tracking error with solver

8APPLIED PORTFOLIO MANAGEMENT
c) Maximum amount of information ratio plus a beta constrained to a value of one with the help
of solver.
c) Maximum amount of information ratio plus a beta constrained to a value of one with the help
of solver.
⊘ This is a preview!⊘
Do you want full access?
Subscribe today to unlock all pages.

Trusted by 1+ million students worldwide

9APPLIED PORTFOLIO MANAGEMENT
d) Solver to find the portfolio weights for a long-only share portfolio with the maximum amount
of Sharpe ratio.
d) Solver to find the portfolio weights for a long-only share portfolio with the maximum amount
of Sharpe ratio.
Paraphrase This Document
Need a fresh take? Get an instant paraphrase of this document with our AI Paraphraser

10APPLIED PORTFOLIO MANAGEMENT
Question 5
The portfolio which have performed the best is the Portfolio C which have been well
applied for assessing the information ratio and the same was highest in this case of portfolio. The
portfolio is well recommended as both risk, return factor along with diversification benefits have
well been taken into consideration for the purpose of analysis and benchmarking. Portfolio A is
particularly not recommended even though sharp ratio is maximized is particularly due to the
non-inclusion of diversification benefit in the portfolio context as the portfolio in order to well
maximize the value of Alpha has taken the stock that provides the highest set of return. The same
goes for Portfolio D in which benefit of diversification was missing. On the other hand, in the

11APPLIED PORTFOLIO MANAGEMENT
case of Portfolio B the sharp ratio has been modest and diversification has also been considered
however portfolio information ratio is considerably less than Portfolio C. The ley reason why it
could be well considered as the portfolio has specifically better investment capability of
generating returns. On the other hand, in terms of recommendation it is advisable to incorporate
other factors like fundamental and technical approach for well analysing the shares and portfolio
on a whole basis. The benchmark that has been in particular used by the Epeus Portfolio
Management team is their own constricted portfolio which well says the performance of the fund
in respect to the benchmark that has been constructed. It is recommended that the management
fund team should selected an asset specific benchmark for the purpose of well comparing and
marking the performance of the fund. For example, in the case of the equity asset class whereby
all Australian stocks have been considered for the construction of portfolio there a key index like
ASX 200 should be selected for the purpose of comparison. It was also analysed that the fund
only follows fundamental analysis for selecting and analysing the stocks. However, it is
important to note that the fund analysis should not be limited to fundamental analysis but should
be well wide and diverge into other fields like technical analysis, economic analysis and other
risk factors which would help them get a better picture of the overall asset class.
Question 6
a) Average annual returns and standard deviations
Particulars ASX 200 Index Bond Index Bank Index
Annual Return 10.13% 6.65% 4.93%
Standard Deviation 15.21% 5.52% 1.72%
b) Sharp Ratio
⊘ This is a preview!⊘
Do you want full access?
Subscribe today to unlock all pages.

Trusted by 1+ million students worldwide
1 out of 16
Related Documents
Your All-in-One AI-Powered Toolkit for Academic Success.
+13062052269
info@desklib.com
Available 24*7 on WhatsApp / Email
Unlock your academic potential
Copyright © 2020–2025 A2Z Services. All Rights Reserved. Developed and managed by ZUCOL.


