Finance Assignment: Risk and Return Analysis and Portfolio Management

Verified

Added on  2020/05/08

|9
|1343
|131
Homework Assignment
AI Summary
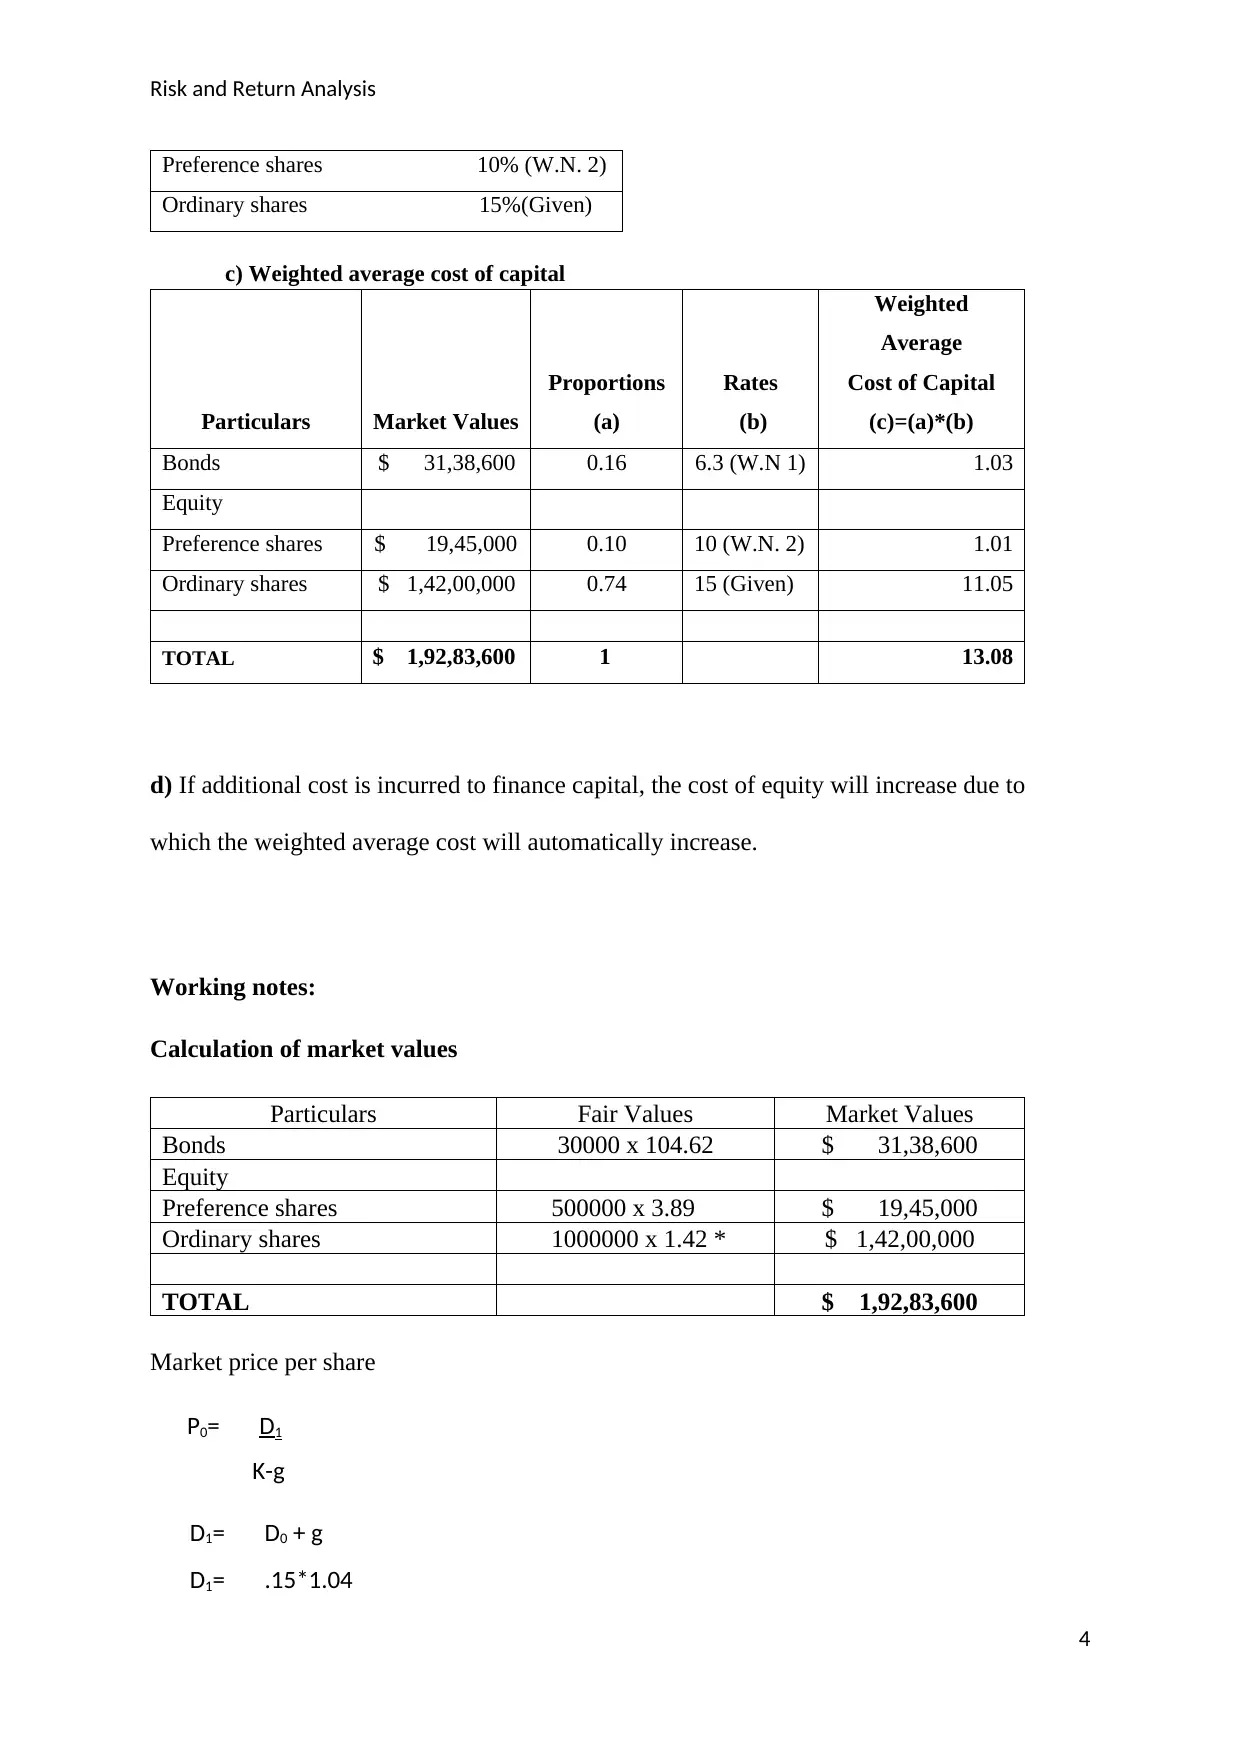
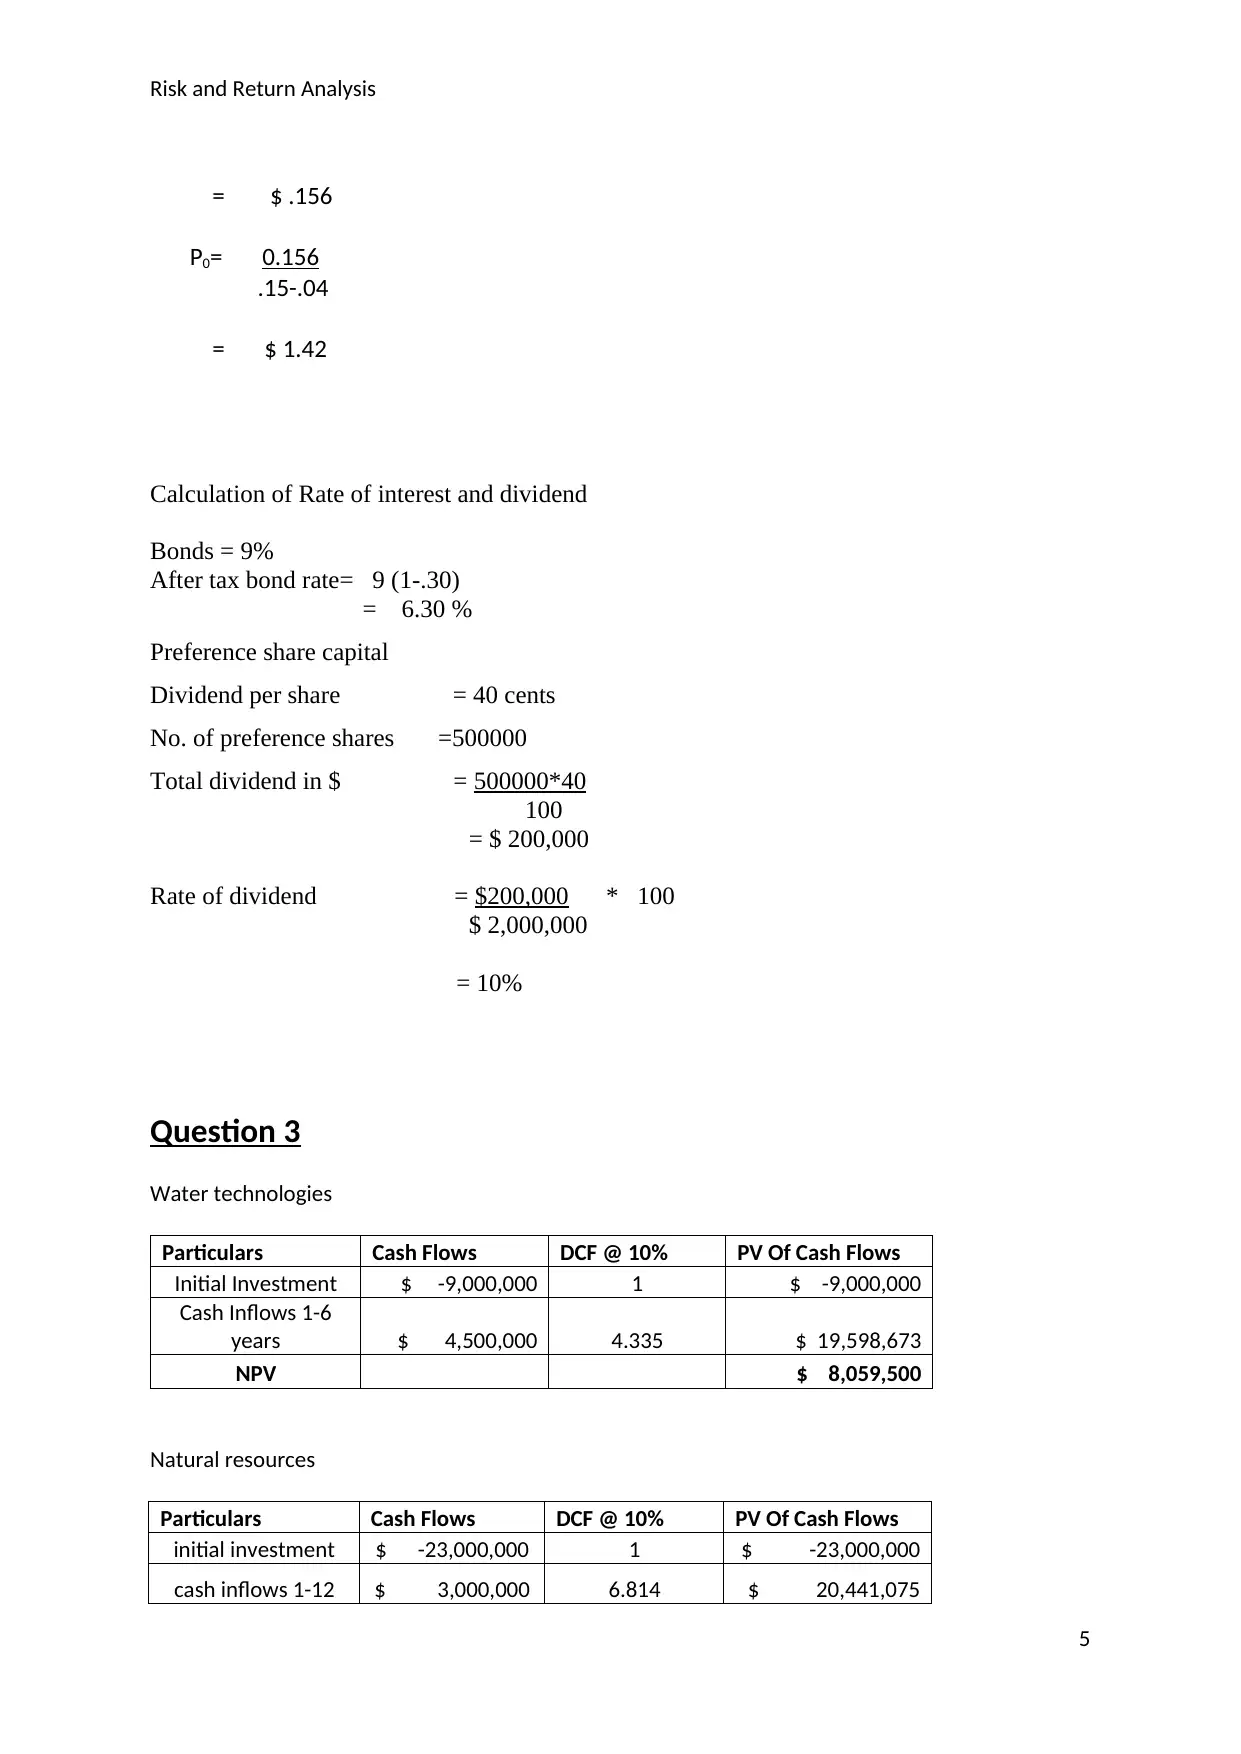
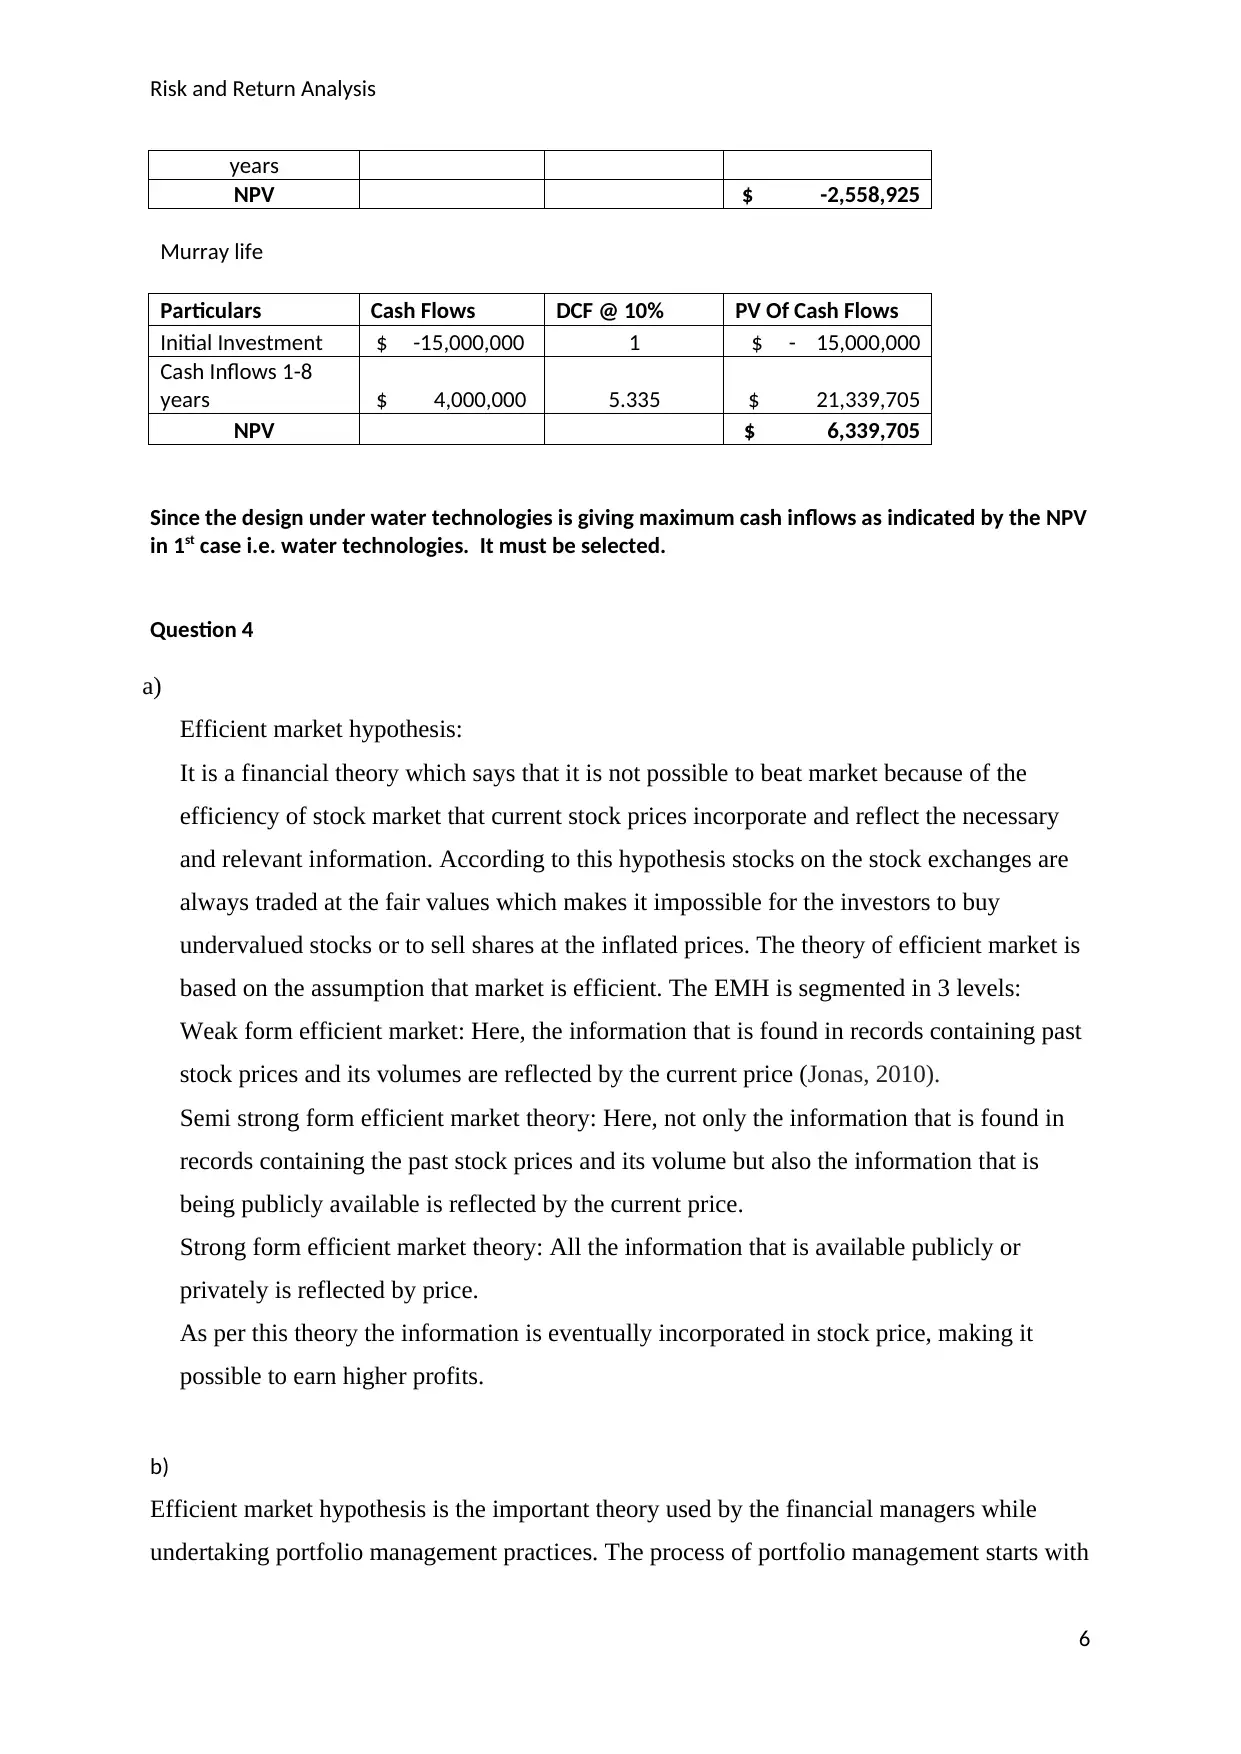
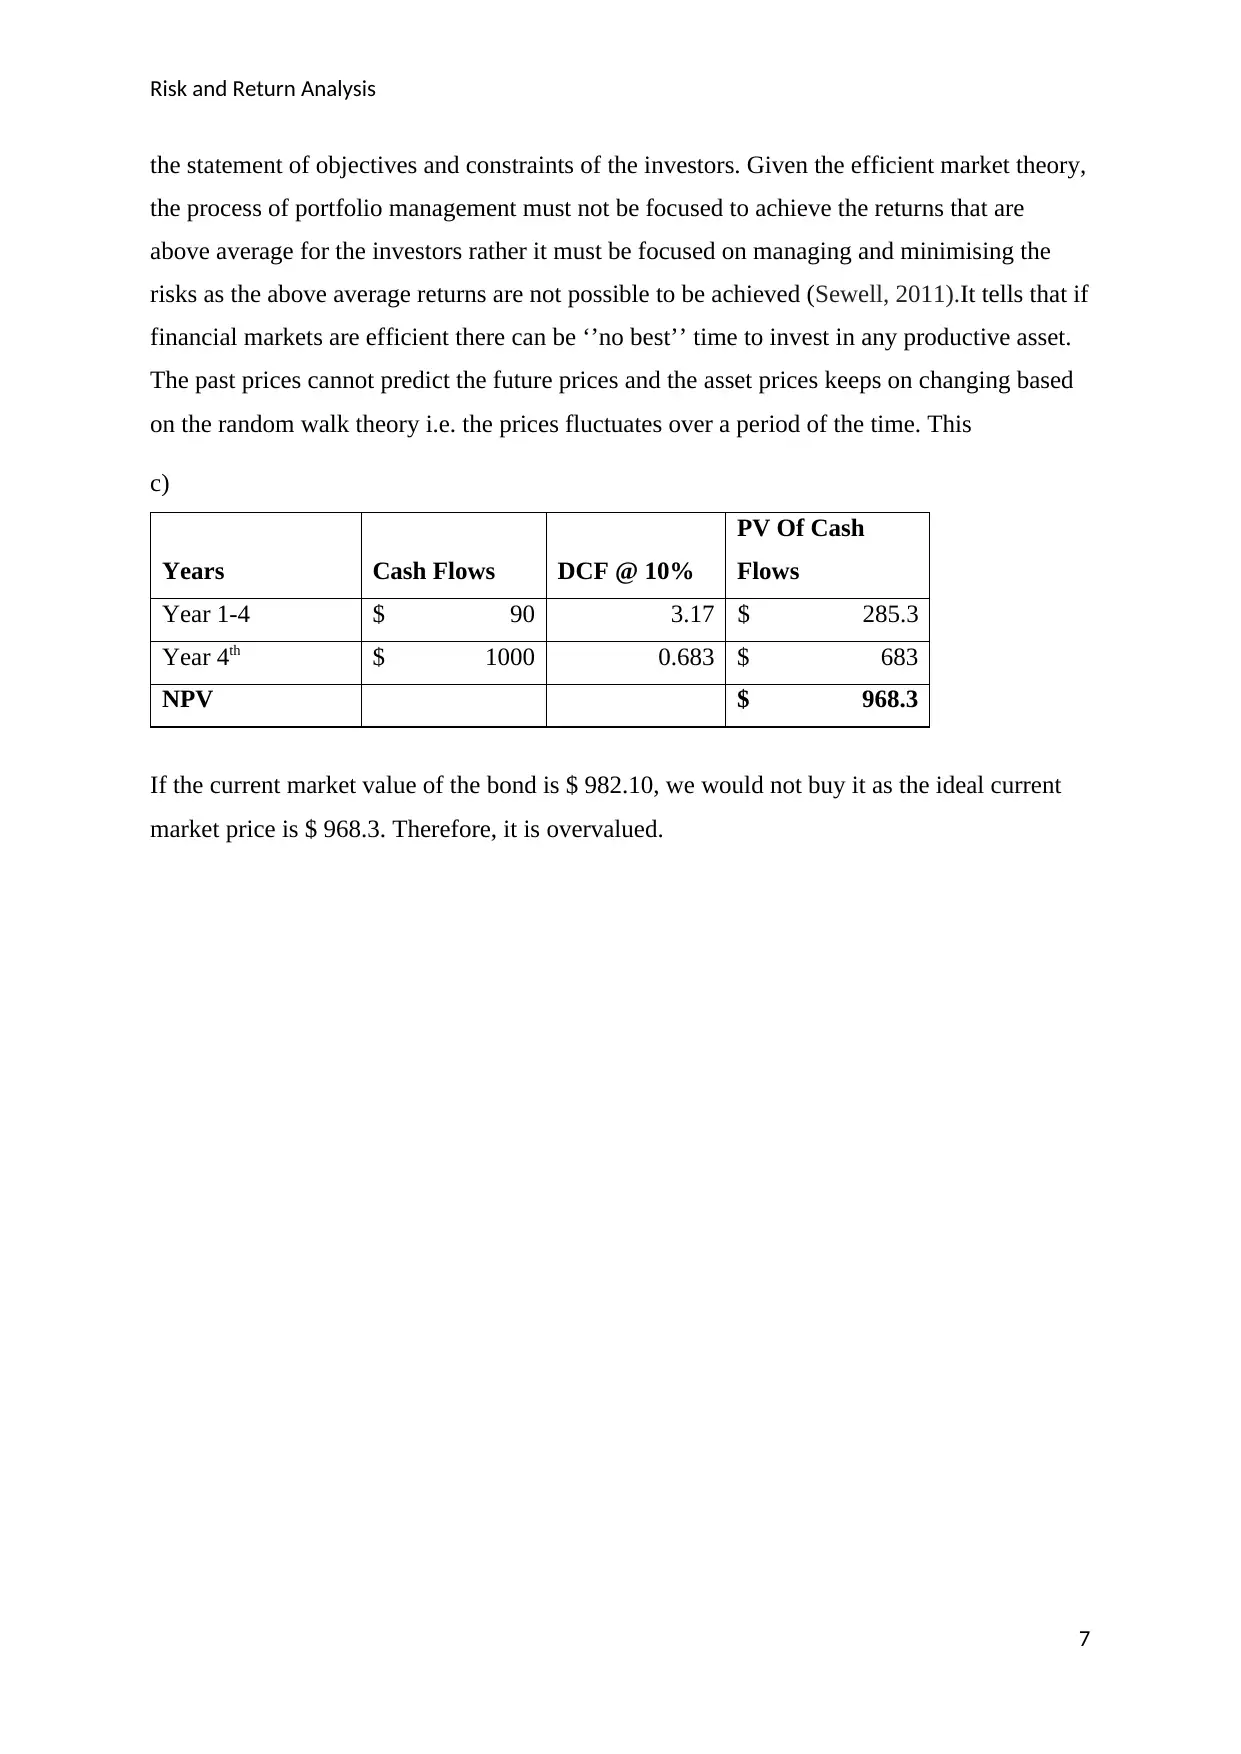
This finance assignment presents a comprehensive analysis of risk and return, covering various aspects of portfolio management and investment strategies. The assignment begins with a calculation of historical returns, standard deviation, and average return over several years, followed by an analysis of expected return and standard deviation under different probability scenarios. The Capital Asset Pricing Model (CAPM) is then employed to evaluate the required rate of return for a project, determining whether the project is a worthwhile investment. The assignment proceeds to calculate the market value proportions and after-tax costs of capital for different sources of finance, including bonds, preference shares, and ordinary shares. The weighted average cost of capital (WACC) is also computed. Furthermore, the assignment involves a Net Present Value (NPV) analysis to evaluate the profitability of different investment projects, such as water technologies, natural resources, and Murray life, to determine which project offers the highest potential returns. Finally, the assignment explores the efficient market hypothesis (EMH), discussing its different forms and implications for portfolio management, and concludes with an analysis of bond valuation.
Document Page
Running Head: Risk and Return Analysis
PORTFOLIO MANANGEMENT
tabler-icon-diamond-filled.svg

Paraphrase This Document

Need a fresh take? Get an instant paraphrase of this document with our AI Paraphraser
Document Page
Risk and Return Analysis
Question 1
i. Return Per Year
Return= P1-P0
P0
Years
Price
s
Return
Calculations
Return
s
2009 8.89 - -
2010 8.21 (8.21-8.89)/8.89 -7.65%
2011 7.45 (7.45-8.21)/8.21 -9.26%
2012 8.45 (8.45-7.45)/7.45 13.42%
2013 9.06 (9.06-8.45)/8.45 7.22%
2014 9.91 (9.91-9.06)/9.06 9.38%
2015 10.8 (10.8-9.91)/9.91 8.98%
2016 12.45 (12.45-10.8)/10.8 15.28%
ii. Standard Deviation
Years
Returns
(%)
Deviation
(%)
Deviation2
(%)
2009 -
2010 -7.65 -12.99 168.74
2011 -9.26 -14.60 213.16
2012 13.42 8.08 65.29
2013 7.22 1.88 6.49
2014 9.38 4.04 16.32
2015 8.98 3.64 13.25
2016 15.28 9.94 98.80
1
Document Page
Risk and Return Analysis
Total Return = Sum of returns of all the years (from year 2010- to 2016)
= 37.38 %
Average Return= 37.38
7
= 5.34 %
Variance = Sum of square of Deviation of all years/ No. of years
= 582.05/7
=82.73%
Standard Deviation= 9.096 %
Note: Variance = (Standard Deviation) 2
b)
i. Calculation of Expected Return And Standard Deviation
Returns
(%) (R)
Probability
(p)
Weighted
Returns (W)
Deviations
(D) D2 [D2(p)]
-5.00 0.15 -0.75 -11.50 132.25 19.84
3.00 0.30 0.90 -3.50 12.25 3.68
8.00 0.40 3.20 1.50 2.25 .90
21.00 0.15 3.15 14.50 210.25 31.54
21 1 6.50 % 55.95%
Expected Return = (R1*W1) + (R2*W2) + (R3 * W3) + (R4 * W4)
= 6.50 %
2
Document Page
Risk and Return Analysis
Variance = Sum of all [D2 (p)]
= 55.95%
Standard Deviation= 7.48% (square root of variance)
ii. Evaluation of rate of returns of project
To evaluate whether to invest in this project or not, calculation of ideal required rate of return
will be required using capital asset pricing model. Required rate of return (RRR) is the
minimum return which an investor is ready to accept from the investment. The investor will
invest in the project only if expected return is higher than or equal to the RRR.
According to CAPM model, RRR is
K= RF +BETA (RM-RF)
= 2%+.6 (9%-2%)
=6.20%
Since, the expected return rate is more than the required return rate, Fortissimo Group must
invest in this project as it would give them the return more than their expectations.
Question 2
a) Market value proportions of all sources of finance.
Particulars Market Values Proportions (a)
Bonds $ 31,38,600 0.16
Equity
Preference shares $ 19,45,000 0.10
Ordinary shares $ 1,42,00,000 0.74
TOTAL $ 1,92,83,600 1
b) After tax cost of capitals of each source of finance
Particulars
Bonds 6.3% (W.N.1)
Equity
3
tabler-icon-diamond-filled.svg

Paraphrase This Document

Need a fresh take? Get an instant paraphrase of this document with our AI Paraphraser
Document Page
Risk and Return Analysis
Preference shares 10% (W.N. 2)
Ordinary shares 15%(Given)
c) Weighted average cost of capital
Particulars Market Values
Proportions
(a)
Rates
(b)
Weighted
Average
Cost of Capital
(c)=(a)*(b)
Bonds $ 31,38,600 0.16 6.3 (W.N 1) 1.03
Equity
Preference shares $ 19,45,000 0.10 10 (W.N. 2) 1.01
Ordinary shares $ 1,42,00,000 0.74 15 (Given) 11.05
TOTAL $ 1,92,83,600 1 13.08
d) If additional cost is incurred to finance capital, the cost of equity will increase due to
which the weighted average cost will automatically increase.
Working notes:
Calculation of market values
Particulars Fair Values Market Values
Bonds 30000 x 104.62 $ 31,38,600
Equity
Preference shares 500000 x 3.89 $ 19,45,000
Ordinary shares 1000000 x 1.42 * $ 1,42,00,000
TOTAL $ 1,92,83,600
Market price per share
P0= D1
K-g
D1= D0 + g
D1= .15*1.04
4
Document Page
Risk and Return Analysis
= $ .156
P0= 0.156
.15-.04
= $ 1.42
Calculation of Rate of interest and dividend
Bonds = 9%
After tax bond rate= 9 (1-.30)
= 6.30 %
Preference share capital
Dividend per share = 40 cents
No. of preference shares =500000
Total dividend in $ = 500000*40
100
= $ 200,000
Rate of dividend = $200,000 * 100
$ 2,000,000
= 10%
Question 3
Water technologies
Particulars Cash Flows DCF @ 10% PV Of Cash Flows
Initial Investment $ -9,000,000 1 $ -9,000,000
Cash Inflows 1-6
years $ 4,500,000 4.335 $ 19,598,673
NPV $ 8,059,500
Natural resources
Particulars Cash Flows DCF @ 10% PV Of Cash Flows
initial investment $ -23,000,000 1 $ -23,000,000
cash inflows 1-12 $ 3,000,000 6.814 $ 20,441,075
5
Document Page
Risk and Return Analysis
years
NPV $ -2,558,925
Murray life
Particulars Cash Flows DCF @ 10% PV Of Cash Flows
Initial Investment $ -15,000,000 1 $ - 15,000,000
Cash Inflows 1-8
years $ 4,000,000 5.335 $ 21,339,705
NPV $ 6,339,705
Since the design under water technologies is giving maximum cash inflows as indicated by the NPV
in 1st case i.e. water technologies. It must be selected.
Question 4
a)
Efficient market hypothesis:
It is a financial theory which says that it is not possible to beat market because of the
efficiency of stock market that current stock prices incorporate and reflect the necessary
and relevant information. According to this hypothesis stocks on the stock exchanges are
always traded at the fair values which makes it impossible for the investors to buy
undervalued stocks or to sell shares at the inflated prices. The theory of efficient market is
based on the assumption that market is efficient. The EMH is segmented in 3 levels:
Weak form efficient market: Here, the information that is found in records containing past
stock prices and its volumes are reflected by the current price (Jonas, 2010).
Semi strong form efficient market theory: Here, not only the information that is found in
records containing the past stock prices and its volume but also the information that is
being publicly available is reflected by the current price.
Strong form efficient market theory: All the information that is available publicly or
privately is reflected by price.
As per this theory the information is eventually incorporated in stock price, making it
possible to earn higher profits.
b)
Efficient market hypothesis is the important theory used by the financial managers while
undertaking portfolio management practices. The process of portfolio management starts with
6
tabler-icon-diamond-filled.svg

Paraphrase This Document

Need a fresh take? Get an instant paraphrase of this document with our AI Paraphraser
Document Page
Risk and Return Analysis
the statement of objectives and constraints of the investors. Given the efficient market theory,
the process of portfolio management must not be focused to achieve the returns that are
above average for the investors rather it must be focused on managing and minimising the
risks as the above average returns are not possible to be achieved (Sewell, 2011).It tells that if
financial markets are efficient there can be ‘’no best’’ time to invest in any productive asset.
The past prices cannot predict the future prices and the asset prices keeps on changing based
on the random walk theory i.e. the prices fluctuates over a period of the time. This
c)
Years Cash Flows DCF @ 10%
PV Of Cash
Flows
Year 1-4 $ 90 3.17 $ 285.3
Year 4th $ 1000 0.683 $ 683
NPV $ 968.3
If the current market value of the bond is $ 982.10, we would not buy it as the ideal current
market price is $ 968.3. Therefore, it is overvalued.
7
Document Page
Risk and Return Analysis
References:
Jonas, D., 2010. Empowering project portfolio managers: How management involvement
impacts project portfolio management performance. International Journal of Project
Management, 28(8), pp.818-831.
Sewell, M., 2011. History of the efficient market hypothesis. RN, 11(04), p.04.
8
chevron_up_icon
1 out of 9
circle_padding
hide_on_mobile
zoom_out_icon
[object Object]