Portfolio Management Using Fundamental & Technical Analysis
VerifiedAdded on 2023/06/15
|18
|3787
|97
Report
AI Summary
This report explores portfolio management through fundamental and technical analysis, comparing the Efficient Market Hypothesis (EMH) with behavioral finance. Two portfolios, each containing 10 stocks, were constructed, one based on fundamental analysis and the other on technical analysis. The fundamental analysis employed methods like the Gordon Dividend Discount Model and PB Multiple Model, while the technical analysis utilized line charts and moving averages. The report details the stock selection process, trading activities within each portfolio, and a comparative analysis of their performance against the FTSE ST All Share Index. Results indicated that both portfolios outperformed the market, with the fundamentally analyzed portfolio showing a slightly better return. The report concludes that while both methods have value, markets often deviate from rational behavior due to investor psychology and information asymmetry. Desklib provides access to this and other solved assignments for student learning.

Running Head: PORTFOLIO MANAGEMENT 1
Portfolio Management using Fundamental and Technical Analysis
Portfolio Management using Fundamental and Technical Analysis
Paraphrase This Document
Need a fresh take? Get an instant paraphrase of this document with our AI Paraphraser
PORTFOLIO MANAGEMENT 2
Table of Contents
Introduction...........................................................................................................................................3
Literature Review..................................................................................................................................3
Rational and Methodology....................................................................................................................5
Result and Analysis................................................................................................................................9
Conclusion...........................................................................................................................................10
References...........................................................................................................................................12
Appendix 1 Fundamental Portfolio......................................................................................................14
Appendix 2 Technical Portfolio............................................................................................................14
Appendix 3 Portfolio 1 Valuation.........................................................................................................15
Appendix 4 Portfolio 2 Valuation.........................................................................................................15
Appendix 5 Stock Profits 1...................................................................................................................16
Appendix 6 Stock Profits 2...................................................................................................................16
Appendix 7 Final Return......................................................................................................................17
Appendix 8 Market Return..................................................................................................................17
PORTFOLIO MANAGEMENT 3
Introduction
Investment in stocks and portfolio management involves analysing different
parameters using various techniques. Fundamental analysis and technical analysis are two
most commonly employed methods for stock selection. The study of macro-economic data
and financial performance of an organization for evaluating the intrinsic value of a stock is
referred to as fundamental analysis (Krantz, 2016). On the other hand, technical analysis
involves examination of historical trends in stock movements and prediction of future prices
on the basis of past trends (Grimes, 2012). This report involves construction of two portfolios
of 10 stocks each. First portfolio is constructed on the basis on fundamental analysis and
other one is based on technical analysis. Apart from this report also discusses about the
efficient market hypothesis and behavioural finance. The report also gives view about the
conflict between the EMH and behavioural finance.
Literature Review
Stock selection and evaluation is commonly carried using various methods of
fundamental and technical analysis. This consists of analysis of past financial position of a
company and studying movements of price fluctuations of its stock. On the other hand,
efficient market hypothesis and behavioural finance add another dimension to stock selection
and their performance evaluation According to Efficient market hypothesis, stock prices
always reflect all the information that is available in the market and trade at their intrinsic
value. New information is transferred to all the investors without any cost and is randomly
distributed. Therefore passive investment strategy will be more effective than active
management. Behaviour finance believes that investors do not behave rationally and their
emotional biases affect their choices. Overconfidence, conservatism and risk aversion are
some of many such behavioural influences which affect market sentiments (Forbes, 2009).
⊘ This is a preview!⊘
Do you want full access?
Subscribe today to unlock all pages.
Trusted by 1+ million students worldwide
PORTFOLIO MANAGEMENT 4
Overconfidence in markets leads excessive buying during market rally. Another
empirical evidence of irrationality of investors is that low price to earnings ratio companies
react more positively to good news than high P/E ratio companies (Byrne, 2008). Stock
market crashes in one part of the world affect investor sentiments in other regions. This was
particularly evident during global financial crisis of 2008 and dot com bubble, when market
crash in USA not only had an effect on neighbouring markets but also in markets of China,
Australia and other regions of the world. This was due to selling pressure which had built due
to negative news from USA. However, macro-economic conditions in these countries were
better than USA. This is purely because of irrational investor behaviour (Baker and
Nofsinger, 2010).
Various theories of finance lay their foundation on the basis of efficient market
hypothesis. Capital asset pricing model (CAPM) and modern portfolio theory which form the
basis of most of the investments are based on efficient market hypothesis. Efficient market
hypothesis has been useful in securities pricing. This is particularly true in the case of
shareholder appraisal cases and benefit plans for employees. According to EMH, investors
are assumed to rational and it is believed that markets are self-correcting. EMH also is
contrary to technical analysis and believes that it cannot be used to outperform the market.
Proponents of EMH argue that past prices and data cannot be used to predict future returns.
So a portfolio can outperform a market only by chance and past information is already
reflected in market (Harder, 2010).
There seems to be a conflict in ideologies of believers of EMH and behavioural
finance. EMH believes in superiority of market and rationality of investors. EMH also causes
no random price movements in the markets. Apart from stock market, EMH is also used in
other fields of finance such as construction of portfolio, dividends and efficiency of funding.
On the other hand, behaviour finance argues that prices of securities in markets are not the
Paraphrase This Document
Need a fresh take? Get an instant paraphrase of this document with our AI Paraphraser
PORTFOLIO MANAGEMENT 5
reflection of their intrinsic value. In many cases, human psychology is real force behind
market movements. The research in the field of behavioural finance not only involves study
of human emotions but also cultural trends and expectations of investors. In real world
efficient market hypothesis rarely holds, primarily due to information asymmetry and
psychological biases present in investors. Securities in markets are mostly not trading at their
intrinsic values and it requires various financial techniques to take advantage of such
mispricing (Akintoye, 2008). Various methods of technical analysis such as moving average,
trend analysis and candle stick chart have been developed to determine real values of
securities. Fundamental analysis also uses many methods such as Gordon dividend discount
model and valuation on the basis of price multiples. Therefore, both EMH and behavioural
finance have important role in play in markets. However, markets primarily do not behave
rationally.
Rational and Methodology
The methodology of portfolio management and stock selection consists of gathering
of quantitative financial data for analysis to draw suitable conclusions. The crux of efficient
financial management lies in adoption of right methods and their effective implementation
(Phillips and Stawarski, 2016). In this report, two portfolios have been constructed by use
various methods with the intention to beat the market. Various methods of technical and
fundamental analysis have been used successfully for active management of portfolio. Both
the methods are based different principles. Technical analysis does not rely on the analysing
the financial performance of a company, it attempts to draw conclusions from price
movements and changes in volume of stock traded. On the other hand, fundamental analysis
believes in analysing the financial performance of the company and does not give much of
PORTFOLIO MANAGEMENT 6
the importance to price trends. None of the methods is superior to other and both are
complimentary to each other (Stanfield, 2005).
In this report, company Jardine Cycle and Carriage Limited has been chosen on the
basis of fundamental analysis because of it has generated a return on equity of 14.42%
(Yahoo finance, 2018). On the other hand, stock of DBS Group Holdings has been selected
because of exceptional profit margin of 40.74% and operating profit margin of 51.49%.
(Yahoo finance, 2018). Thus using various parameters of financial performance and
techniques of fundamental analysis one portfolio of 10 has been constructed. Another
portfolio comprising of 10 stocks has also been constructed on basis of technical analysis.
Both the methods will result rational choices and prudent judgments.
Analysis of a Stock using Fundamental Analysis
Dividend Discount Model
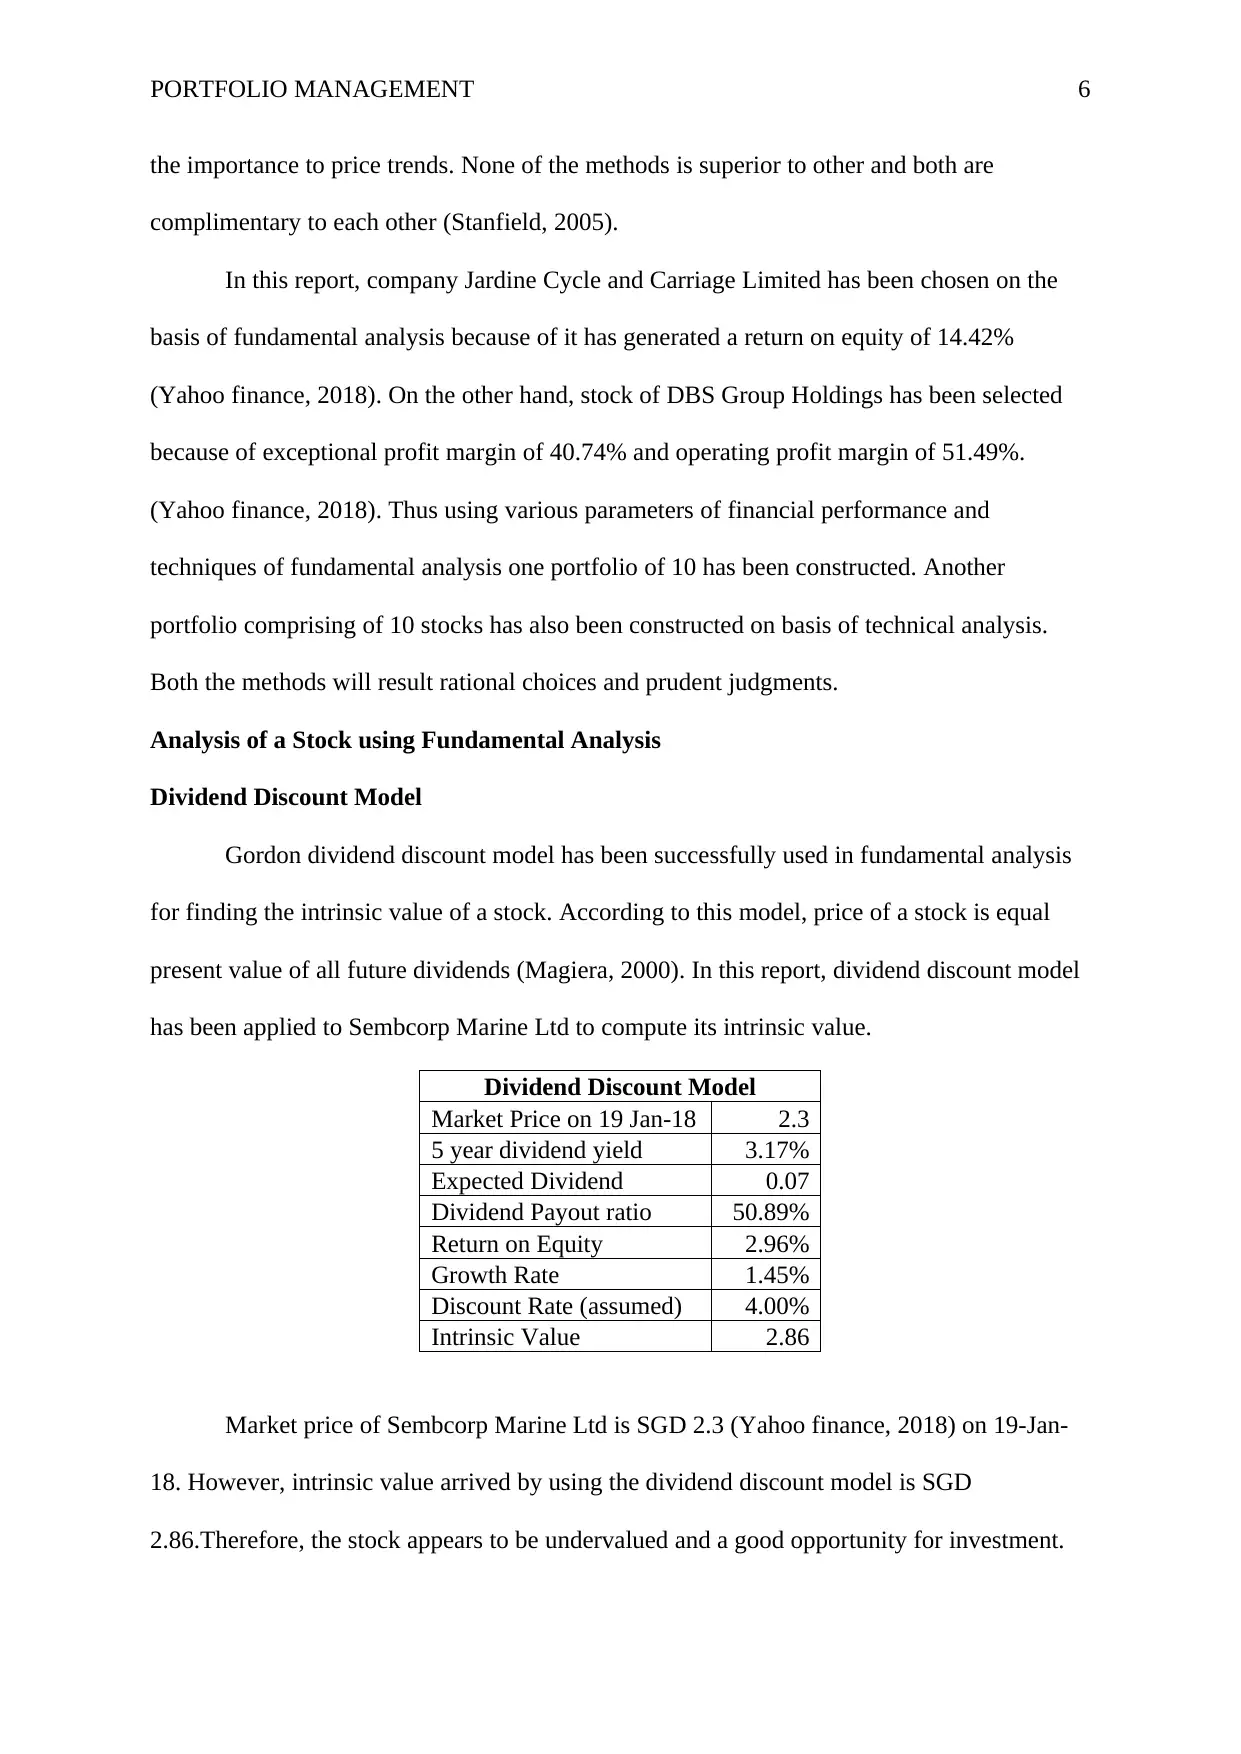
Gordon dividend discount model has been successfully used in fundamental analysis
for finding the intrinsic value of a stock. According to this model, price of a stock is equal
present value of all future dividends (Magiera, 2000). In this report, dividend discount model
has been applied to Sembcorp Marine Ltd to compute its intrinsic value.
Dividend Discount Model
Market Price on 19 Jan-18 2.3
5 year dividend yield 3.17%
Expected Dividend 0.07
Dividend Payout ratio 50.89%
Return on Equity 2.96%
Growth Rate 1.45%
Discount Rate (assumed) 4.00%
Intrinsic Value 2.86
Market price of Sembcorp Marine Ltd is SGD 2.3 (Yahoo finance, 2018) on 19-Jan-
18. However, intrinsic value arrived by using the dividend discount model is SGD
2.86.Therefore, the stock appears to be undervalued and a good opportunity for investment.
the importance to price trends. None of the methods is superior to other and both are
complimentary to each other (Stanfield, 2005).
In this report, company Jardine Cycle and Carriage Limited has been chosen on the
basis of fundamental analysis because of it has generated a return on equity of 14.42%
(Yahoo finance, 2018). On the other hand, stock of DBS Group Holdings has been selected
because of exceptional profit margin of 40.74% and operating profit margin of 51.49%.
(Yahoo finance, 2018). Thus using various parameters of financial performance and
techniques of fundamental analysis one portfolio of 10 has been constructed. Another
portfolio comprising of 10 stocks has also been constructed on basis of technical analysis.
Both the methods will result rational choices and prudent judgments.
Analysis of a Stock using Fundamental Analysis
Dividend Discount Model
Gordon dividend discount model has been successfully used in fundamental analysis
for finding the intrinsic value of a stock. According to this model, price of a stock is equal
present value of all future dividends (Magiera, 2000). In this report, dividend discount model
has been applied to Sembcorp Marine Ltd to compute its intrinsic value.
Dividend Discount Model
Market Price on 19 Jan-18 2.3
5 year dividend yield 3.17%
Expected Dividend 0.07
Dividend Payout ratio 50.89%
Return on Equity 2.96%
Growth Rate 1.45%
Discount Rate (assumed) 4.00%
Intrinsic Value 2.86
Market price of Sembcorp Marine Ltd is SGD 2.3 (Yahoo finance, 2018) on 19-Jan-
18. However, intrinsic value arrived by using the dividend discount model is SGD
2.86.Therefore, the stock appears to be undervalued and a good opportunity for investment.
⊘ This is a preview!⊘
Do you want full access?
Subscribe today to unlock all pages.
Trusted by 1+ million students worldwide
PORTFOLIO MANAGEMENT 7
PB Multiple Model
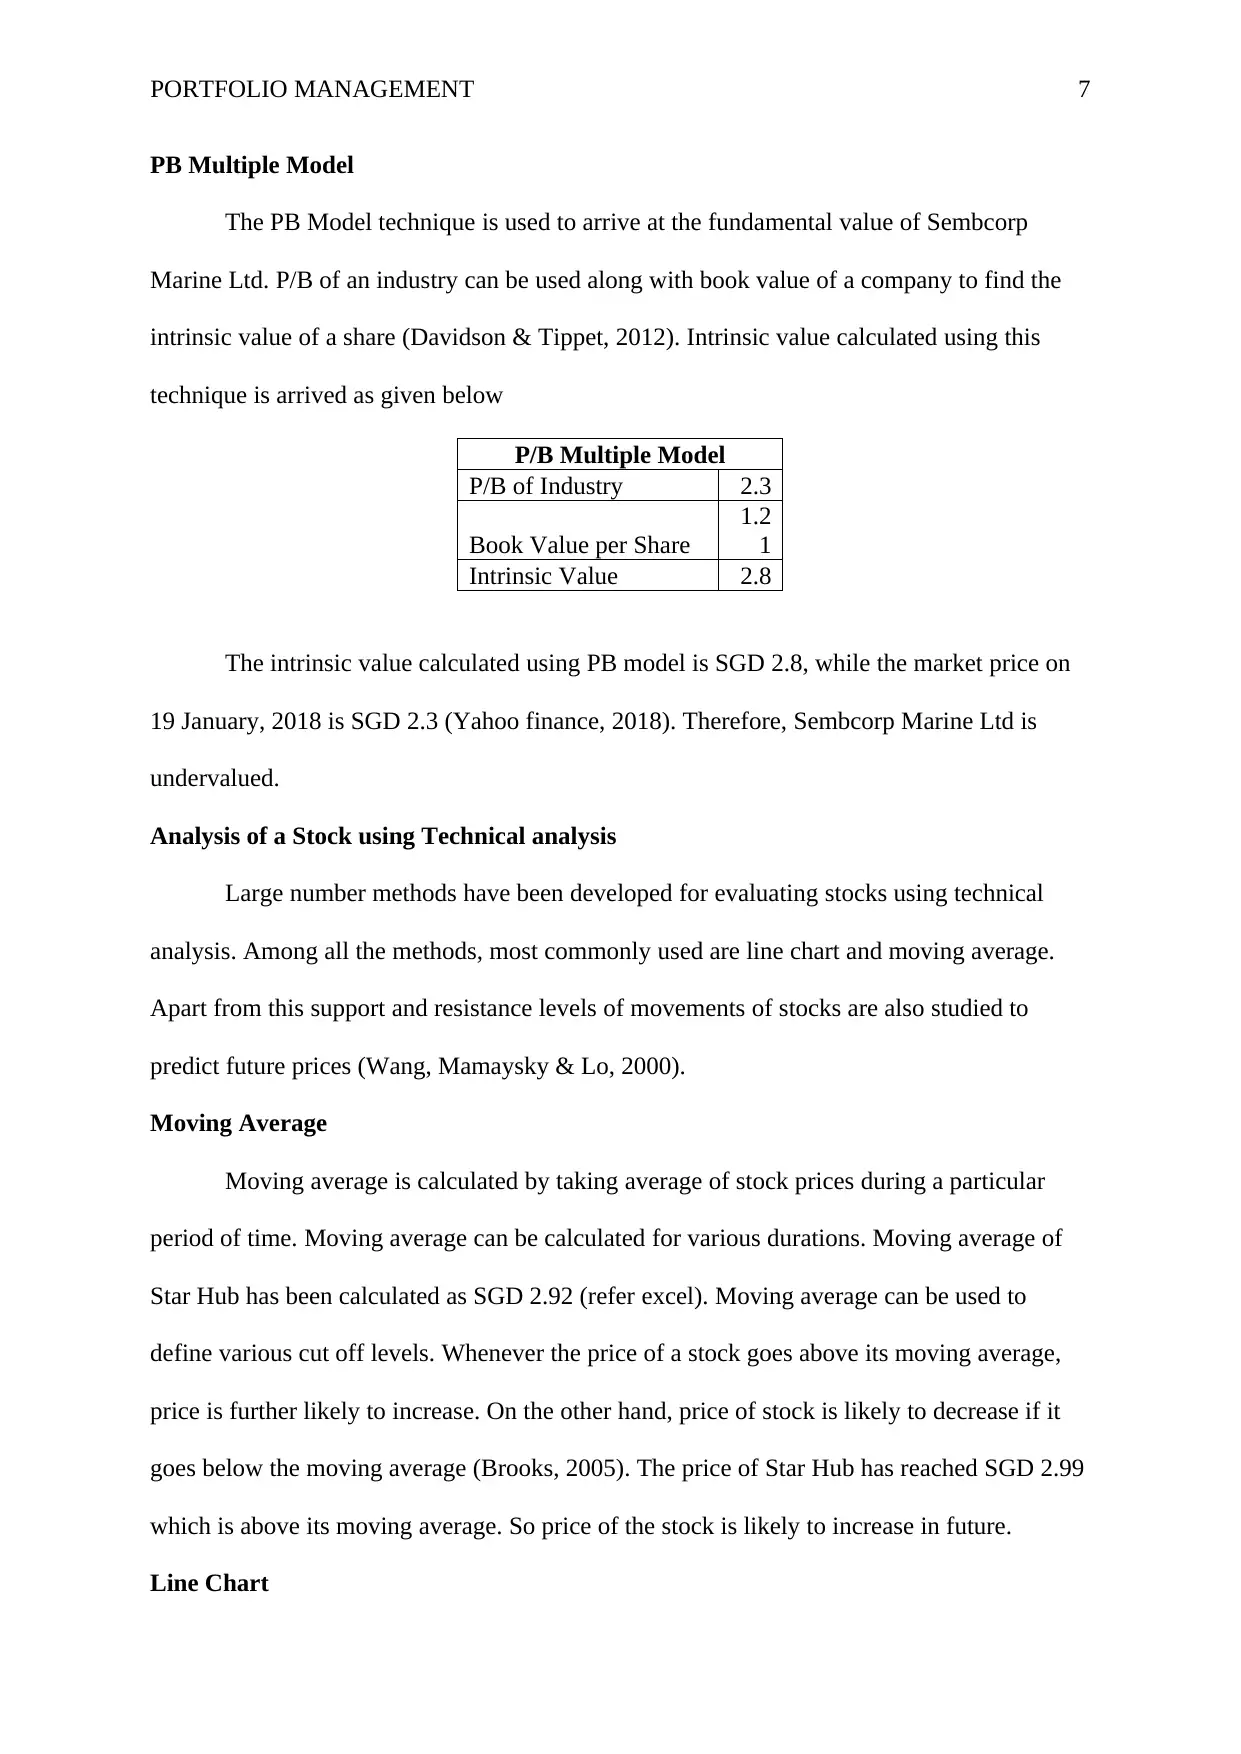
The PB Model technique is used to arrive at the fundamental value of Sembcorp
Marine Ltd. P/B of an industry can be used along with book value of a company to find the
intrinsic value of a share (Davidson & Tippet, 2012). Intrinsic value calculated using this
technique is arrived as given below
P/B Multiple Model
P/B of Industry 2.3
Book Value per Share
1.2
1
Intrinsic Value 2.8
The intrinsic value calculated using PB model is SGD 2.8, while the market price on
19 January, 2018 is SGD 2.3 (Yahoo finance, 2018). Therefore, Sembcorp Marine Ltd is
undervalued.
Analysis of a Stock using Technical analysis
Large number methods have been developed for evaluating stocks using technical
analysis. Among all the methods, most commonly used are line chart and moving average.
Apart from this support and resistance levels of movements of stocks are also studied to
predict future prices (Wang, Mamaysky & Lo, 2000).
Moving Average
Moving average is calculated by taking average of stock prices during a particular
period of time. Moving average can be calculated for various durations. Moving average of
Star Hub has been calculated as SGD 2.92 (refer excel). Moving average can be used to
define various cut off levels. Whenever the price of a stock goes above its moving average,
price is further likely to increase. On the other hand, price of stock is likely to decrease if it
goes below the moving average (Brooks, 2005). The price of Star Hub has reached SGD 2.99
which is above its moving average. So price of the stock is likely to increase in future.
Line Chart
PB Multiple Model
The PB Model technique is used to arrive at the fundamental value of Sembcorp
Marine Ltd. P/B of an industry can be used along with book value of a company to find the
intrinsic value of a share (Davidson & Tippet, 2012). Intrinsic value calculated using this
technique is arrived as given below
P/B Multiple Model
P/B of Industry 2.3
Book Value per Share
1.2
1
Intrinsic Value 2.8
The intrinsic value calculated using PB model is SGD 2.8, while the market price on
19 January, 2018 is SGD 2.3 (Yahoo finance, 2018). Therefore, Sembcorp Marine Ltd is
undervalued.
Analysis of a Stock using Technical analysis
Large number methods have been developed for evaluating stocks using technical
analysis. Among all the methods, most commonly used are line chart and moving average.
Apart from this support and resistance levels of movements of stocks are also studied to
predict future prices (Wang, Mamaysky & Lo, 2000).
Moving Average
Moving average is calculated by taking average of stock prices during a particular
period of time. Moving average can be calculated for various durations. Moving average of
Star Hub has been calculated as SGD 2.92 (refer excel). Moving average can be used to
define various cut off levels. Whenever the price of a stock goes above its moving average,
price is further likely to increase. On the other hand, price of stock is likely to decrease if it
goes below the moving average (Brooks, 2005). The price of Star Hub has reached SGD 2.99
which is above its moving average. So price of the stock is likely to increase in future.
Line Chart
Paraphrase This Document
Need a fresh take? Get an instant paraphrase of this document with our AI Paraphraser
PORTFOLIO MANAGEMENT 8
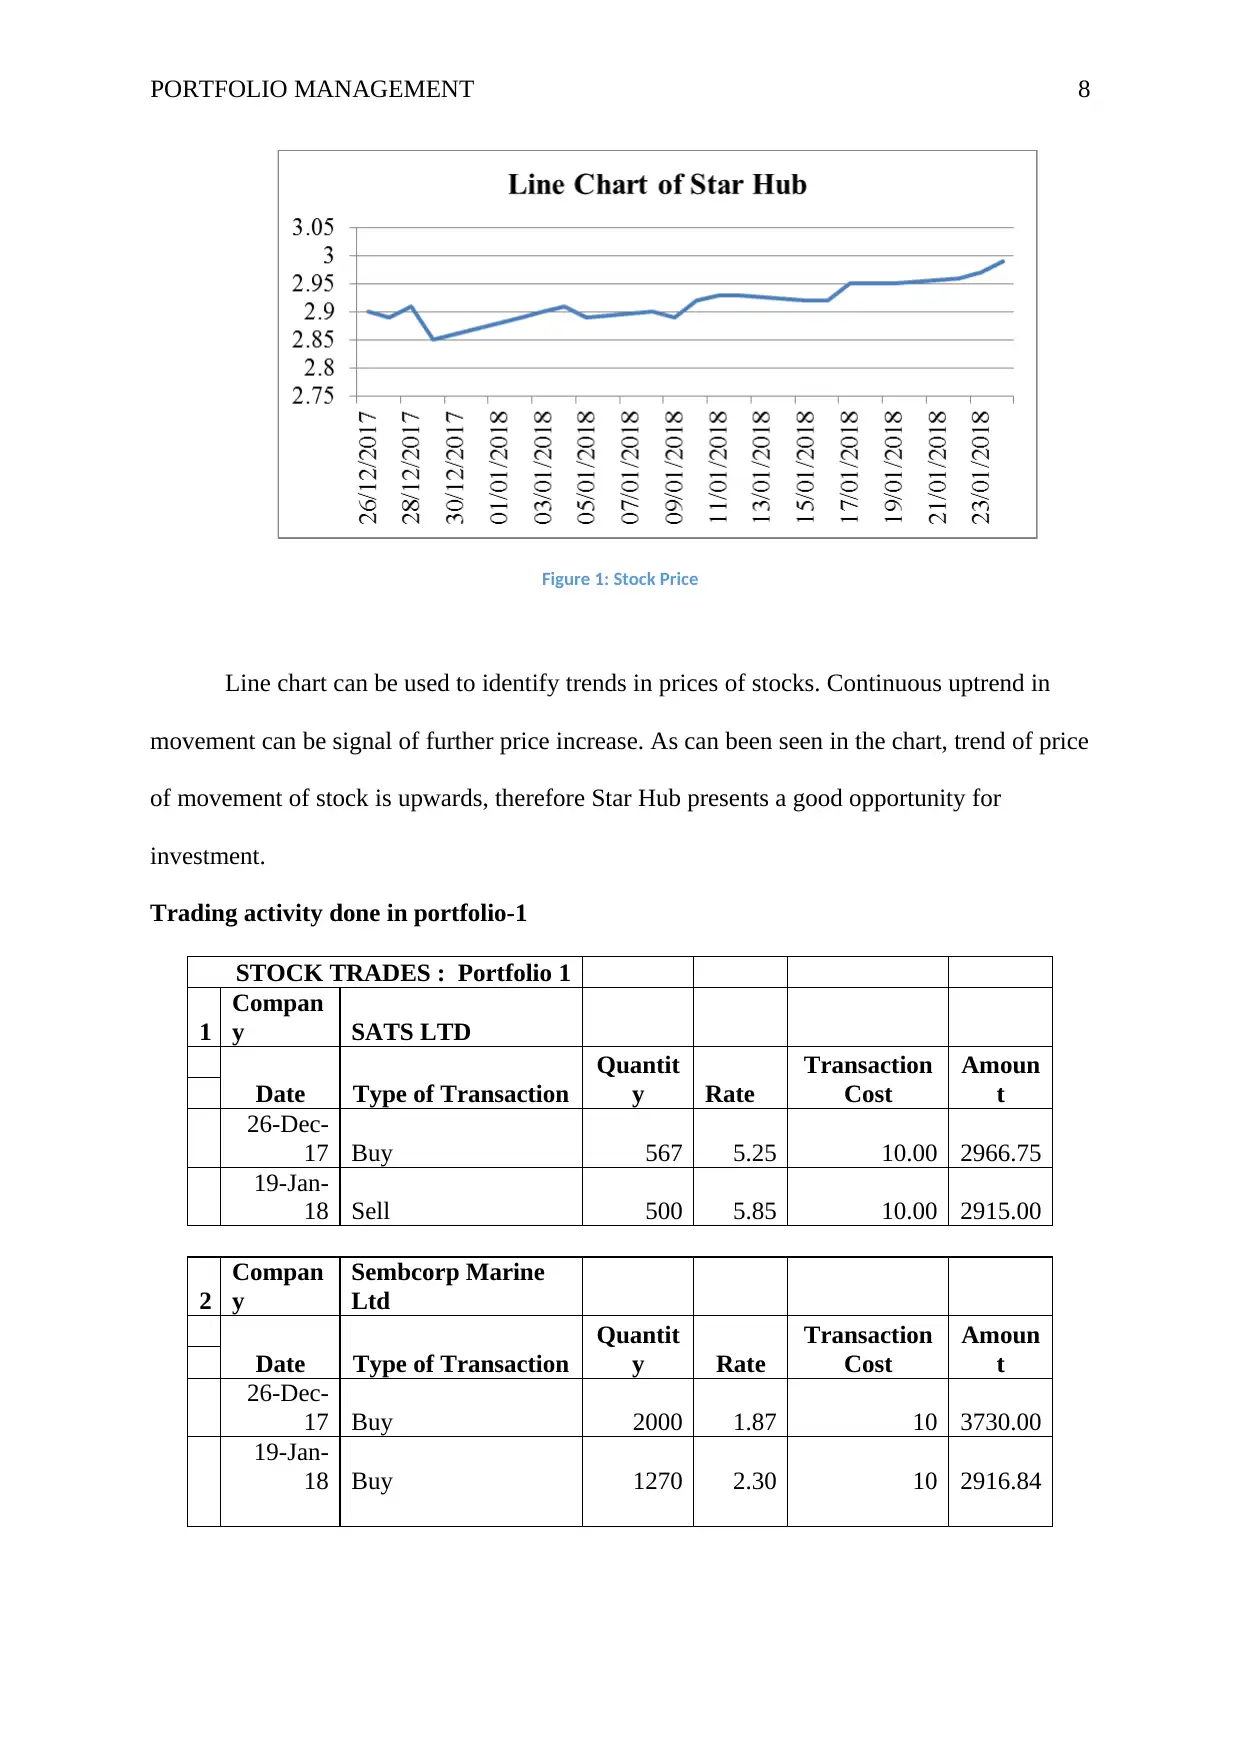
Figure 1: Stock Price
Line chart can be used to identify trends in prices of stocks. Continuous uptrend in
movement can be signal of further price increase. As can been seen in the chart, trend of price
of movement of stock is upwards, therefore Star Hub presents a good opportunity for
investment.
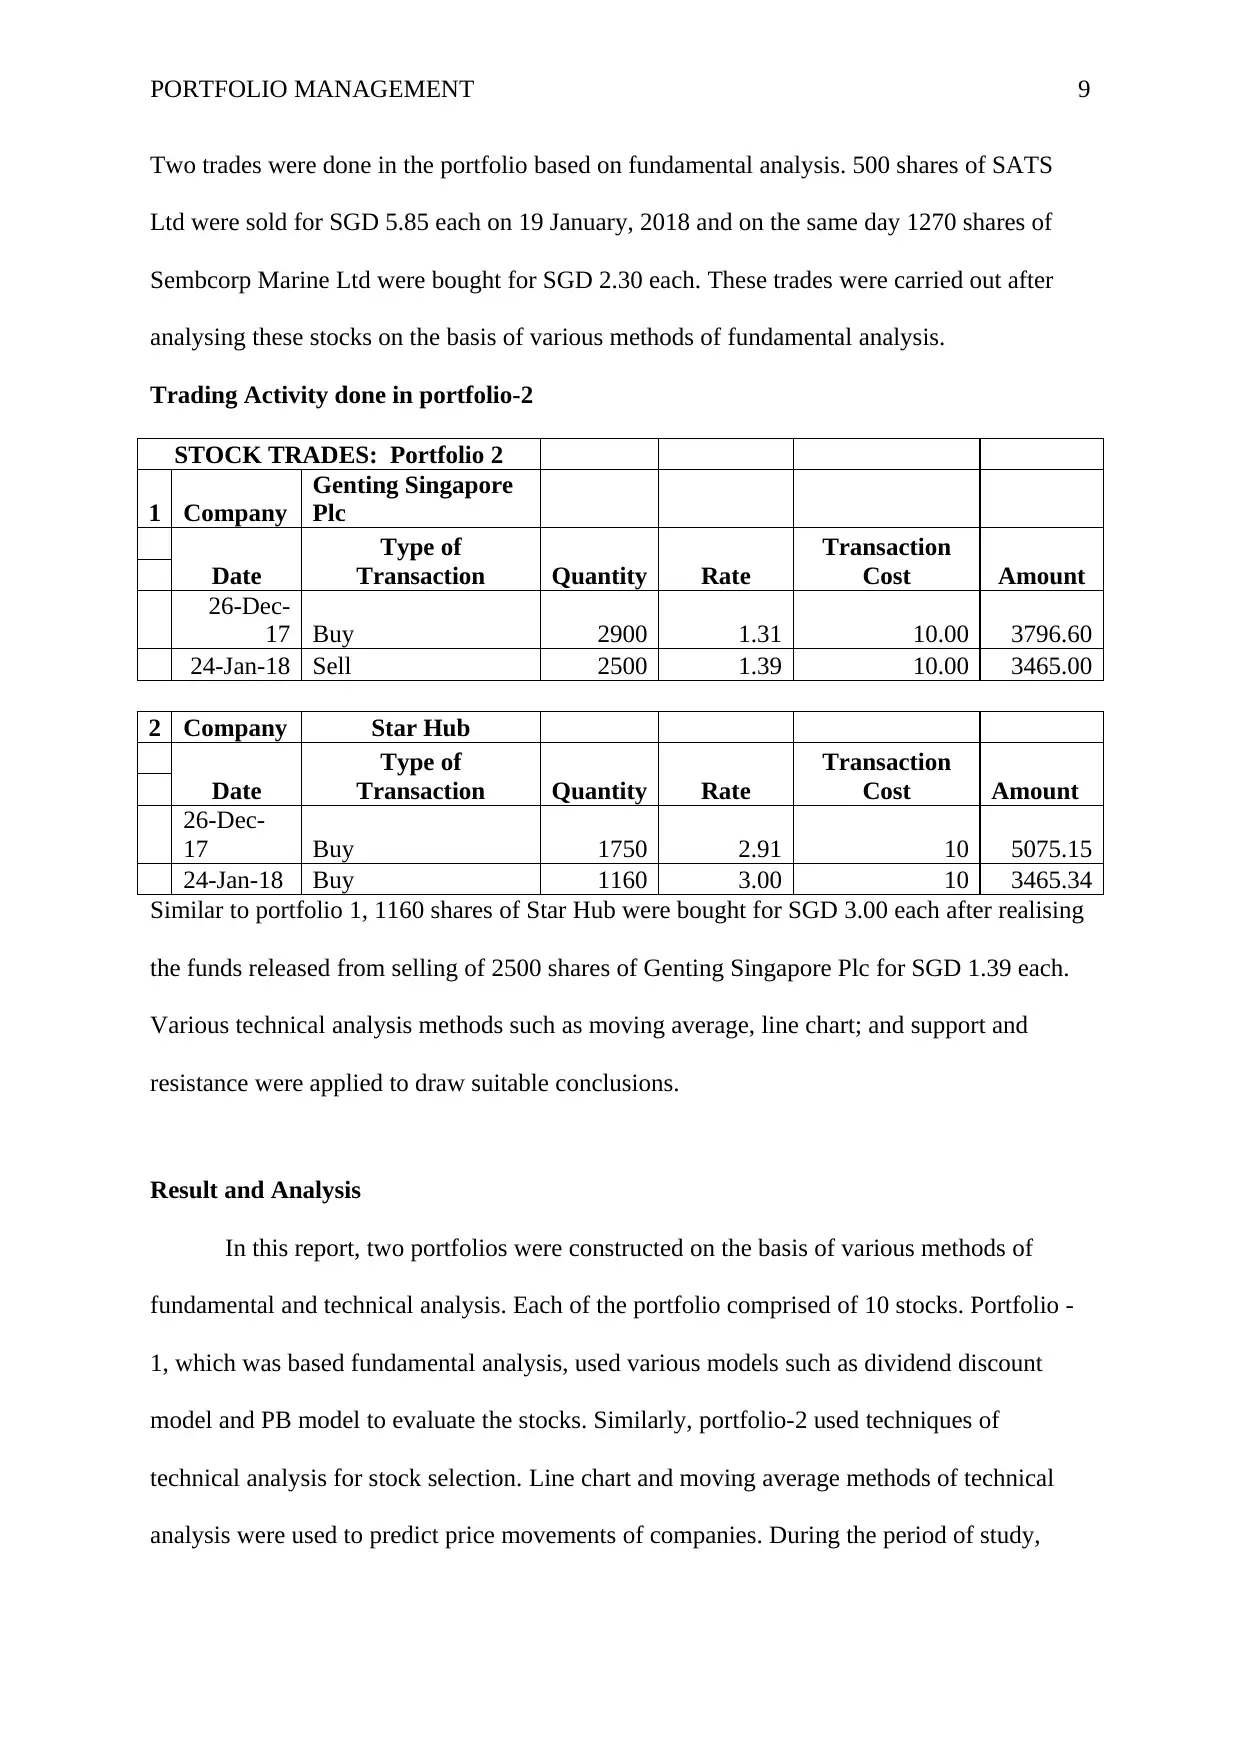
Trading activity done in portfolio-1
STOCK TRADES : Portfolio 1
1
Compan
y SATS LTD
Date Type of Transaction
Quantit
y Rate
Transaction
Cost
Amoun
t
26-Dec-
17 Buy 567 5.25 10.00 2966.75
19-Jan-
18 Sell 500 5.85 10.00 2915.00
2
Compan
y
Sembcorp Marine
Ltd
Date Type of Transaction
Quantit
y Rate
Transaction
Cost
Amoun
t
26-Dec-
17 Buy 2000 1.87 10 3730.00
19-Jan-
18 Buy 1270 2.30 10 2916.84
Figure 1: Stock Price
Line chart can be used to identify trends in prices of stocks. Continuous uptrend in
movement can be signal of further price increase. As can been seen in the chart, trend of price
of movement of stock is upwards, therefore Star Hub presents a good opportunity for
investment.
Trading activity done in portfolio-1
STOCK TRADES : Portfolio 1
1
Compan
y SATS LTD
Date Type of Transaction
Quantit
y Rate
Transaction
Cost
Amoun
t
26-Dec-
17 Buy 567 5.25 10.00 2966.75
19-Jan-
18 Sell 500 5.85 10.00 2915.00
2
Compan
y
Sembcorp Marine
Ltd
Date Type of Transaction
Quantit
y Rate
Transaction
Cost
Amoun
t
26-Dec-
17 Buy 2000 1.87 10 3730.00
19-Jan-
18 Buy 1270 2.30 10 2916.84
PORTFOLIO MANAGEMENT 9
Two trades were done in the portfolio based on fundamental analysis. 500 shares of SATS
Ltd were sold for SGD 5.85 each on 19 January, 2018 and on the same day 1270 shares of
Sembcorp Marine Ltd were bought for SGD 2.30 each. These trades were carried out after
analysing these stocks on the basis of various methods of fundamental analysis.
Trading Activity done in portfolio-2
STOCK TRADES: Portfolio 2
1 Company
Genting Singapore
Plc
Date
Type of
Transaction Quantity Rate
Transaction
Cost Amount
26-Dec-
17 Buy 2900 1.31 10.00 3796.60
24-Jan-18 Sell 2500 1.39 10.00 3465.00
2 Company Star Hub
Date
Type of
Transaction Quantity Rate
Transaction
Cost Amount
26-Dec-
17 Buy 1750 2.91 10 5075.15
24-Jan-18 Buy 1160 3.00 10 3465.34
Similar to portfolio 1, 1160 shares of Star Hub were bought for SGD 3.00 each after realising
the funds released from selling of 2500 shares of Genting Singapore Plc for SGD 1.39 each.
Various technical analysis methods such as moving average, line chart; and support and
resistance were applied to draw suitable conclusions.
Result and Analysis
In this report, two portfolios were constructed on the basis of various methods of
fundamental and technical analysis. Each of the portfolio comprised of 10 stocks. Portfolio -
1, which was based fundamental analysis, used various models such as dividend discount
model and PB model to evaluate the stocks. Similarly, portfolio-2 used techniques of
technical analysis for stock selection. Line chart and moving average methods of technical
analysis were used to predict price movements of companies. During the period of study,
⊘ This is a preview!⊘
Do you want full access?
Subscribe today to unlock all pages.
Trusted by 1+ million students worldwide
PORTFOLIO MANAGEMENT 10
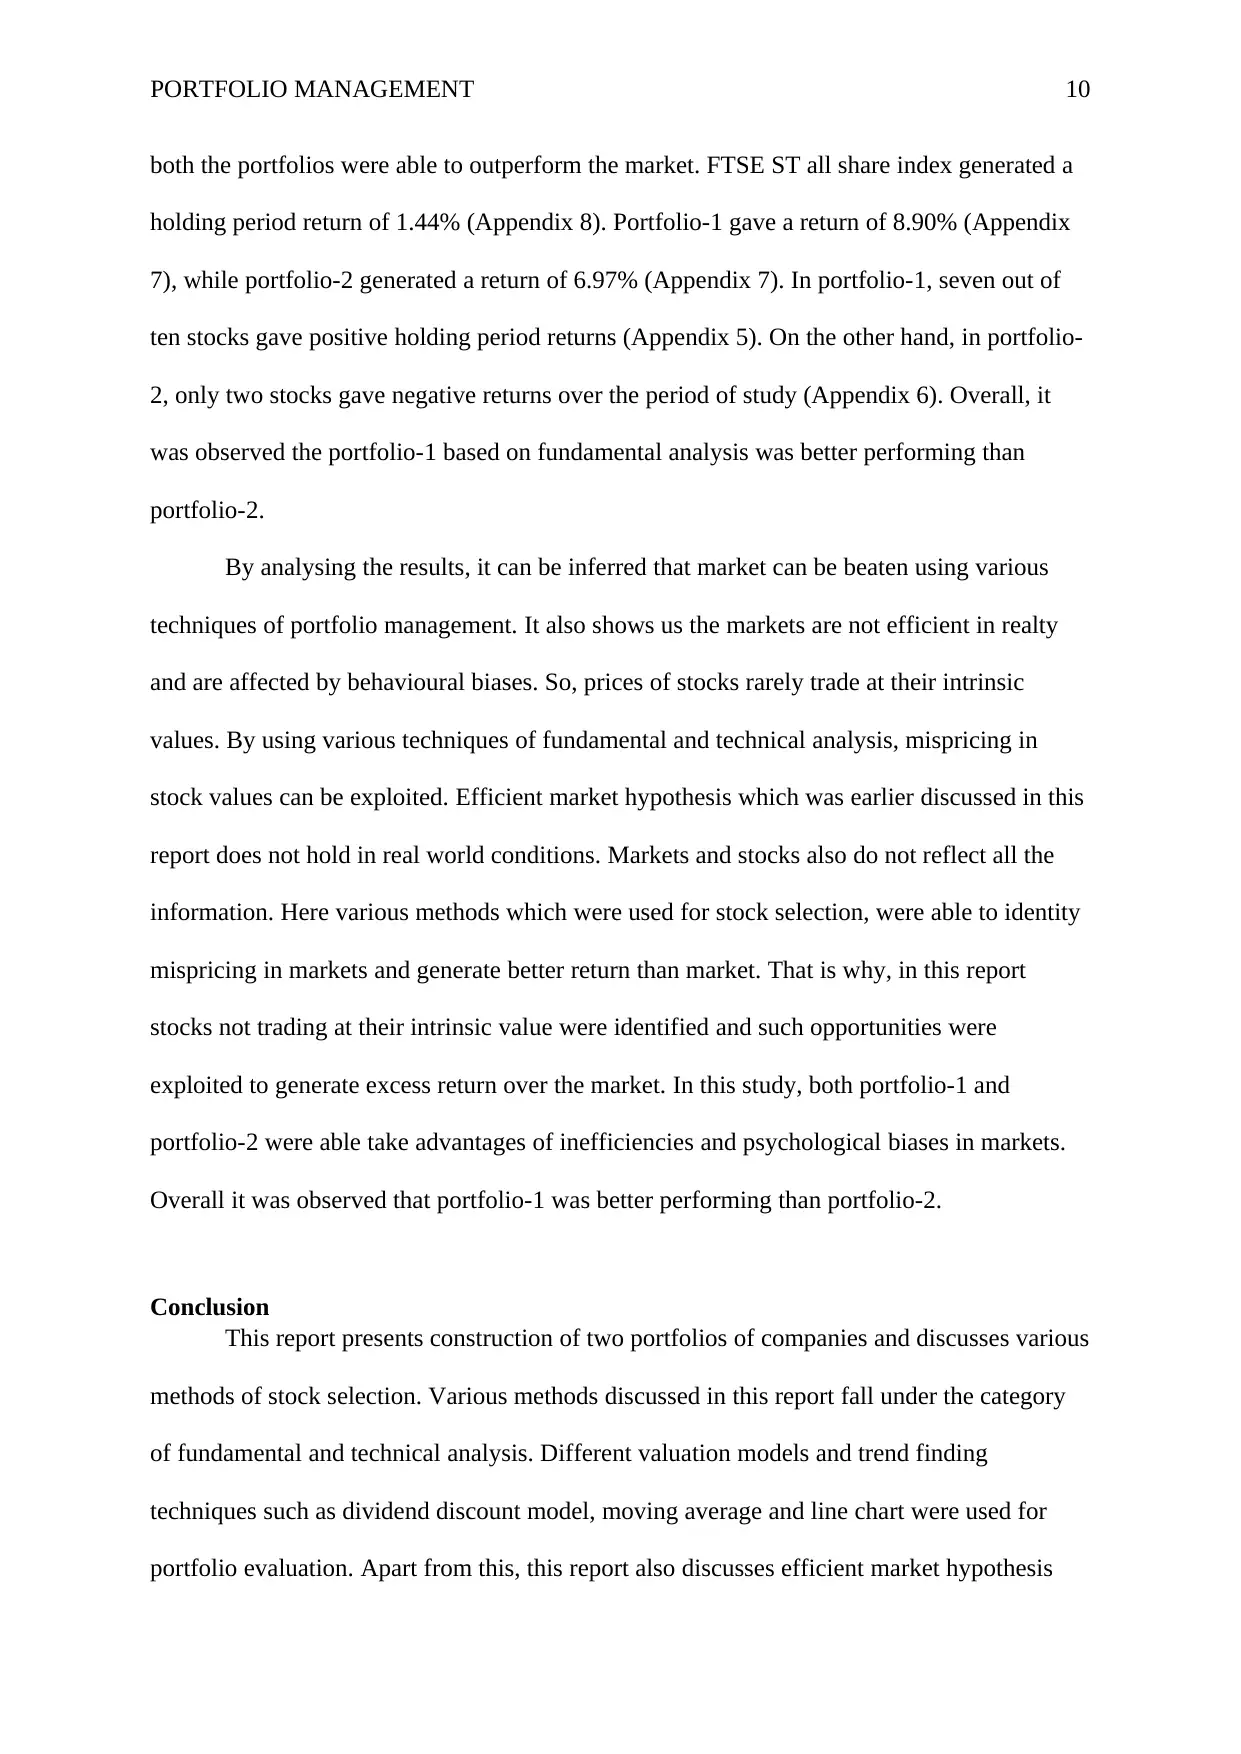
both the portfolios were able to outperform the market. FTSE ST all share index generated a
holding period return of 1.44% (Appendix 8). Portfolio-1 gave a return of 8.90% (Appendix
7), while portfolio-2 generated a return of 6.97% (Appendix 7). In portfolio-1, seven out of
ten stocks gave positive holding period returns (Appendix 5). On the other hand, in portfolio-
2, only two stocks gave negative returns over the period of study (Appendix 6). Overall, it
was observed the portfolio-1 based on fundamental analysis was better performing than
portfolio-2.
By analysing the results, it can be inferred that market can be beaten using various
techniques of portfolio management. It also shows us the markets are not efficient in realty
and are affected by behavioural biases. So, prices of stocks rarely trade at their intrinsic
values. By using various techniques of fundamental and technical analysis, mispricing in
stock values can be exploited. Efficient market hypothesis which was earlier discussed in this
report does not hold in real world conditions. Markets and stocks also do not reflect all the
information. Here various methods which were used for stock selection, were able to identity
mispricing in markets and generate better return than market. That is why, in this report
stocks not trading at their intrinsic value were identified and such opportunities were
exploited to generate excess return over the market. In this study, both portfolio-1 and
portfolio-2 were able take advantages of inefficiencies and psychological biases in markets.
Overall it was observed that portfolio-1 was better performing than portfolio-2.
Conclusion
This report presents construction of two portfolios of companies and discusses various
methods of stock selection. Various methods discussed in this report fall under the category
of fundamental and technical analysis. Different valuation models and trend finding
techniques such as dividend discount model, moving average and line chart were used for
portfolio evaluation. Apart from this, this report also discusses efficient market hypothesis
Paraphrase This Document
Need a fresh take? Get an instant paraphrase of this document with our AI Paraphraser
PORTFOLIO MANAGEMENT 11
and concepts behavioural finance. A view of conflict between EMH and behavioural finance
has also been provided in this with reference many global events such as financial crisis of
2008. It is rarely seen that markets are efficient and personal choices affect market behaviour.
Further, both the portfolios constructed on the basis of technical and fundamental analysis
were able be beat the market and generate a holding period return in excess of 5%. For the
period of study of 26 December, 2017 to 16 February, 2018 FTSE ST all share index
generated a return of 1.44% (Appendix 8). On the other hand portfolio-1 based on
fundamental analysis generated a return of 8.90% (Appendix 7) and portfolio-2 (Appendix 7)
gave a return of 6.97%. Portfolio-1 outperformed the market as well as portfolio-2.
PORTFOLIO MANAGEMENT 12
References
Akintoye, I. R. (2008). Efficient Market Hypothesis and Behavioural Finance: A Review of
Literature. European Journal of Social Sciences. 7(2), 7-17.
Baker, H.K. and Nofsinger, J.R. (2010). Behavioral Finance: Investors, Corporations, and
Markets. New Jersey, USA: John Wiley & Sons.
Brooks, J. C. (2005). Mastering technical analysis. Pennsylvania, USA :McGraw Hill
Professional.
Byrne, A. (2008). Behavioural finance: theories and evidence. The Research Foundation of
CFA Institute Literature Review. Retrieved from
https://www.cfapubs.org/doi/pdf/10.2470/rflr.v3.n1.1
Davidson, I. & Tippet, M. (2012). Principles of equity valuation. Abingdon, Oxon:
Routledge.
Forbes, W. (2009). Behavioral finance. Sussex, UK:John Wiley & Sons.
Grimes, A. (2012). The art and science of technical Analysis: Market Structure, price action
and trading strategies. New Jersey, USA: John Wiley & Sons.
Harder, S. (2010). The efficient market hypothesis and its applications to stock markets.
Norderstedt, Germany: GRIN Verlag.
Krantz, M. (2016). Fundamental analysis for dummies. New Jersey, USA: John Wiley &
Sons.
⊘ This is a preview!⊘
Do you want full access?
Subscribe today to unlock all pages.
Trusted by 1+ million students worldwide
1 out of 18
Related Documents


Your All-in-One AI-Powered Toolkit for Academic Success.
+13062052269
info@desklib.com
Available 24*7 on WhatsApp / Email
![[object Object]](/_next/static/media/star-bottom.7253800d.svg)
Unlock your academic potential
Copyright © 2020–2026 A2Z Services. All Rights Reserved. Developed and managed by ZUCOL.