Portfolio Construction: Business Statistics and Data Analysis
VerifiedAdded on  2022/08/26
|10
|1589
|84
Project
AI Summary
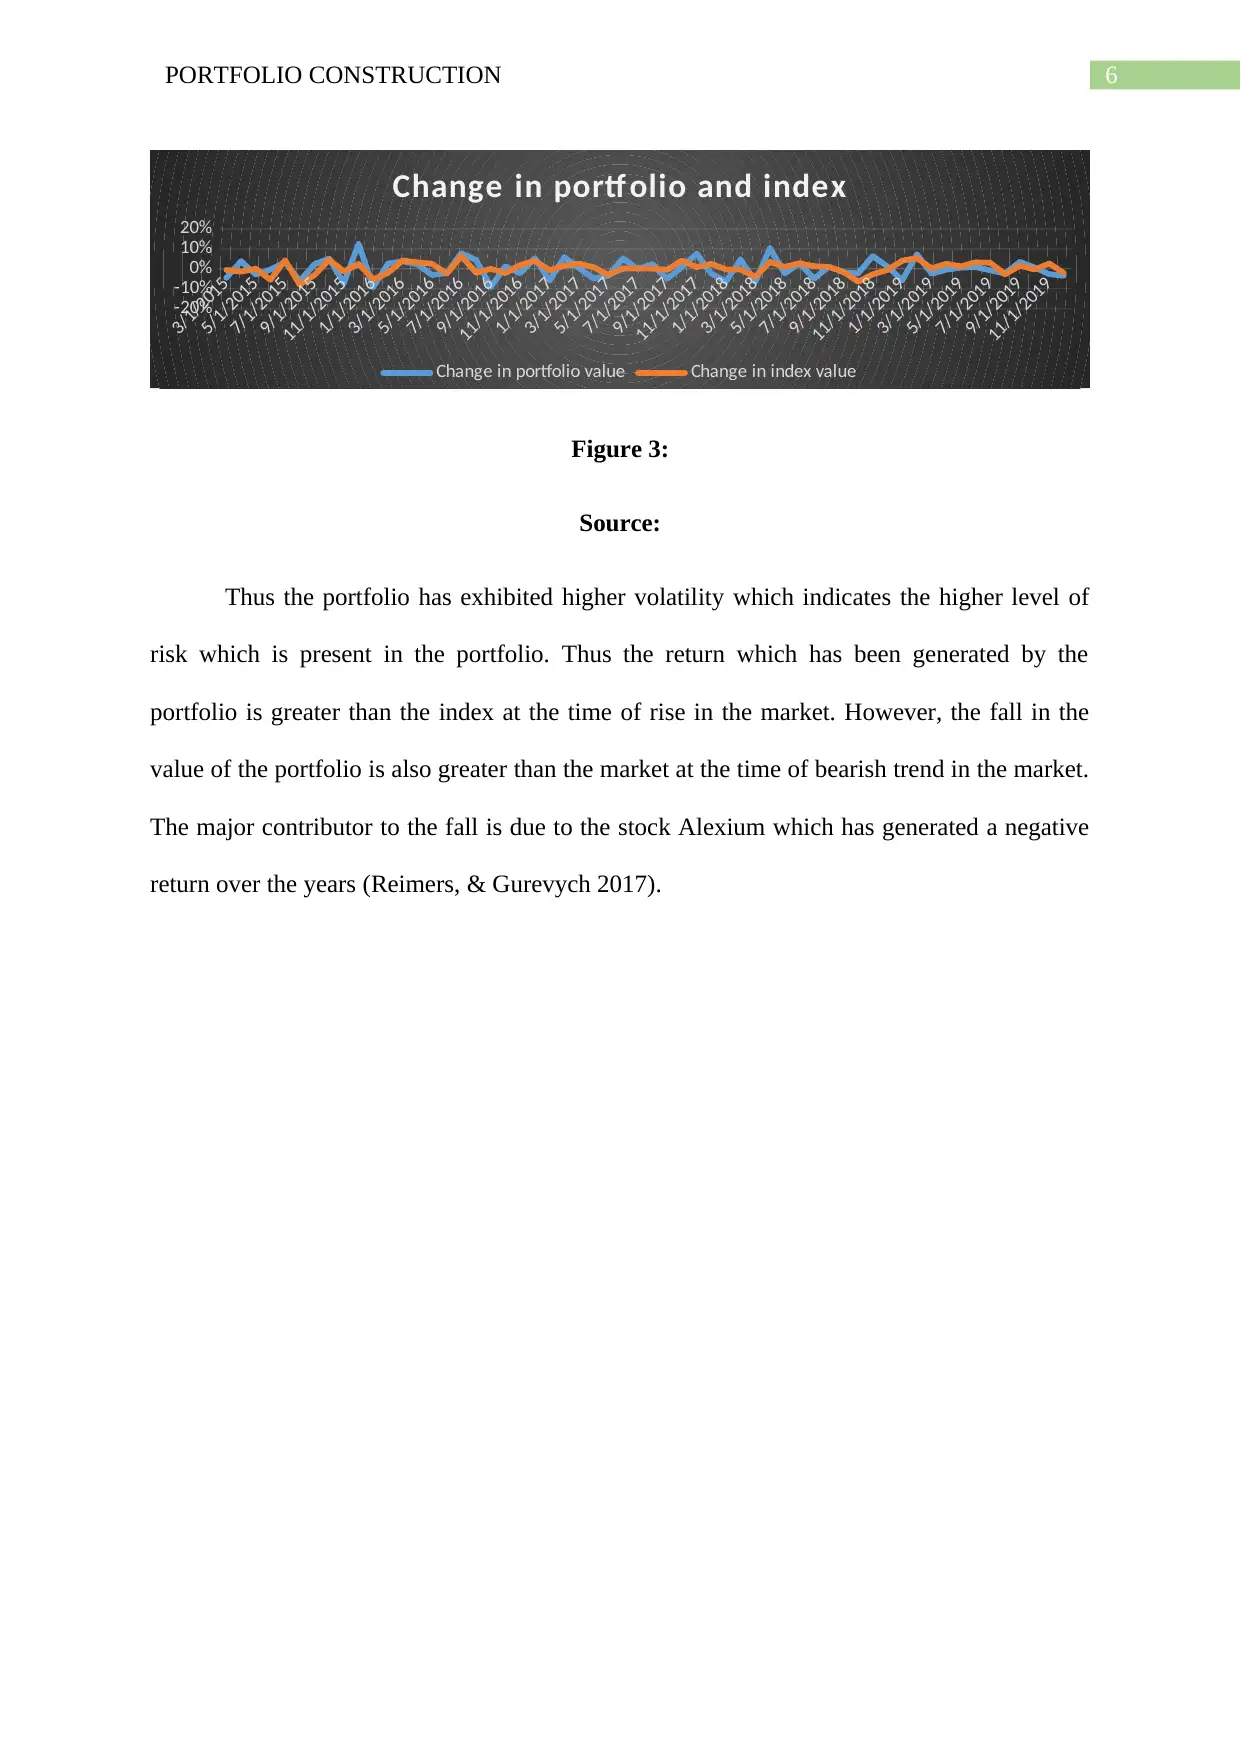
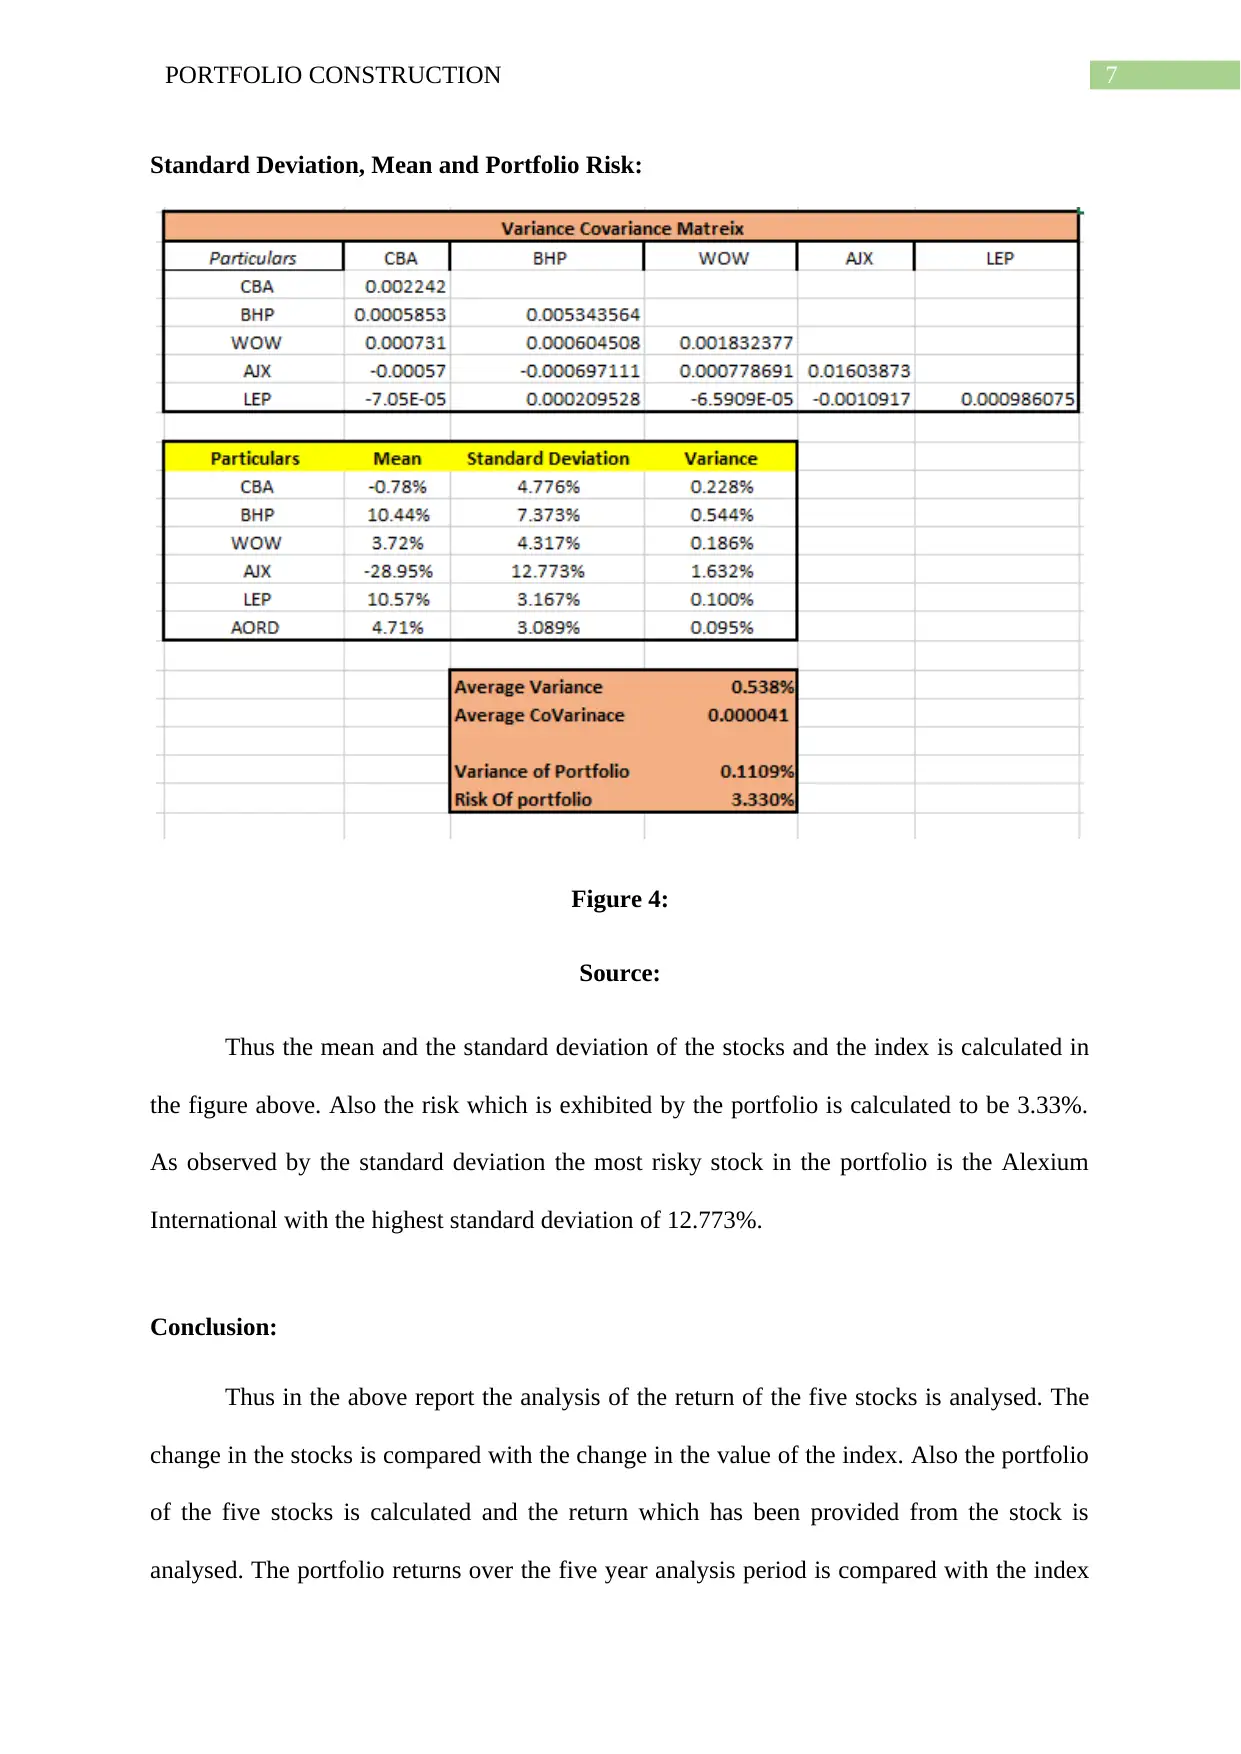
This project analyzes the construction and performance of a stock portfolio comprising five ASX-listed companies across various sectors. The student selected companies from the banking, mining, and food and staples industries, alongside an international share and a company of personal interest. The project involved collecting five years of monthly share price data for each company and the ASX200 index, calculating monthly percentage changes, and graphing the data for comparison. The portfolio's performance was evaluated against the index, with statistical analysis including mean, standard deviation, and risk assessment. The findings revealed the portfolio's volatility and its correlation with market trends, highlighting the impact of individual stock performance on overall portfolio returns. The project underscores the importance of diversification and risk management in investment strategies, providing a practical application of business statistics and data analysis in a financial context. The project concludes with a comparison of portfolio returns versus index returns and an analysis of the portfolio's risk profile and standard deviation.

Running head: PORTFOLIO CONSTRUCTION
Portfolio Construction
Name of the Student:
Name of the University:
Author Note:
Portfolio Construction
Name of the Student:
Name of the University:
Author Note:
Paraphrase This Document
Need a fresh take? Get an instant paraphrase of this document with our AI Paraphraser

1PORTFOLIO CONSTRUCTION
Table of Contents
Introduction:...............................................................................................................................2
Discussion:.................................................................................................................................2
Information about the Companies:.........................................................................................2
The Change in the share price of the five companies:...........................................................4
Construction of Portfolio:......................................................................................................4
Portfolio return VS Index Return:..........................................................................................5
Standard Deviation, Mean and Portfolio Risk:......................................................................6
Conclusion:................................................................................................................................7
References:.................................................................................................................................8

2PORTFOLIO CONSTRUCTION
Introduction:
The following report consists of the analysis of the historical returns of five ASX
listed companies which belong to different industries. The five companies which are selected
is listed in the following points.
ï‚· Commonwealth Bank of Australia.
ï‚· BHP Billiton Limited
ï‚· Wools-worth Group Limited
ï‚· Alexium International Group Limited
ï‚· Lepidico Limited.
The historical share price for these company is selected for a period of past 5 years
and the percentage change in each of the share price is calculated. The graph of the
percentage change over the months is provided. A portfolio consisting of all the listed stocks
is constructed with equal weights and the return of the portfolio with the index return is
analysed.
Discussion:
Information about the Companies:
The commonwealth bank of Australia is a company which is related to the finance
industry. It is one of the oldest operating banks in Australia, and provides financial services
to the residents of Australia, New Zealand and the United States. The bank accepts deposits
and performs all functions which are important for a banking company. The total assets
which are with the bank is around A$ 976.374 billion, while the net income which was
generated by the bank was A$ 9.881 billion.
⊘ This is a preview!⊘
Do you want full access?
Subscribe today to unlock all pages.

Trusted by 1+ million students worldwide

3PORTFOLIO CONSTRUCTION
The BHP Billiton is an Australian company which has its head office located in
Melbourne, Australia. The company is involved in the mining industry and was founded
more than a century ago. The main operation of the company is to provide mining
infrastructure to exploration companies all over Australia and also in other continents. The
company has assets worth 111.993 Billion Australian dollars and is one of the oldest listed
company in the Australian stock exchange.
The company Woolworths is a major Australian company which is serving the FMCG
industry in Australia. The company is the second largest in Australia and has its operations in
New Zealand. The company is around a century old when it was formed and has major retail
outlets in the country. The company has its head office in New South Wales with an annual
income of 2.326 billion Australian Dollars.
The company Alexium International Holding Limited is a company which was
formed in the year 2009. The company has its presence in the United States and is deemed as
an international Share. The company caters to the textile industry providing fire retardant
technology to the industry. The company was formed with the help of US Department of
defence. The company is focused in providing fire retardant solutions and has a major
agreement with Duro Textiles.
The company Lepidico Limited is the share which is of personal choice and is
considered as a good investment. The company is focused in mining and exploration of
lithium which is one of the rare metals. The company boasts the ownership of the L Max
process technology which can mine Lithium from less concentrated minerals and also can
mine the by products which are valuable in the process. The company plans to expand
operations from mining to manufacturing batteries which are Lithium Based. Thus since with
the advent of using environment friendly vehicles which run on Lithium based battery. The
Paraphrase This Document
Need a fresh take? Get an instant paraphrase of this document with our AI Paraphraser

4PORTFOLIO CONSTRUCTION
company is expected to have an increase in revenue and sales in future as the popularity of
electric vehicle increases.
The Change in the share price of the five companies:
The percentage change of the stocks over the 5 year analysis period for the five stocks
is highlighted in the figure below,
1/1/2015
4/1/2015
7/1/2015
10/1/2015
1/1/2016
4/1/2016
7/1/2016
10/1/2016
1/1/2017
4/1/2017
7/1/2017
10/1/2017
1/1/2018
4/1/2018
7/1/2018
10/1/2018
1/1/2019
4/1/2019
7/1/2019
10/1/2019
-30.00%
-20.00%
-10.00%
0.00%
10.00%
20.00%
30.00%
40.00%
50.00%
60.00%
Percentage Change in Shares
% cahnege in CBA % cahnege in BHP % cahnege in WOW
% cahnege in AJX % cahnege in LEP % cahnege in AORD
Figure 1:
Source:
Thus upon looking on the graph it is observed that the stock of Alexium International
Limited has been volatile over the analysis period showing greater diversions from the index.
The stock price of Commonwealth Bank of Australia is observed to be moving at par with the
index and thus the volatility is observed to be less in the stock. The same trend is observed in
the stock of Woolworths and Lepidico Limited. However, the stock of BHP Billiton also
shows a volatility in the initial years which tends to get reduced (Davies, Kat & Lu 2016).
Thus the volatile stocks are considered to be Alexium International and BHP Billiton
while the remaining stocks tend to show the least volatility and trade as per the index.

5PORTFOLIO CONSTRUCTION
Construction of Portfolio:
Thus the portfolio consisting of the stocks in equal weights is constructed and the
value of the portfolio after five years is calculated in the figure below,
Figure 2:
Source:
Thus the portfolio has generated a return of -1% and the value of the portfolio has
fallen to $98999.177. Thus over the five year holding period the portfolio has generated a
negative return for the investor. However, the return which has been taken is the average of
the historical returns of the stocks which has been multiplied with each stock weights (Nayak,
Aghajamali Scotognella & Saha 2017).
Portfolio return VS Index Return:
The return on the value of the portfolio with the value of the index over analysis
period is presented in the graph below. The comparison is done to analyse the return which is
generated by the portfolio while if the same investment would had been made in the Index.
Thus, the following analysis is presented in the graph below,
⊘ This is a preview!⊘
Do you want full access?
Subscribe today to unlock all pages.

Trusted by 1+ million students worldwide

6PORTFOLIO CONSTRUCTION
3/1/2015
5/1/2015
7/1/2015
9/1/2015
11/1/2015
1/1/2016
3/1/2016
5/1/2016
7/1/2016
9/1/2016
11/1/2016
1/1/2017
3/1/2017
5/1/2017
7/1/2017
9/1/2017
11/1/2017
1/1/2018
3/1/2018
5/1/2018
7/1/2018
9/1/2018
11/1/2018
1/1/2019
3/1/2019
5/1/2019
7/1/2019
9/1/2019
11/1/2019
-20%
-10%
0%
10%
20%
Change in portf olio and index
Change in portfolio value Change in index value
Figure 3:
Source:
Thus the portfolio has exhibited higher volatility which indicates the higher level of
risk which is present in the portfolio. Thus the return which has been generated by the
portfolio is greater than the index at the time of rise in the market. However, the fall in the
value of the portfolio is also greater than the market at the time of bearish trend in the market.
The major contributor to the fall is due to the stock Alexium which has generated a negative
return over the years (Reimers, & Gurevych 2017).
Paraphrase This Document
Need a fresh take? Get an instant paraphrase of this document with our AI Paraphraser

7PORTFOLIO CONSTRUCTION
Standard Deviation, Mean and Portfolio Risk:
Figure 4:
Source:
Thus the mean and the standard deviation of the stocks and the index is calculated in
the figure above. Also the risk which is exhibited by the portfolio is calculated to be 3.33%.
As observed by the standard deviation the most risky stock in the portfolio is the Alexium
International with the highest standard deviation of 12.773%.
Conclusion:
Thus in the above report the analysis of the return of the five stocks is analysed. The
change in the stocks is compared with the change in the value of the index. Also the portfolio
of the five stocks is calculated and the return which has been provided from the stock is
analysed. The portfolio returns over the five year analysis period is compared with the index

8PORTFOLIO CONSTRUCTION
return over the five years. Also the standard deviation of the stocks and the portfolio is
calculated and the risk which is presented by the stocks and the portfolio is observed.
return over the five years. Also the standard deviation of the stocks and the portfolio is
calculated and the risk which is presented by the stocks and the portfolio is observed.
⊘ This is a preview!⊘
Do you want full access?
Subscribe today to unlock all pages.

Trusted by 1+ million students worldwide

9PORTFOLIO CONSTRUCTION
References:
Davies, R. J., Kat, H. M., & Lu, S. (2016). Fund of hedge funds portfolio selection: A
multiple-objective approach. In Derivatives and Hedge Funds (pp. 45-71). Palgrave
Macmillan, London.
Nayak, C., Aghajamali, A., Scotognella, F., & Saha, A. (2017). Effect of standard deviation,
strength of magnetic field and electron density on the photonic band gap of an
extrinsic disorder plasma photonic structure. Optical Materials, 72, 25-30.
Nayak, C., Aghajamali, A., Scotognella, F., & Saha, A. (2017). Effect of standard deviation,
strength of magnetic field and electron density on the photonic band gap of an
extrinsic disorder plasma photonic structure. Optical Materials, 72, 25-30.
Reimers, N., & Gurevych, I. (2017). Reporting score distributions makes a difference:
Performance study of lstm-networks for sequence tagging. arXiv preprint
arXiv:1707.09861.
Yahoo is now a part of Verizon Media. (2020). Retrieved 17 January 2020, from
https://au.finance.yahoo.com/quote/LPD.AX?p=LPD.AX&.tsrc=fin-srch
Yahoo is now a part of Verizon Media. (2020). Retrieved 17 January 2020, from
https://au.finance.yahoo.com/quote/CBA.AX?p=CBA.AX&.tsrc=fin-srch
Yahoo is now a part of Verizon Media. (2020). Retrieved 17 January 2020, from
https://au.finance.yahoo.com/quote/%5EAXJO?p=^AXJO
Yahoo is now a part of Verizon Media. (2020). Retrieved 17 January 2020, from
https://au.finance.yahoo.com/quote/WOW.AX?p=WOW.AX&.tsrc=fin-srch
1 out of 10
Related Documents

Your All-in-One AI-Powered Toolkit for Academic Success.
 +13062052269
info@desklib.com
Available 24*7 on WhatsApp / Email
Unlock your academic potential
Copyright © 2020–2025 A2Z Services. All Rights Reserved. Developed and managed by ZUCOL.