Analyzing Investment Strategies: Momentum Trading and CAPM Model
VerifiedAdded on 2023/06/18
|9
|2481
|154
Practical Assignment
AI Summary
This assignment delves into portfolio management, focusing on momentum trading strategies and the Capital Asset Pricing Model (CAPM). It examines the determinants of momentum trading performance, including high stock values, volatility, and price trends. The assignment calculates expected excess returns using CAPM for different stocks and determines the weight of stocks in optimal risky and passive portfolios. Furthermore, it evaluates Sharpe's measure for optimal portfolios and the contribution of active portfolios. The 'bet against beta' strategy is discussed, highlighting its use in identifying overpriced and underpriced assets based on their beta values. Finally, the assignment computes bond values within a portfolio, considering zero-coupon bonds and the impact of changing target durations, demonstrating how portfolio formulation can provide competitive advantages in terms of higher value and lower risk. Desklib provides students access to a wealth of solved assignments and study resources.

Portfolio Management
Paraphrase This Document
Need a fresh take? Get an instant paraphrase of this document with our AI Paraphraser

TABLE OF CONTENTS
QUESTION 2...................................................................................................................................3
a. Momentum trading strategy and determinants of its performance..........................................3
b...................................................................................................................................................3
QUESTION 3...................................................................................................................................5
a)..................................................................................................................................................5
b).................................................................................................................................................6
REFERENCES................................................................................................................................9
QUESTION 2
a. Momentum trading strategy and determinants of its performance
The momentum investing is a type of trading strategy wherein the investor purchases the
securities which is increasing and sell them when they think it has reached to its peak
(Momentum trading strategies, 2021). In addition to this, momentum measures the velocity of
the changes in price as being opposed to the actual price level. For example, if there is a need to
create a 10- day period momentum and it will be required to subtract closing price from 10 days
ago from the last closing price. This momentum trading strategy generally involves a good deal
of risk and it also has the ability to identify the different sectors quickly and accurately. The
major determinants of performance under momentum trading involves the following-
Look at the high- this is the first determinant as the stock and ETF which are being
continuously rising may be weekly or monthly (Vukovic and et.al., 2020). This is
necessary because of the reason that in case the price will be high then they will be
providing more profits.
Paying attention to volatility- the use of momentum trading strategy carries a high degree
of volatility in comparison to other strategies. This is particularly because of the reason
that in case the buying and selling of the security is not correctly timed then this will not
provide good profits to the company.
Assessing the price trends- this is another determinant through which performance of
momentum trading can be improved (Guo and Ou-Yang, 2021). This is particularly
because of the reason that when the price of over a period is being analysed then they can
identify the actual trend which is going for some period of time.
b
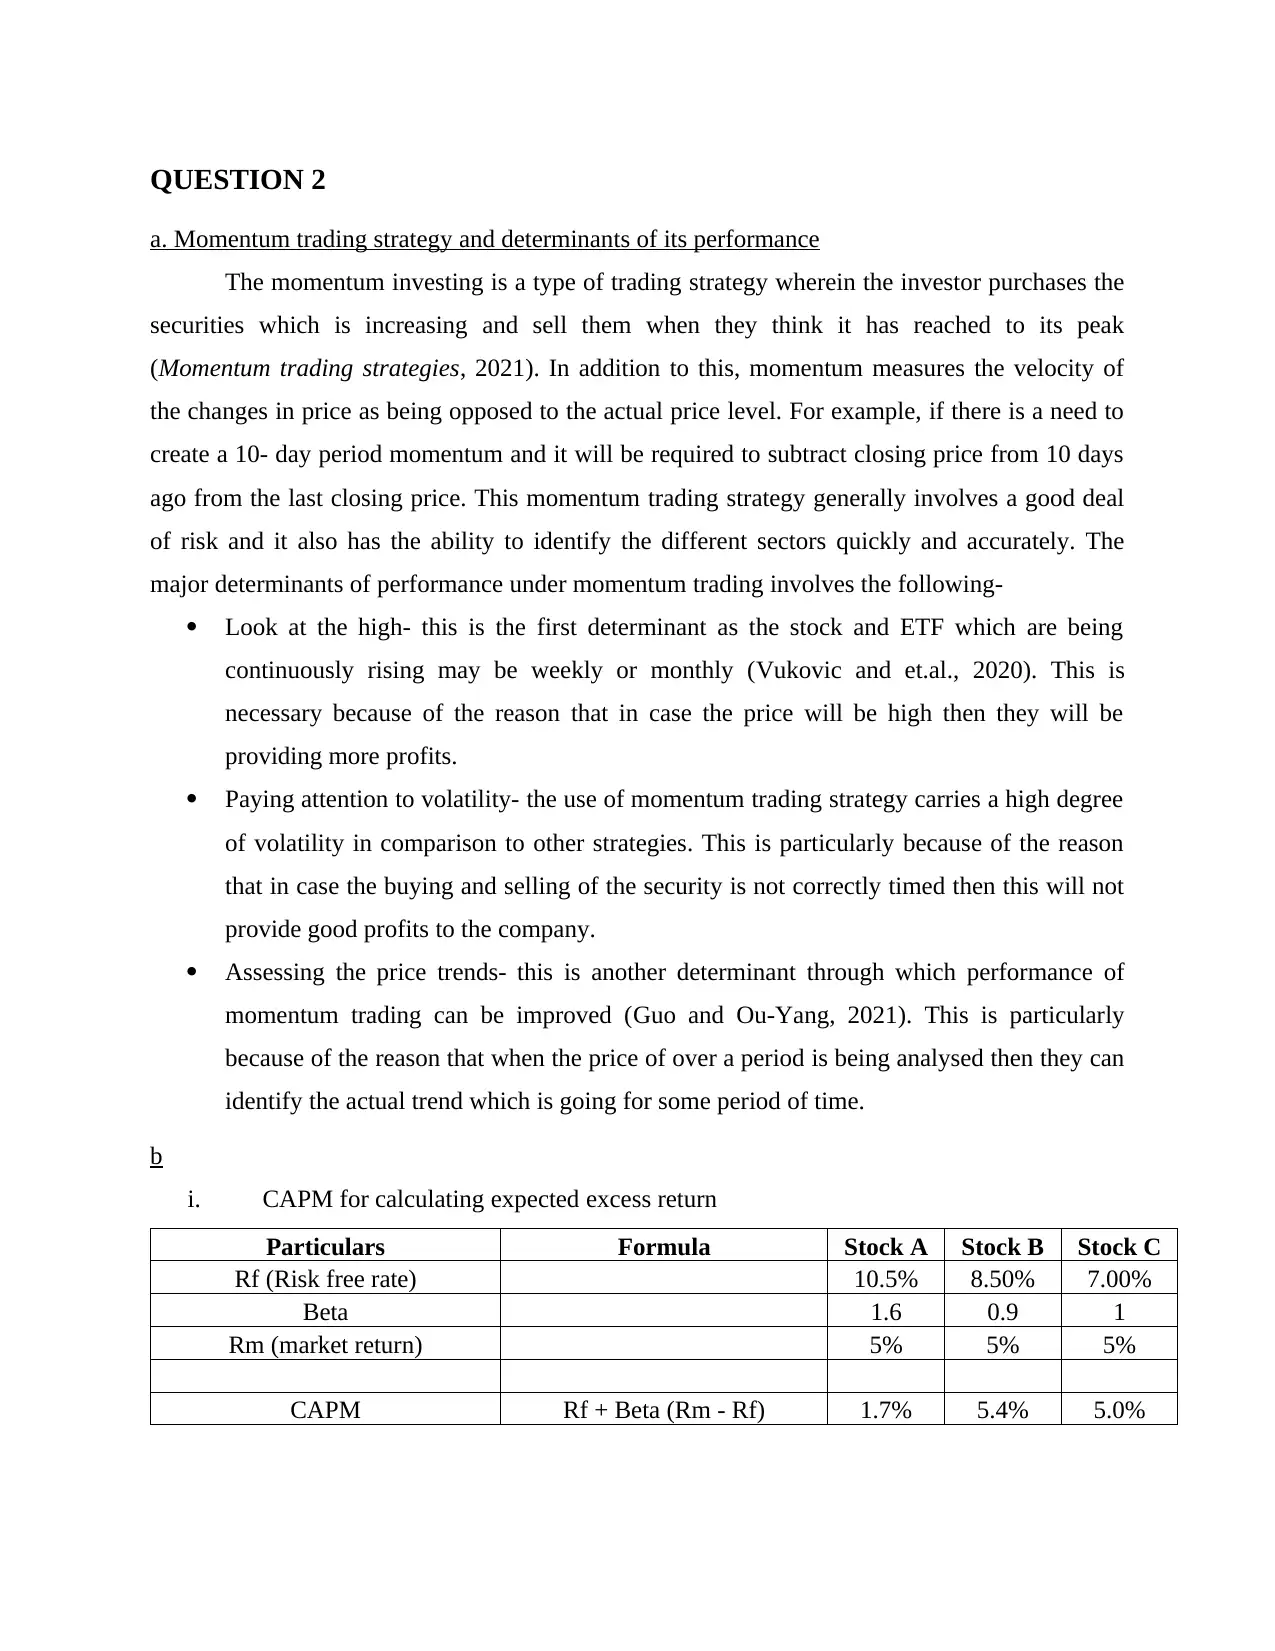
i. CAPM for calculating expected excess return
Particulars Formula Stock A Stock B Stock C
Rf (Risk free rate) 10.5% 8.50% 7.00%
Beta 1.6 0.9 1
Rm (market return) 5% 5% 5%
CAPM Rf + Beta (Rm - Rf) 1.7% 5.4% 5.0%
a. Momentum trading strategy and determinants of its performance
The momentum investing is a type of trading strategy wherein the investor purchases the
securities which is increasing and sell them when they think it has reached to its peak
(Momentum trading strategies, 2021). In addition to this, momentum measures the velocity of
the changes in price as being opposed to the actual price level. For example, if there is a need to
create a 10- day period momentum and it will be required to subtract closing price from 10 days
ago from the last closing price. This momentum trading strategy generally involves a good deal
of risk and it also has the ability to identify the different sectors quickly and accurately. The
major determinants of performance under momentum trading involves the following-
Look at the high- this is the first determinant as the stock and ETF which are being
continuously rising may be weekly or monthly (Vukovic and et.al., 2020). This is
necessary because of the reason that in case the price will be high then they will be
providing more profits.
Paying attention to volatility- the use of momentum trading strategy carries a high degree
of volatility in comparison to other strategies. This is particularly because of the reason
that in case the buying and selling of the security is not correctly timed then this will not
provide good profits to the company.
Assessing the price trends- this is another determinant through which performance of
momentum trading can be improved (Guo and Ou-Yang, 2021). This is particularly
because of the reason that when the price of over a period is being analysed then they can
identify the actual trend which is going for some period of time.
b
i. CAPM for calculating expected excess return
Particulars Formula Stock A Stock B Stock C
Rf (Risk free rate) 10.5% 8.50% 7.00%
Beta 1.6 0.9 1
Rm (market return) 5% 5% 5%
CAPM Rf + Beta (Rm - Rf) 1.7% 5.4% 5.0%
⊘ This is a preview!⊘
Do you want full access?
Subscribe today to unlock all pages.
Trusted by 1+ million students worldwide
The capital asset pricing model is a method which is used to determine the rate of return
which is required to make the decision relating to the asset. This simply describes the
relationship among the systematic risk and the expected return for the asset. For choosing the
investment option wisely it is very crucial for the business that they effectively analyse all the
options of investment and then select the best. With the analysis of above calculation, it is clear
that the CAPM of stock B is highest and this implies that the investment must be undertaken in
the stock B and no other options (Meeker, 2019). This is particularly because of the reason that
CAPM provides a more useful and relevant outcome. In addition to this, CAPM is based on two
different assumptions that is it is presumed that financial market is populated with highly
sophisticated and well informed sellers and buyers. On the other side, second assumption states
that investors caring about the wealth and prefer more to less.
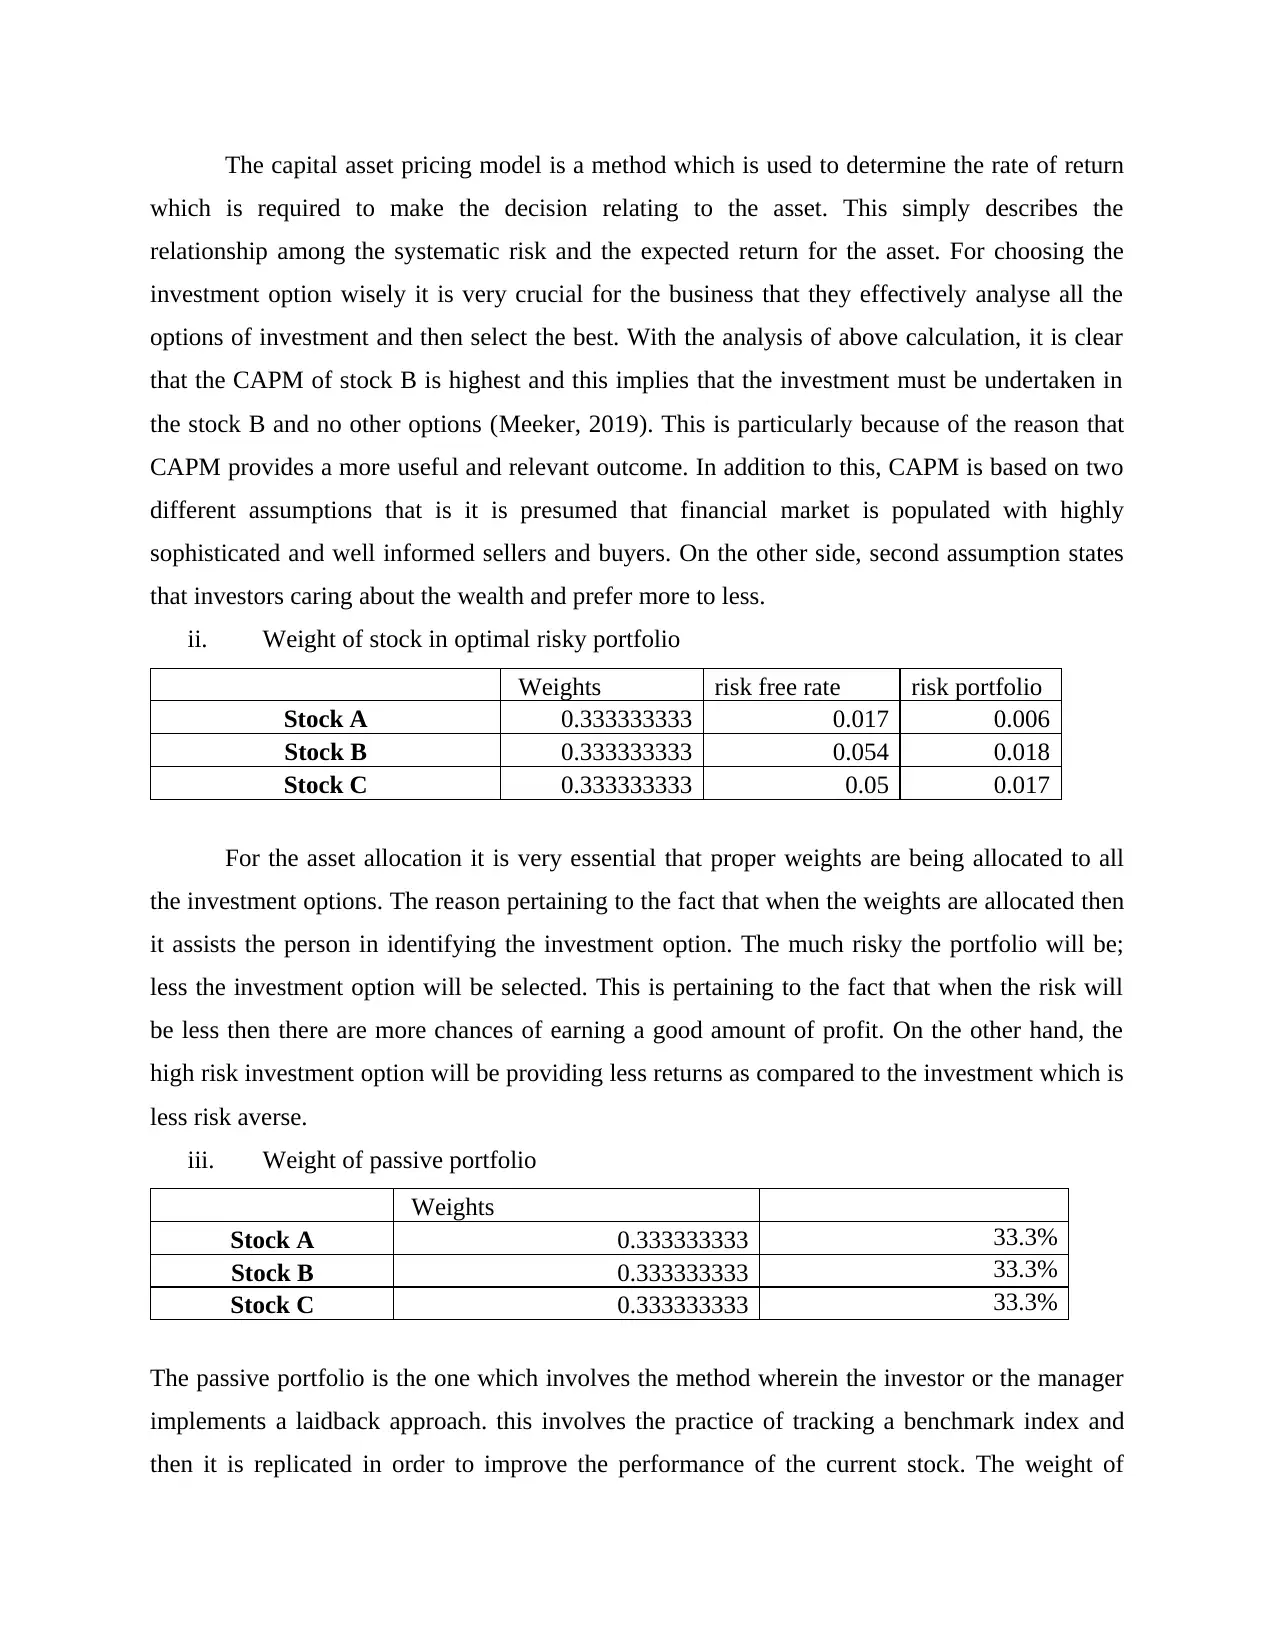
ii. Weight of stock in optimal risky portfolio
Weights risk free rate risk portfolio
Stock A 0.333333333 0.017 0.006
Stock B 0.333333333 0.054 0.018
Stock C 0.333333333 0.05 0.017
For the asset allocation it is very essential that proper weights are being allocated to all
the investment options. The reason pertaining to the fact that when the weights are allocated then
it assists the person in identifying the investment option. The much risky the portfolio will be;
less the investment option will be selected. This is pertaining to the fact that when the risk will
be less then there are more chances of earning a good amount of profit. On the other hand, the
high risk investment option will be providing less returns as compared to the investment which is
less risk averse.
iii. Weight of passive portfolio
Weights
Stock A 0.333333333 33.3%
Stock B 0.333333333 33.3%
Stock C 0.333333333 33.3%
The passive portfolio is the one which involves the method wherein the investor or the manager
implements a laidback approach. this involves the practice of tracking a benchmark index and
then it is replicated in order to improve the performance of the current stock. The weight of
which is required to make the decision relating to the asset. This simply describes the
relationship among the systematic risk and the expected return for the asset. For choosing the
investment option wisely it is very crucial for the business that they effectively analyse all the
options of investment and then select the best. With the analysis of above calculation, it is clear
that the CAPM of stock B is highest and this implies that the investment must be undertaken in
the stock B and no other options (Meeker, 2019). This is particularly because of the reason that
CAPM provides a more useful and relevant outcome. In addition to this, CAPM is based on two
different assumptions that is it is presumed that financial market is populated with highly
sophisticated and well informed sellers and buyers. On the other side, second assumption states
that investors caring about the wealth and prefer more to less.
ii. Weight of stock in optimal risky portfolio
Weights risk free rate risk portfolio
Stock A 0.333333333 0.017 0.006
Stock B 0.333333333 0.054 0.018
Stock C 0.333333333 0.05 0.017
For the asset allocation it is very essential that proper weights are being allocated to all
the investment options. The reason pertaining to the fact that when the weights are allocated then
it assists the person in identifying the investment option. The much risky the portfolio will be;
less the investment option will be selected. This is pertaining to the fact that when the risk will
be less then there are more chances of earning a good amount of profit. On the other hand, the
high risk investment option will be providing less returns as compared to the investment which is
less risk averse.
iii. Weight of passive portfolio
Weights
Stock A 0.333333333 33.3%
Stock B 0.333333333 33.3%
Stock C 0.333333333 33.3%
The passive portfolio is the one which involves the method wherein the investor or the manager
implements a laidback approach. this involves the practice of tracking a benchmark index and
then it is replicated in order to improve the performance of the current stock. The weight of
Paraphrase This Document
Need a fresh take? Get an instant paraphrase of this document with our AI Paraphraser
passive portfolio is 33.33 % that is all the three stock may be taken as a portion of 33.33 % in
order to improve the performance of overall portfolio.
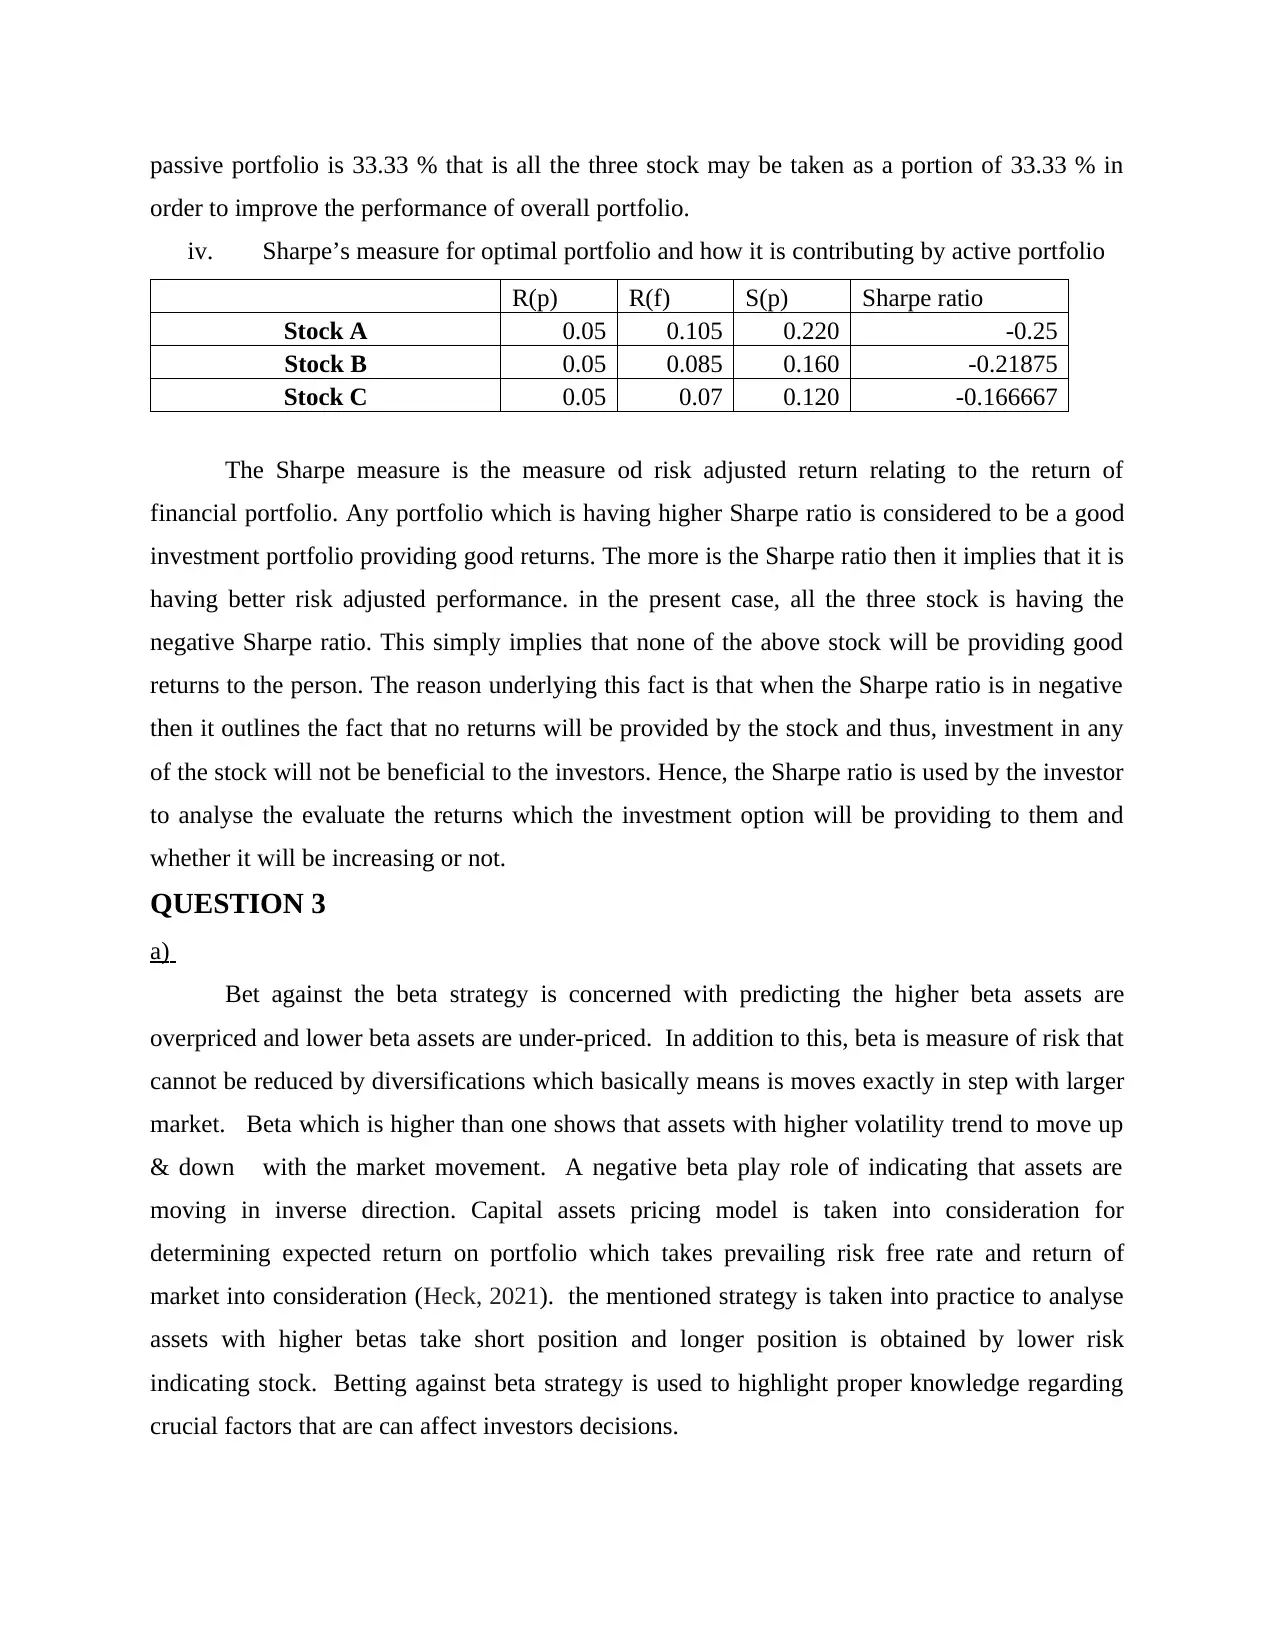
iv. Sharpe’s measure for optimal portfolio and how it is contributing by active portfolio
R(p) R(f) S(p) Sharpe ratio
Stock A 0.05 0.105 0.220 -0.25
Stock B 0.05 0.085 0.160 -0.21875
Stock C 0.05 0.07 0.120 -0.166667
The Sharpe measure is the measure od risk adjusted return relating to the return of
financial portfolio. Any portfolio which is having higher Sharpe ratio is considered to be a good
investment portfolio providing good returns. The more is the Sharpe ratio then it implies that it is
having better risk adjusted performance. in the present case, all the three stock is having the
negative Sharpe ratio. This simply implies that none of the above stock will be providing good
returns to the person. The reason underlying this fact is that when the Sharpe ratio is in negative
then it outlines the fact that no returns will be provided by the stock and thus, investment in any
of the stock will not be beneficial to the investors. Hence, the Sharpe ratio is used by the investor
to analyse the evaluate the returns which the investment option will be providing to them and
whether it will be increasing or not.
QUESTION 3
a)
Bet against the beta strategy is concerned with predicting the higher beta assets are
overpriced and lower beta assets are under-priced. In addition to this, beta is measure of risk that
cannot be reduced by diversifications which basically means is moves exactly in step with larger
market. Beta which is higher than one shows that assets with higher volatility trend to move up
& down with the market movement. A negative beta play role of indicating that assets are
moving in inverse direction. Capital assets pricing model is taken into consideration for
determining expected return on portfolio which takes prevailing risk free rate and return of
market into consideration (Heck, 2021). the mentioned strategy is taken into practice to analyse
assets with higher betas take short position and longer position is obtained by lower risk
indicating stock. Betting against beta strategy is used to highlight proper knowledge regarding
crucial factors that are can affect investors decisions.
order to improve the performance of overall portfolio.
iv. Sharpe’s measure for optimal portfolio and how it is contributing by active portfolio
R(p) R(f) S(p) Sharpe ratio
Stock A 0.05 0.105 0.220 -0.25
Stock B 0.05 0.085 0.160 -0.21875
Stock C 0.05 0.07 0.120 -0.166667
The Sharpe measure is the measure od risk adjusted return relating to the return of
financial portfolio. Any portfolio which is having higher Sharpe ratio is considered to be a good
investment portfolio providing good returns. The more is the Sharpe ratio then it implies that it is
having better risk adjusted performance. in the present case, all the three stock is having the
negative Sharpe ratio. This simply implies that none of the above stock will be providing good
returns to the person. The reason underlying this fact is that when the Sharpe ratio is in negative
then it outlines the fact that no returns will be provided by the stock and thus, investment in any
of the stock will not be beneficial to the investors. Hence, the Sharpe ratio is used by the investor
to analyse the evaluate the returns which the investment option will be providing to them and
whether it will be increasing or not.
QUESTION 3
a)
Bet against the beta strategy is concerned with predicting the higher beta assets are
overpriced and lower beta assets are under-priced. In addition to this, beta is measure of risk that
cannot be reduced by diversifications which basically means is moves exactly in step with larger
market. Beta which is higher than one shows that assets with higher volatility trend to move up
& down with the market movement. A negative beta play role of indicating that assets are
moving in inverse direction. Capital assets pricing model is taken into consideration for
determining expected return on portfolio which takes prevailing risk free rate and return of
market into consideration (Heck, 2021). the mentioned strategy is taken into practice to analyse
assets with higher betas take short position and longer position is obtained by lower risk
indicating stock. Betting against beta strategy is used to highlight proper knowledge regarding
crucial factors that are can affect investors decisions.
Betting against beta is type of low risk investing which can be understood by highlighting
CAPM model. This model states that security's expected rate of return should be proportional to
its beta. For instance- if stock A has beta of 0.7 and B has 1.4 which provide assistance in
understanding that on security two return is twice. It can be interpreted that so called securities
market line is flatter than expected. Securities with less beta actually provides greater return than
the previously made prediction regarding the same. This specific strategy helps in getting the
appropriate knowledge regarding the portfolio. It can find the strategy that buy high beta stocks
& sells low beta stocks has crucial adverse unconditional capital assets pricing model that pay to
bet against beta.
There are various factors which can be taken into consideration for determinants of its
performance (Agliardi and Agliardi, 2021). In addition to this, CAPM model is used to
determine a theoretically proper required rate of return for having significant decision about
adding assets to well diversified portfolio. The specified strategy can be taken into consideration
to make proper assessment of risk management which aid in determining the origins of gain. The
specified strategy includes buying low and selling high beta stock for choosing weights such that
ex ante of strategy is zero. There is involvement of analysing excess return of market over risk
free rate and high book to market stocks in excess of low book value. In addition to this, it is
important approach that helps in getting proper data regarding stock value through analysing beta
which indicates risk associated with it. This is widely taken into process to have proper
evaluation in pattern to get of performance of portfolio (Pegoraro and Montagna, 2021). These
mentioned determinants can be used to make proper ascertainment of betting against beta
strategy that provides guidance in having proper aspect regarding beta which affects the
processing of firm. On the basis of above provided data it can be evaluated CAPM is highly
useful in achieving knowledge regarding beta to set strategy for accomplishing purpose of
investors.
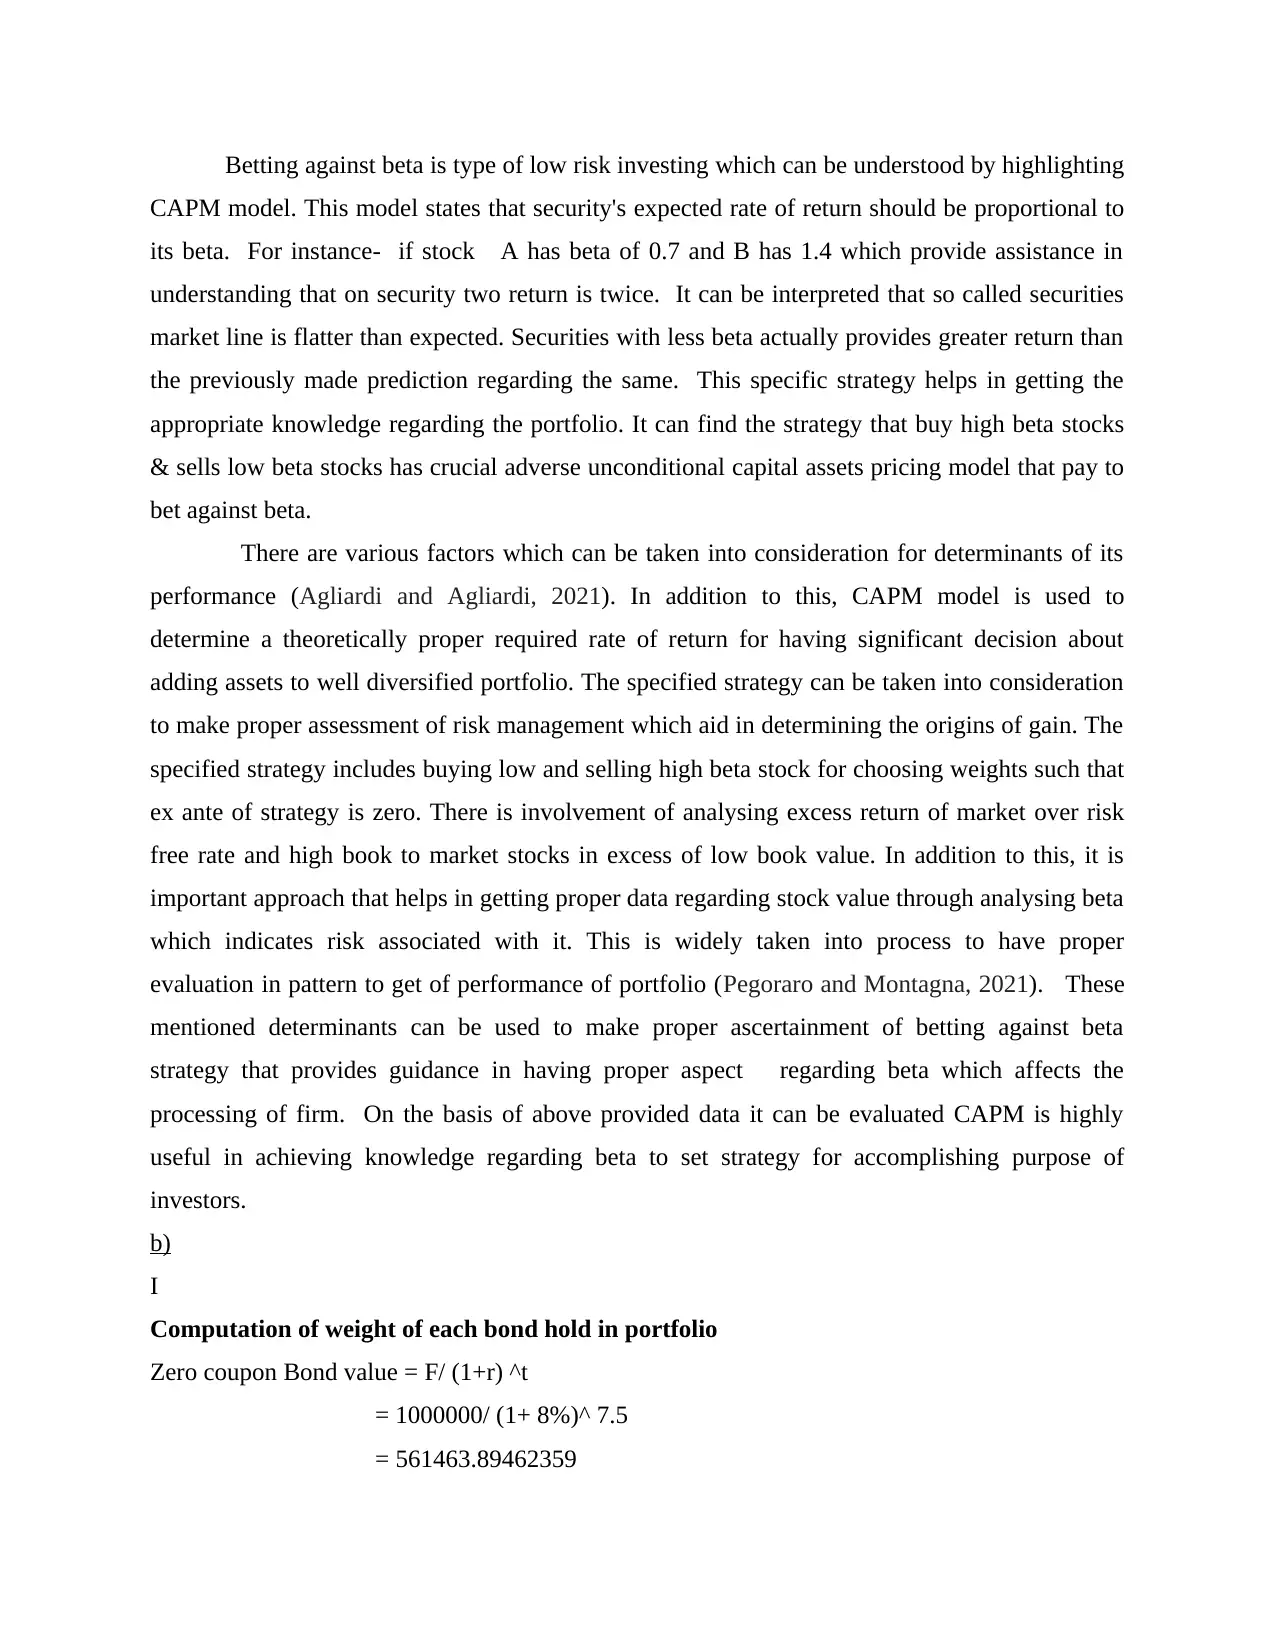
b)
I
Computation of weight of each bond hold in portfolio
Zero coupon Bond value = F/ (1+r) ^t
= 1000000/ (1+ 8%)^ 7.5
= 561463.89462359
CAPM model. This model states that security's expected rate of return should be proportional to
its beta. For instance- if stock A has beta of 0.7 and B has 1.4 which provide assistance in
understanding that on security two return is twice. It can be interpreted that so called securities
market line is flatter than expected. Securities with less beta actually provides greater return than
the previously made prediction regarding the same. This specific strategy helps in getting the
appropriate knowledge regarding the portfolio. It can find the strategy that buy high beta stocks
& sells low beta stocks has crucial adverse unconditional capital assets pricing model that pay to
bet against beta.
There are various factors which can be taken into consideration for determinants of its
performance (Agliardi and Agliardi, 2021). In addition to this, CAPM model is used to
determine a theoretically proper required rate of return for having significant decision about
adding assets to well diversified portfolio. The specified strategy can be taken into consideration
to make proper assessment of risk management which aid in determining the origins of gain. The
specified strategy includes buying low and selling high beta stock for choosing weights such that
ex ante of strategy is zero. There is involvement of analysing excess return of market over risk
free rate and high book to market stocks in excess of low book value. In addition to this, it is
important approach that helps in getting proper data regarding stock value through analysing beta
which indicates risk associated with it. This is widely taken into process to have proper
evaluation in pattern to get of performance of portfolio (Pegoraro and Montagna, 2021). These
mentioned determinants can be used to make proper ascertainment of betting against beta
strategy that provides guidance in having proper aspect regarding beta which affects the
processing of firm. On the basis of above provided data it can be evaluated CAPM is highly
useful in achieving knowledge regarding beta to set strategy for accomplishing purpose of
investors.
b)
I
Computation of weight of each bond hold in portfolio
Zero coupon Bond value = F/ (1+r) ^t
= 1000000/ (1+ 8%)^ 7.5
= 561463.89462359
⊘ This is a preview!⊘
Do you want full access?
Subscribe today to unlock all pages.
Trusted by 1+ million students worldwide
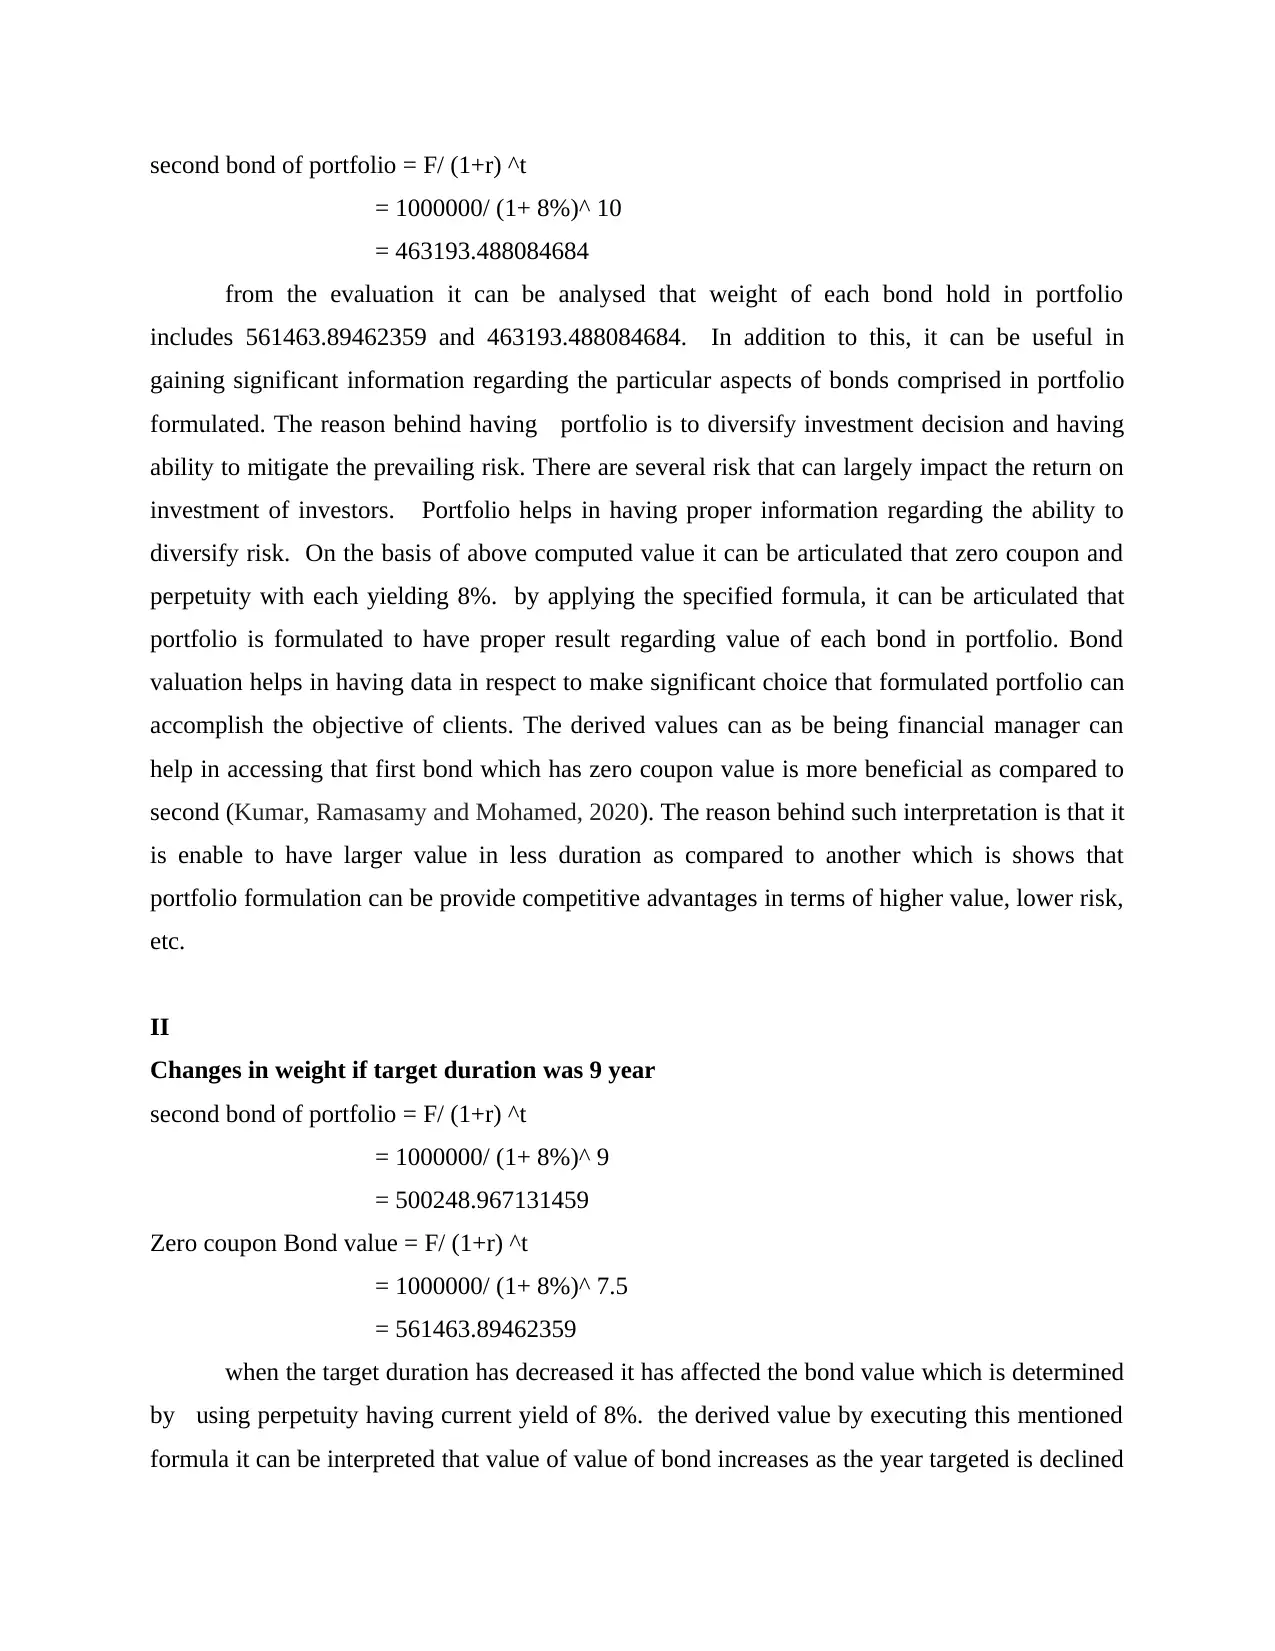
second bond of portfolio = F/ (1+r) ^t
= 1000000/ (1+ 8%)^ 10
= 463193.488084684
from the evaluation it can be analysed that weight of each bond hold in portfolio
includes 561463.89462359 and 463193.488084684. In addition to this, it can be useful in
gaining significant information regarding the particular aspects of bonds comprised in portfolio
formulated. The reason behind having portfolio is to diversify investment decision and having
ability to mitigate the prevailing risk. There are several risk that can largely impact the return on
investment of investors. Portfolio helps in having proper information regarding the ability to
diversify risk. On the basis of above computed value it can be articulated that zero coupon and
perpetuity with each yielding 8%. by applying the specified formula, it can be articulated that
portfolio is formulated to have proper result regarding value of each bond in portfolio. Bond
valuation helps in having data in respect to make significant choice that formulated portfolio can
accomplish the objective of clients. The derived values can as be being financial manager can
help in accessing that first bond which has zero coupon value is more beneficial as compared to
second (Kumar, Ramasamy and Mohamed, 2020). The reason behind such interpretation is that it
is enable to have larger value in less duration as compared to another which is shows that
portfolio formulation can be provide competitive advantages in terms of higher value, lower risk,
etc.
II
Changes in weight if target duration was 9 year
second bond of portfolio = F/ (1+r) ^t
= 1000000/ (1+ 8%)^ 9
= 500248.967131459
Zero coupon Bond value = F/ (1+r) ^t
= 1000000/ (1+ 8%)^ 7.5
= 561463.89462359
when the target duration has decreased it has affected the bond value which is determined
by using perpetuity having current yield of 8%. the derived value by executing this mentioned
formula it can be interpreted that value of value of bond increases as the year targeted is declined
Paraphrase This Document
Need a fresh take? Get an instant paraphrase of this document with our AI Paraphraser
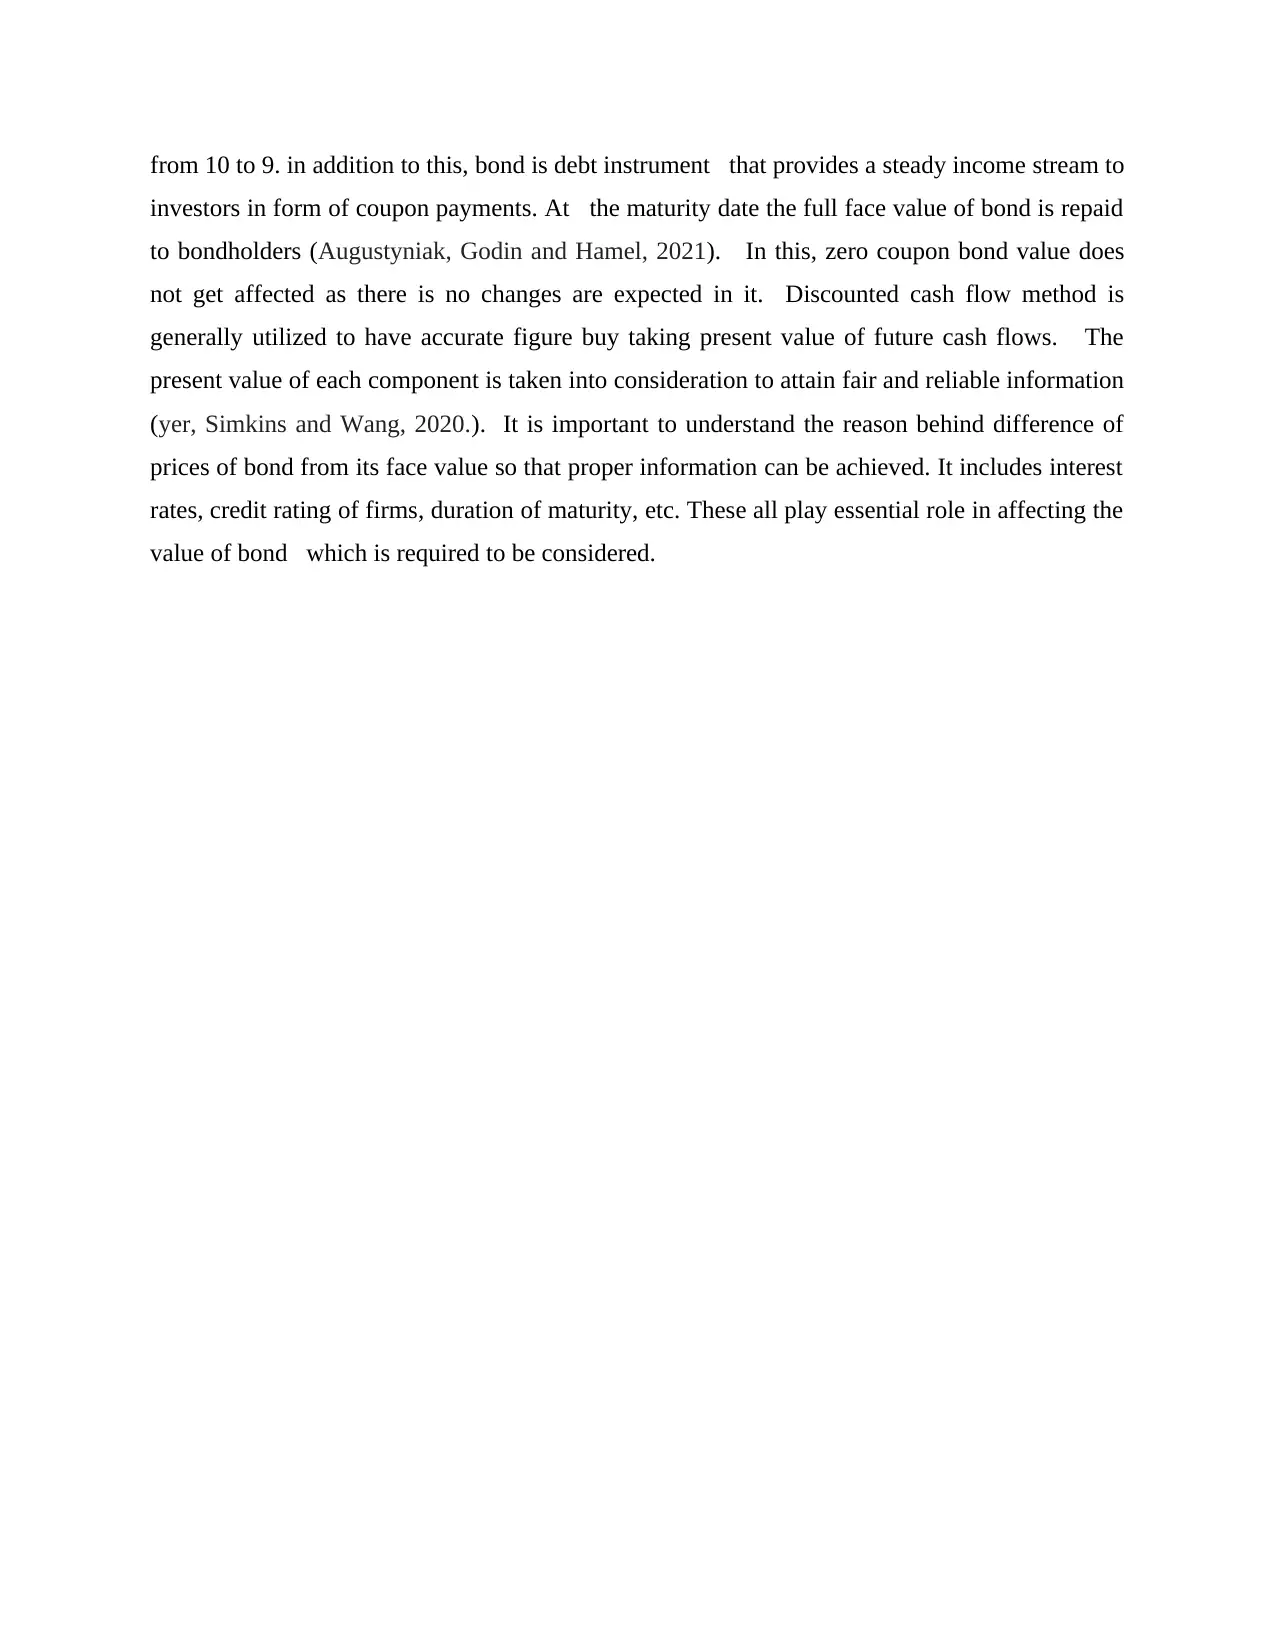
from 10 to 9. in addition to this, bond is debt instrument that provides a steady income stream to
investors in form of coupon payments. At the maturity date the full face value of bond is repaid
to bondholders (Augustyniak, Godin and Hamel, 2021). In this, zero coupon bond value does
not get affected as there is no changes are expected in it. Discounted cash flow method is
generally utilized to have accurate figure buy taking present value of future cash flows. The
present value of each component is taken into consideration to attain fair and reliable information
(yer, Simkins and Wang, 2020.). It is important to understand the reason behind difference of
prices of bond from its face value so that proper information can be achieved. It includes interest
rates, credit rating of firms, duration of maturity, etc. These all play essential role in affecting the
value of bond which is required to be considered.
REFERENCES
Books and Journals
Agliardi, E. and Agliardi, R., 2021. Pricing climate-related risks in the bond market. Journal of
Financial Stability, 54, p.100868.
Augustyniak, M., Godin, F. and Hamel, E., 2021. A mixed bond and equity fund model for the
valuation of variable annuities. ASTIN Bulletin: The Journal of the IAA. 51(1). pp.131-
159.
Guo, M. and Ou-Yang, H., 2021. Alpha Decay and Sharpe Ratio: Two Measures of Investor
Performance. Economic Modelling, p.105558.
Heck, S., 2021. Corporate bond yields and returns: a survey. Financial Markets and Portfolio
Management. pp.1-23.
Iyer, S.R., Simkins, B.J. and Wang, H., 2020. Cyberattacks and impact on bond
valuation. Finance Research Letters. 33. p.101215.
Kumar, B.C., Ramasamy, R. and Mohamed, Z., 2020. Probability Approach in Estimating Value
at Risk of Bond Portfolios for Effective Hedging. Asian Economic and Financial Review.
10(5). p.502.
Meeker, M., 2019. Optimizing the Sharpe Ratio with Portfolio Turnover, Reasoning and
Methodology. Reasoning and Methodology (December 31, 2019).
Pegoraro, S. and Montagna, M., 2021. Issuance and valuation of corporate bonds with
quantitative easing. Available at SSRN 3791730.
Vukovic, D., and et.al., 2020. Neural network forecasting in prediction Sharpe ratio: Evidence
from EU debt market. Physica A: Statistical Mechanics and its Applications, 542,
p.123331.
Online
Momentum trading strategies. 2021. [Online]. Available through:
<https://www.fidelity.com/learning-center/trading-investing/trading/momentum-trading-
strategies>
⊘ This is a preview!⊘
Do you want full access?
Subscribe today to unlock all pages.
Trusted by 1+ million students worldwide
1 out of 9
Related Documents


Your All-in-One AI-Powered Toolkit for Academic Success.
+13062052269
info@desklib.com
Available 24*7 on WhatsApp / Email
![[object Object]](/_next/static/media/star-bottom.7253800d.svg)
Unlock your academic potential
Copyright © 2020–2026 A2Z Services. All Rights Reserved. Developed and managed by ZUCOL.