Comprehensive Analysis of Investment Portfolios and Strategies
VerifiedAdded on 2022/08/11
|23
|5500
|28
Project
AI Summary
This project comprehensively analyzes the performance of various investment portfolios, constructed using 30 stocks from different industries (Materials, Energy, Technology, Healthcare, and Utilities) over the period of 2014-2019. The study explores the impact of different investment strategies, including short selling of risky assets, on portfolio returns and risk. The project utilizes financial ratios such as Sharpe, Treynor, and Sortino ratios, alongside Jensen's Alpha and beta calculations, to evaluate portfolio performance and associated risks. The analysis also delves into socially responsible investments and treasury funds, examining their characteristics and portfolio construction rationale. The project aims to provide insights into strategic and tactical asset allocation, offering a detailed understanding of investment management principles and their practical application in diverse market scenarios.
Running head: INVESTMENT MANAGEMENT
Investment management
Name of the student
Name of the university
Authors name
Investment management
Name of the student
Name of the university
Authors name
Paraphrase This Document
Need a fresh take? Get an instant paraphrase of this document with our AI Paraphraser
1
INVESTMENT MANAGEMENT
Executive Summary
The aim of the project is to analyze in depth the performance of different portfolio which are
prepared by taking 30 stocks from different industries. The investment in equities of different
companies require sufficient knowledge and constant evaluation of the portfolio to determine
whether portfolio requires strategic asset allocation or tactical asset allocation. The project
studies the affect of different strategies like short selling of risky asset and considering not short
selling in different portfolios to see the different performance based return. The project
concludes the ratios like sharp ratio, treynor ratio, sortino ratio and beta calculation are necessary
for analyzing the expected rate of return of the portfolio and the risk associated with the different
portfolio.
2
INVESTMENT MANAGEMENT
Table of Contents
Introduction......................................................................................................................................3
Discussion........................................................................................................................................4
Task 1...........................................................................................................................................4
Task 2...........................................................................................................................................8
Task 3.........................................................................................................................................13
Conclusion.....................................................................................................................................19
References......................................................................................................................................20
⊘ This is a preview!⊘
Do you want full access?
Subscribe today to unlock all pages.
Trusted by 1+ million students worldwide
3
INVESTMENT MANAGEMENT
Introduction
The project attempts to study different types of industries performance in the market. The
different industries taken for the study are Materials, Energy, Technology, Health Care,
Utilities). The report tries to study the industrial performances of these industries by conducting
research. The research report contains data relating to the five years which are 2014, 2015, 2016,
2017, 2018 and 2019. The industrial sector in United Kingdom faced a sharp decline in the 1970s
but if we the see the data provided by the different sources, the market performance has
improved in the recent years. The years between 2014 to 2019 are very crucial years for the
industries whether they are utilities, materials, energy, technology and health care. The project
takes around 30 stocks to study the performance of these industries by calculating beta, sharp
ratio, treynor ratio, Sortino ratio and Jensen’s Alpha.The UK’s industrial performance has
improved by 1.4% every year since 1948, as per the recent data published by National Statistics
(ONS). The companies selected for the comprehensive study of the project is The data of the
overall five years concerning stock prices are taken are Merck & Co., Inc. (MRK),
AmerisourceBergen Corporation (ABC),HCA Healthcare, Inc. (HCA), Dentsply Sirona Inc.
(XRAY) and Cigna Corporation (CI) from healthcare sector;HP Inc. (HPQ), International
Business Machines Corporation (IBM), Salesforce.com, inc. (CRM), Oracle Corporation
(ORCL) and Fortinet, Inc. (FTNT) from technology sector; American Express Company (AXP),
Bank of America Corporation (BAC), BlackRock, Inc. (BLK), Citigroup Inc. (C) and The
Goldman Sachs Group, Inc. (GS) from finance industry; Barrick Gold Corporation (GOLD),
Newmont Mining Corporation (NEM), Kinross Gold Corporation (KGC), Gold Fields Limited
(GFI) and Yamana Gold Inc. (AUY) from basic material sector; The AES Corporation (AES),
Alliant Energy Corporation (LNT), Ameren Corporation (AEE), American Water Works
Paraphrase This Document
Need a fresh take? Get an instant paraphrase of this document with our AI Paraphraser
4
INVESTMENT MANAGEMENT
Company, Inc. (AWK) and CenterPoint Energy, Inc. (CNP) from utilities sector; EOG
Resources, Inc. (EOG), Chevron Corporation (CVX), Hess Corporation (HES), HollyFrontier
Corporation (HFC) and ConocoPhillips (COP) from energy sector.
Discussion
Task 1
There are 30 companies shares prices are taken for studying in detail the effect of short
selling and not short selling the stocks. The effects of short selling are studied by calculating the
returns of each stock in the portfolio for 61 days. The expected rate of return is the probable
return which an investment portfolio can provide to the investors. The return which the investors
get from the investment is known as variable and it keeps on changing as per the market
valuation. The expected return is calculated by multiplying the expected return from a stock to
the probability percent (Kasaoka 2016).
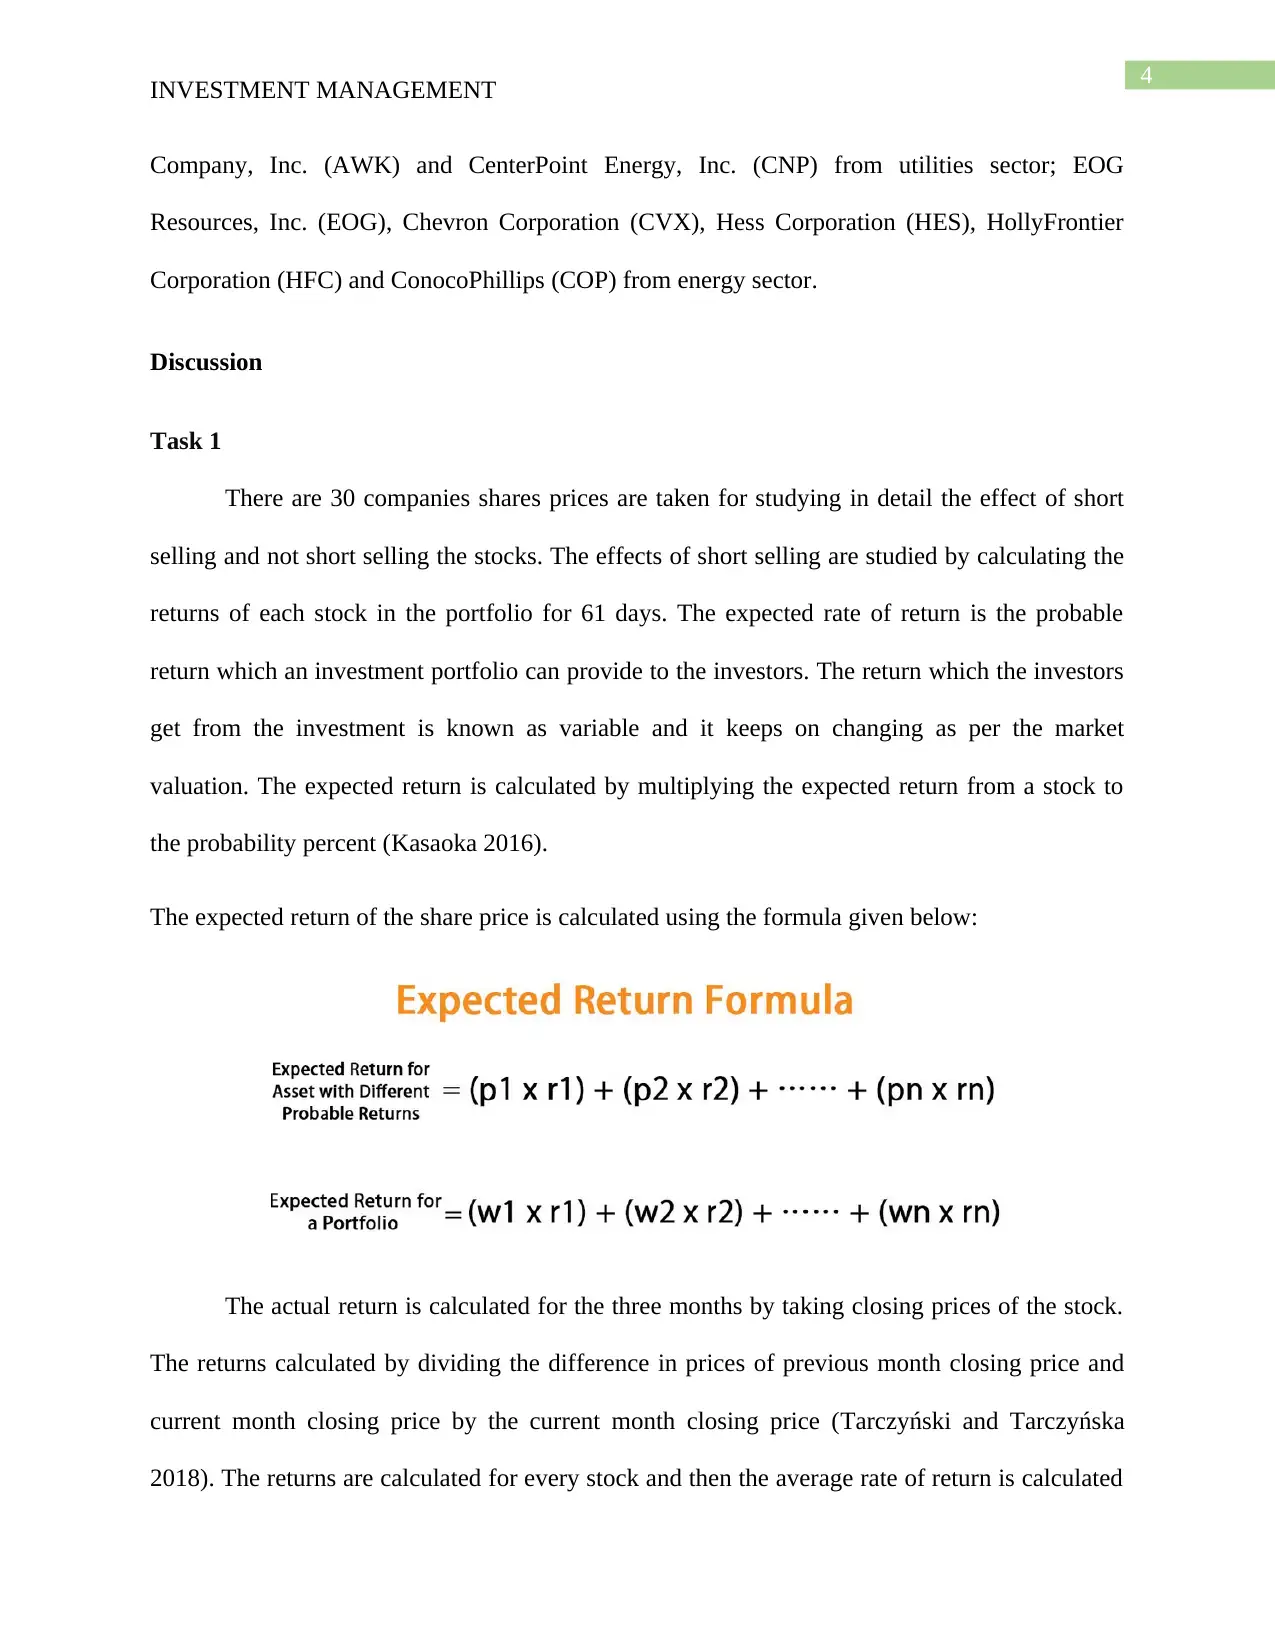
The expected return of the share price is calculated using the formula given below:
The actual return is calculated for the three months by taking closing prices of the stock.
The returns calculated by dividing the difference in prices of previous month closing price and
current month closing price by the current month closing price (Tarczyński and Tarczyńska
2018). The returns are calculated for every stock and then the average rate of return is calculated
INVESTMENT MANAGEMENT
Company, Inc. (AWK) and CenterPoint Energy, Inc. (CNP) from utilities sector; EOG
Resources, Inc. (EOG), Chevron Corporation (CVX), Hess Corporation (HES), HollyFrontier
Corporation (HFC) and ConocoPhillips (COP) from energy sector.
Discussion
Task 1
There are 30 companies shares prices are taken for studying in detail the effect of short
selling and not short selling the stocks. The effects of short selling are studied by calculating the
returns of each stock in the portfolio for 61 days. The expected rate of return is the probable
return which an investment portfolio can provide to the investors. The return which the investors
get from the investment is known as variable and it keeps on changing as per the market
valuation. The expected return is calculated by multiplying the expected return from a stock to
the probability percent (Kasaoka 2016).
The expected return of the share price is calculated using the formula given below:
The actual return is calculated for the three months by taking closing prices of the stock.
The returns calculated by dividing the difference in prices of previous month closing price and
current month closing price by the current month closing price (Tarczyński and Tarczyńska
2018). The returns are calculated for every stock and then the average rate of return is calculated
5
INVESTMENT MANAGEMENT
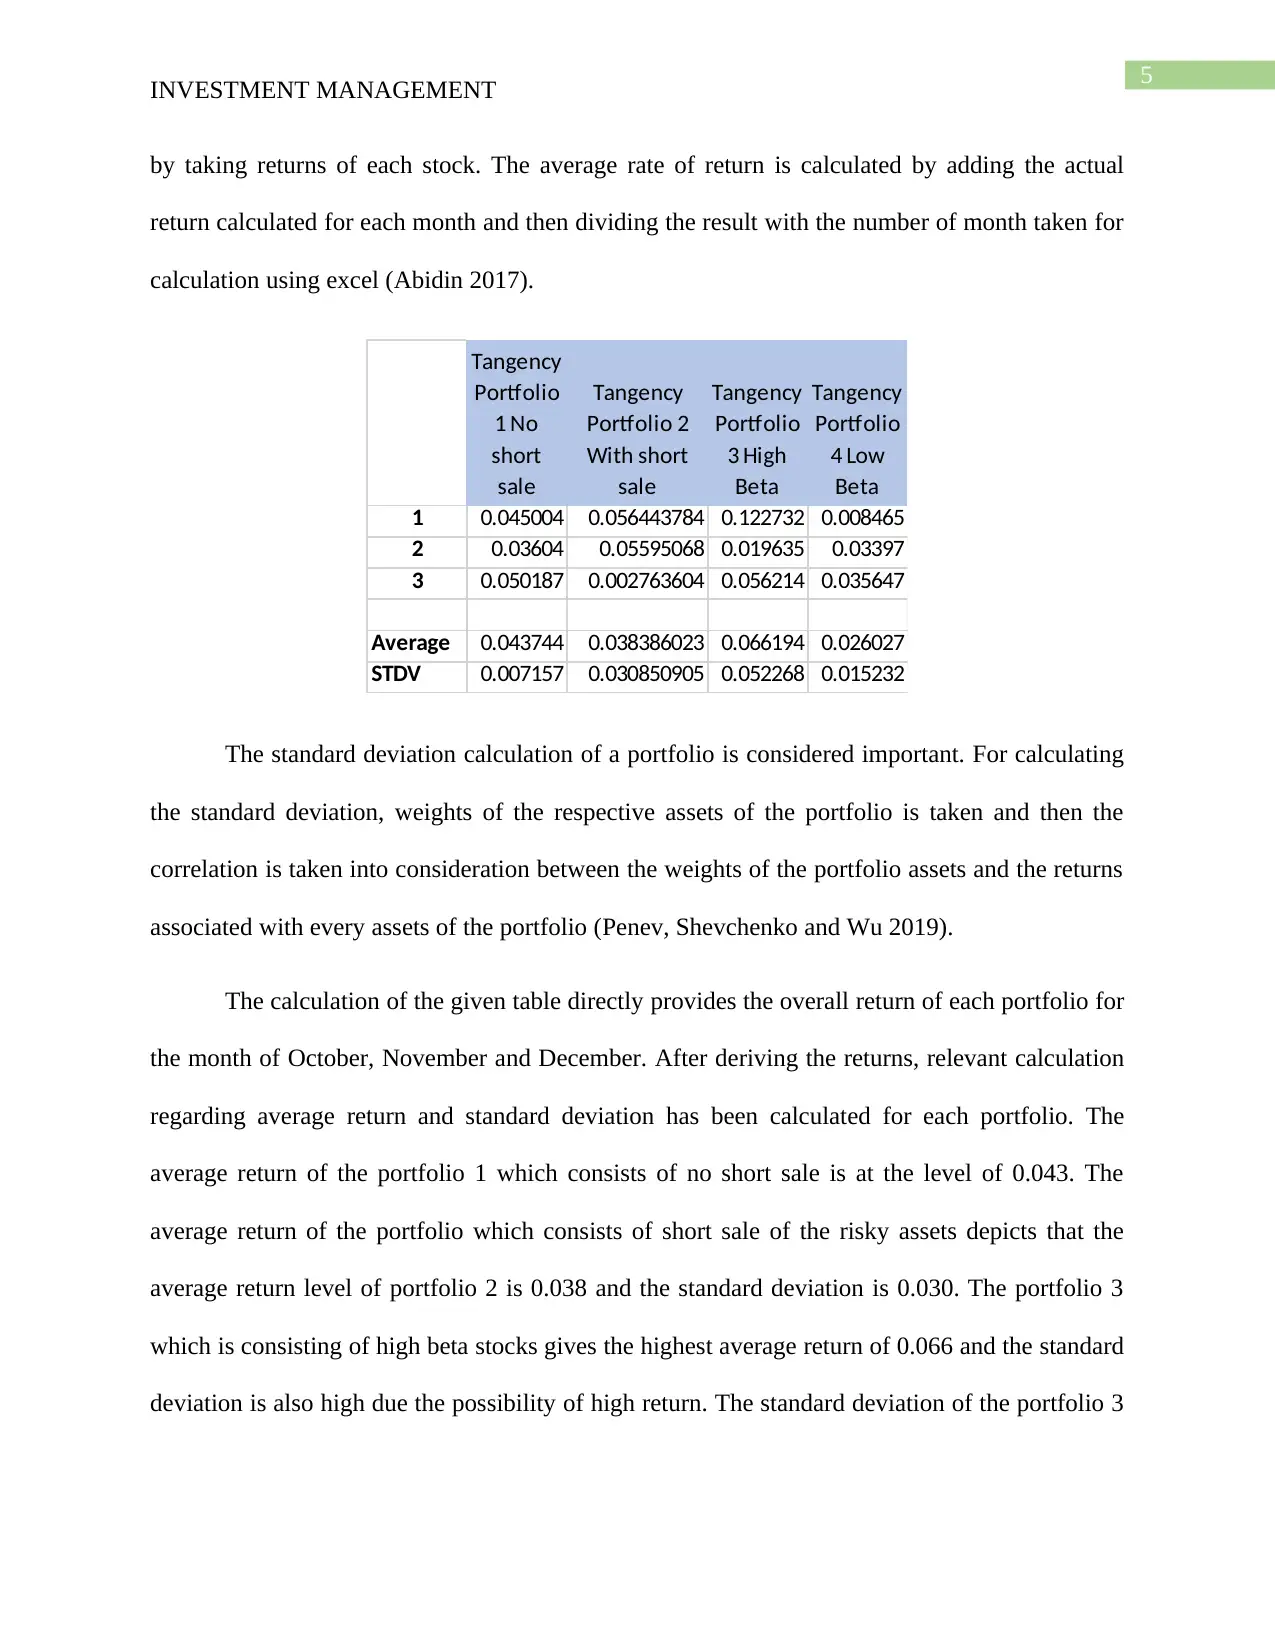
by taking returns of each stock. The average rate of return is calculated by adding the actual
return calculated for each month and then dividing the result with the number of month taken for
calculation using excel (Abidin 2017).
Tangency
Portfolio
1 No
short
sale
Tangency
Portfolio 2
With short
sale
Tangency
Portfolio
3 High
Beta
Tangency
Portfolio
4 Low
Beta
1 0.045004 0.056443784 0.122732 0.008465
2 0.03604 0.05595068 0.019635 0.03397
3 0.050187 0.002763604 0.056214 0.035647
Average 0.043744 0.038386023 0.066194 0.026027
STDV 0.007157 0.030850905 0.052268 0.015232
The standard deviation calculation of a portfolio is considered important. For calculating
the standard deviation, weights of the respective assets of the portfolio is taken and then the
correlation is taken into consideration between the weights of the portfolio assets and the returns
associated with every assets of the portfolio (Penev, Shevchenko and Wu 2019).
The calculation of the given table directly provides the overall return of each portfolio for
the month of October, November and December. After deriving the returns, relevant calculation
regarding average return and standard deviation has been calculated for each portfolio. The
average return of the portfolio 1 which consists of no short sale is at the level of 0.043. The
average return of the portfolio which consists of short sale of the risky assets depicts that the
average return level of portfolio 2 is 0.038 and the standard deviation is 0.030. The portfolio 3
which is consisting of high beta stocks gives the highest average return of 0.066 and the standard
deviation is also high due the possibility of high return. The standard deviation of the portfolio 3
INVESTMENT MANAGEMENT
by taking returns of each stock. The average rate of return is calculated by adding the actual
return calculated for each month and then dividing the result with the number of month taken for
calculation using excel (Abidin 2017).
Tangency
Portfolio
1 No
short
sale
Tangency
Portfolio 2
With short
sale
Tangency
Portfolio
3 High
Beta
Tangency
Portfolio
4 Low
Beta
1 0.045004 0.056443784 0.122732 0.008465
2 0.03604 0.05595068 0.019635 0.03397
3 0.050187 0.002763604 0.056214 0.035647
Average 0.043744 0.038386023 0.066194 0.026027
STDV 0.007157 0.030850905 0.052268 0.015232
The standard deviation calculation of a portfolio is considered important. For calculating
the standard deviation, weights of the respective assets of the portfolio is taken and then the
correlation is taken into consideration between the weights of the portfolio assets and the returns
associated with every assets of the portfolio (Penev, Shevchenko and Wu 2019).
The calculation of the given table directly provides the overall return of each portfolio for
the month of October, November and December. After deriving the returns, relevant calculation
regarding average return and standard deviation has been calculated for each portfolio. The
average return of the portfolio 1 which consists of no short sale is at the level of 0.043. The
average return of the portfolio which consists of short sale of the risky assets depicts that the
average return level of portfolio 2 is 0.038 and the standard deviation is 0.030. The portfolio 3
which is consisting of high beta stocks gives the highest average return of 0.066 and the standard
deviation is also high due the possibility of high return. The standard deviation of the portfolio 3
⊘ This is a preview!⊘
Do you want full access?
Subscribe today to unlock all pages.
Trusted by 1+ million students worldwide
6
INVESTMENT MANAGEMENT
is highest which is around 0.052. The portfolio 4 consist of consist of low beta stocks and thus
giving lower returns resulting in lower standard deviation which is around 0.0152.
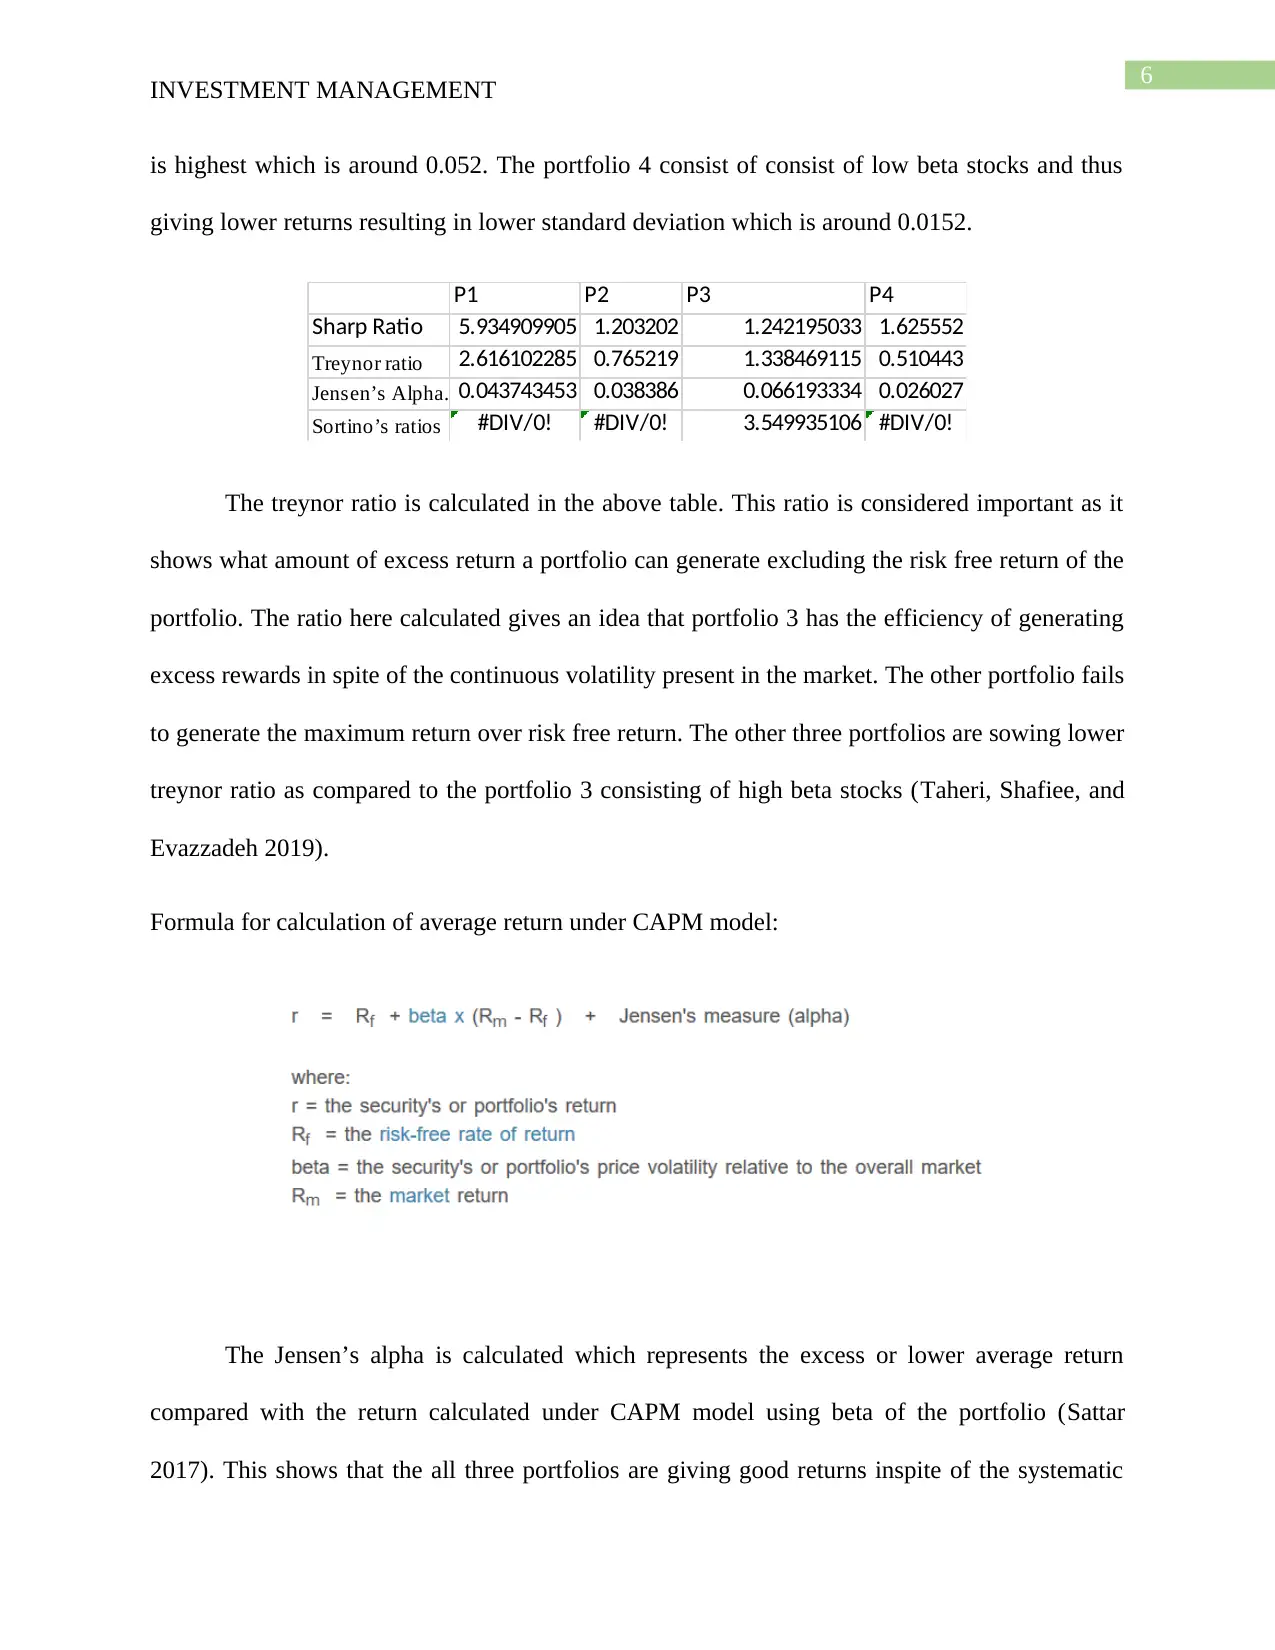
P1 P2 P3 P4
Sharp Ratio 5.934909905 1.203202 1.242195033 1.625552
Treynor ratio 2.616102285 0.765219 1.338469115 0.510443
Jensen’s Alpha. 0.043743453 0.038386 0.066193334 0.026027
Sortino’s ratios #DIV/0! #DIV/0! 3.549935106 #DIV/0!
The treynor ratio is calculated in the above table. This ratio is considered important as it
shows what amount of excess return a portfolio can generate excluding the risk free return of the
portfolio. The ratio here calculated gives an idea that portfolio 3 has the efficiency of generating
excess rewards in spite of the continuous volatility present in the market. The other portfolio fails
to generate the maximum return over risk free return. The other three portfolios are sowing lower
treynor ratio as compared to the portfolio 3 consisting of high beta stocks (Taheri, Shafiee, and
Evazzadeh 2019).
Formula for calculation of average return under CAPM model:
The Jensen’s alpha is calculated which represents the excess or lower average return
compared with the return calculated under CAPM model using beta of the portfolio (Sattar
2017). This shows that the all three portfolios are giving good returns inspite of the systematic
INVESTMENT MANAGEMENT
is highest which is around 0.052. The portfolio 4 consist of consist of low beta stocks and thus
giving lower returns resulting in lower standard deviation which is around 0.0152.
P1 P2 P3 P4
Sharp Ratio 5.934909905 1.203202 1.242195033 1.625552
Treynor ratio 2.616102285 0.765219 1.338469115 0.510443
Jensen’s Alpha. 0.043743453 0.038386 0.066193334 0.026027
Sortino’s ratios #DIV/0! #DIV/0! 3.549935106 #DIV/0!
The treynor ratio is calculated in the above table. This ratio is considered important as it
shows what amount of excess return a portfolio can generate excluding the risk free return of the
portfolio. The ratio here calculated gives an idea that portfolio 3 has the efficiency of generating
excess rewards in spite of the continuous volatility present in the market. The other portfolio fails
to generate the maximum return over risk free return. The other three portfolios are sowing lower
treynor ratio as compared to the portfolio 3 consisting of high beta stocks (Taheri, Shafiee, and
Evazzadeh 2019).
Formula for calculation of average return under CAPM model:
The Jensen’s alpha is calculated which represents the excess or lower average return
compared with the return calculated under CAPM model using beta of the portfolio (Sattar
2017). This shows that the all three portfolios are giving good returns inspite of the systematic
Paraphrase This Document
Need a fresh take? Get an instant paraphrase of this document with our AI Paraphraser
7
INVESTMENT MANAGEMENT
risk present in the market but the portfolio 4 consisting of lower beta stocks are giving the least
return in this run. But since the ratio is greater than 1 in all the three portfolios, it can be
concluded that each of the given portfolios has capacity to beat the market volatility
(Bunnenberg et al. 2019).
The sortino ratio is also calculated for finding out the average return excluding the risk
free return in downside market. the standard deviation taken for studying the sortino ratio is the
downside or negative standard deviation. The downside risk is only taken into consideration for
calculating the sortino ratio. this ratio tells us that even in the case of extreme risk that is the
downside risk (Mohan, Singh and Ongsakul 2016). The higher sortino is considered good
because higher ratio gives an indication that the portfolio can generate good returns even in the
case of downside risk. The portfolio 3 consisting of high beta stocks has only the positive sortino
ratio which is considered good for any investors. If these investors money is invested in highly
risky stocks then they are also getting higher returns (Sanford 2019).
The two portfolios 1 and 2 are the portfolios in which 1 considered short selling of the
risky assets and the others consider not short selling the risky assets. The portfolio 2 which
considers short selling of risky assets for minimizing the risk associated with the portfolio. the
short selling reduces the level of risk and thus it can be seen that the standard deviation of the
portfolio is the minimum among the 4 portfolios giving an idea that the portfolio matches the
objective which can favour the risk averse clients. The portfolio which do not consider short
selling of assets is giving higher return than the portfolio 2 which is short selling the risky assets
for minimizing the risk (Menna and Tirelli 2018).
.
8
INVESTMENT MANAGEMENT
Problems relating to short selling:
Short selling of risky assets can generate some of the more risks like the loan for the
stocks may become expensive and recalling of the stock may become difficult. The short selling
of stocks has to be done by analyzing the price of the stock because if the stock is mispriced in
the market, the prediction of declining its price in the market can go wrong. Moreover if short
selling is done only for risky assets then the portfolio may generate lower returns. Fund
managers do the short selling do minimize the downside risk. The benchmark return is 0.00765
which is higher than the portfolio 1 and 2 return. Short selling of the risky assets is the portfolio
which is minimizing risk and thus the return of the portfolio is also lower than the benchmark
return (Appel, Bulka and Fos 2019).
Task 2
Answer a
Investment objective
The investment objective of socially responsible Investments is the objective of
maintaining social values in the investment portfolio. The SRI investments are made with the
objective to invest in the companies which are following proper social value. These companies
have chance of creating greater influence on the society and can give consistent returns. These
socially responsible funds are after all investment funds and they focus on generating good
returns based on the social impact and popularity (Tao et al. 2017).
The investment objective of investing in treasury funds is to earn moderate rate of return
by taking moderate and minimal risk. These funds generally have short term objectives and
backed by the government. The investment objectives in BND is to track the performance of the
bond market as a whole. The Vanguard Total Bond market ETF are traded on the market like
securities. The objective of investing in TIAA-CREF social choice bond fund is to gain long
term return with the help of capital appreciation and the objective in investment in ishares TIPS
⊘ This is a preview!⊘
Do you want full access?
Subscribe today to unlock all pages.
Trusted by 1+ million students worldwide
9
INVESTMENT MANAGEMENT
Bond ETF is to track the treasury inflation protected securities. These funds includes maximum
investments in the treasury bonds and tracks the underlying index which is S&P 500
(Kouwenberg 2017).
Answer b
The rationale behind the portfolio construction
The return of 60 days is evaluated by taking the closing price of each day. The average
return of the 60 day period for all the ETF and treasury fund is calculated. The different
contribution of the different ETF and treasury fund are considered to determine the standard
deviation of the portfolio. The return, risk free return and the standard deviation helps to find out
the efficient social funds for creating the best possible portfolio. Strategic asset allocation
strategy has been used for selecting the two funds on the basis of their performance with respect
to the benchmark return (Buchner, Mohamed and Schwienbacher 2017). The reason behind
taking the social funds in the portfolio is that these funds are becoming famous among the new
investors by the social impact they are creating. In addition, treasury bonds are always a sign of
lower risk and moderate returns. This helps the investors in generating steady returns for the
invested period. Moreover, the portfolio can be created by taking the two funds which are SUSA
and TSBIX as these are the two funds which are showing constantly positive returns and has the
ability to outperform the market. The performance of the two funds with respect to the volatility
present in the market is calculated by determining different ratios which are Sharpe, Treynor and
Sortino’s ratios and Jensen’s Alpha (Bardgett, Gourier and Leippold 2019).
Answer c
The characteristics and composition of the portfolio and the structure of the portfolio.
Paraphrase This Document
Need a fresh take? Get an instant paraphrase of this document with our AI Paraphraser
10
INVESTMENT MANAGEMENT
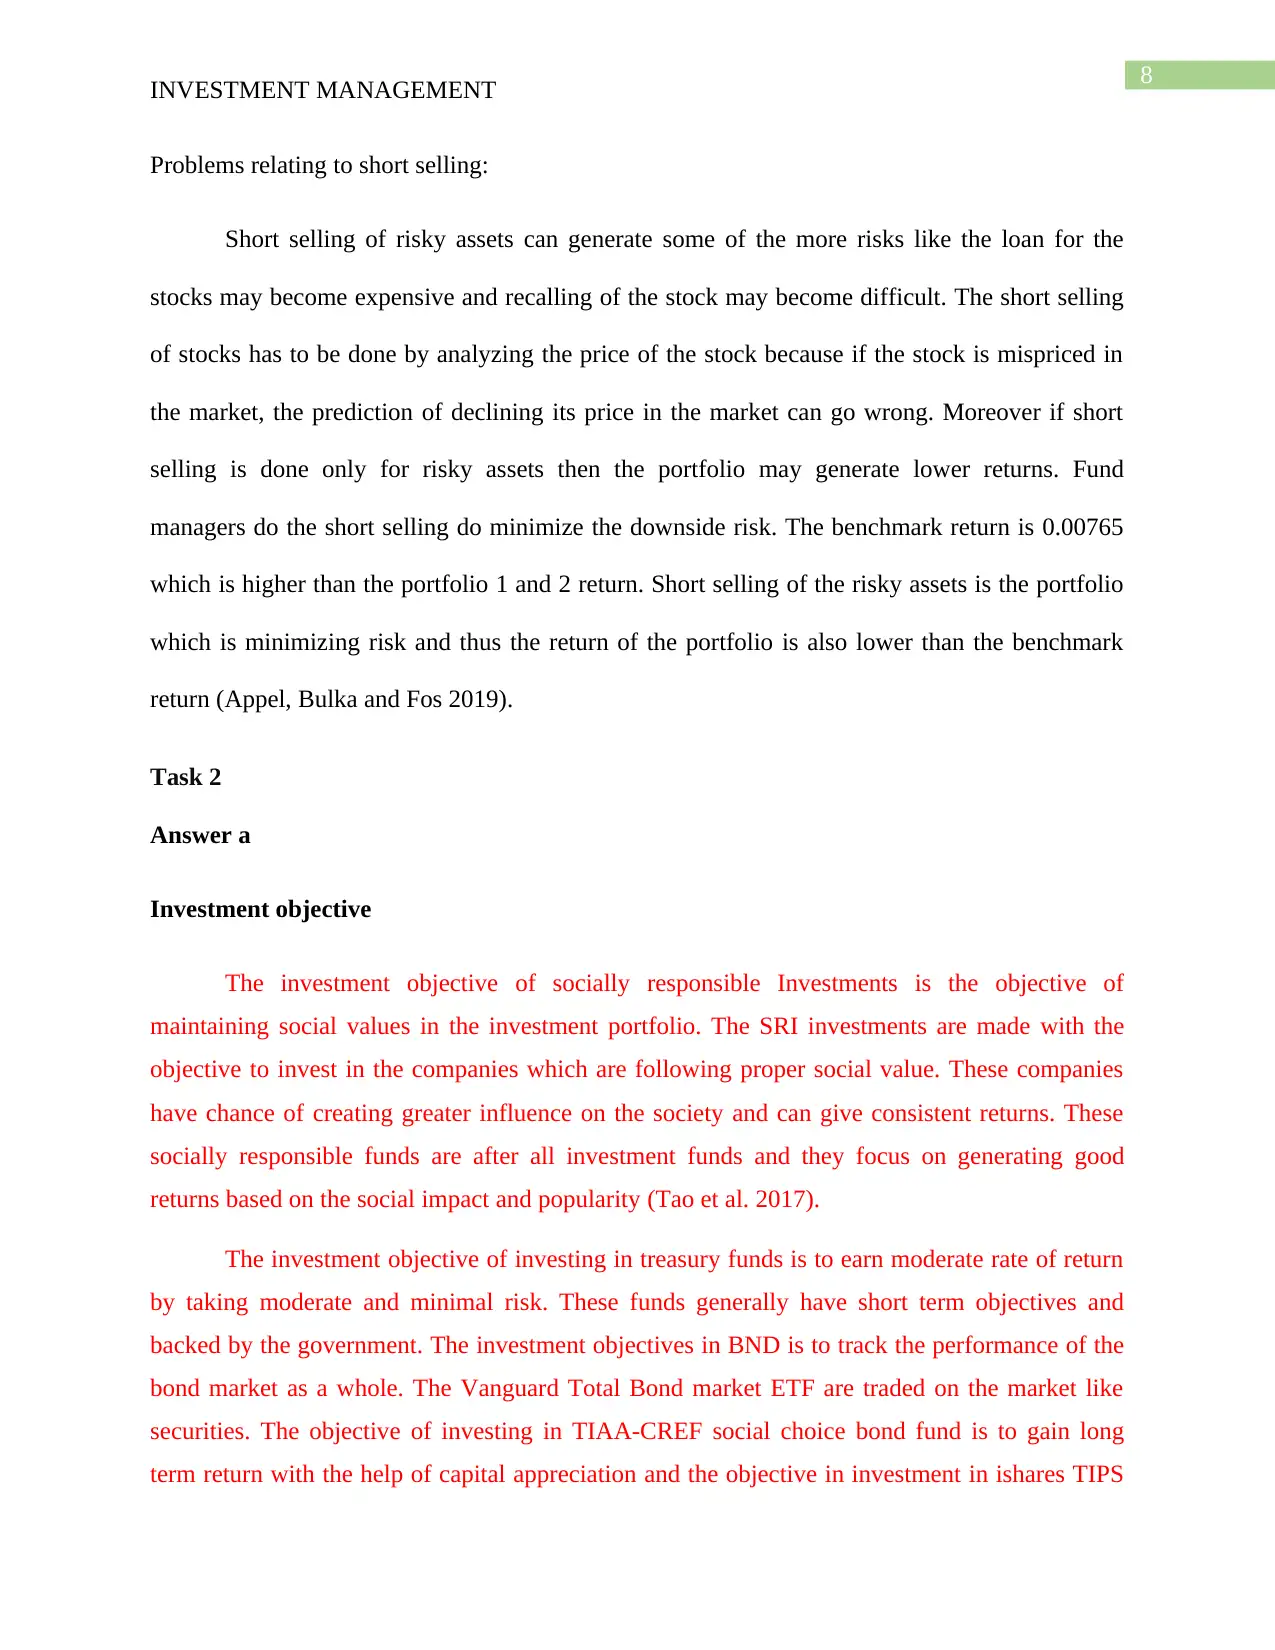
Asset class Active weight Benchmark weight Excess Weight Benchmark Return Allocation Effect
ETF 0.22086155 0.22086155 0 0.002293605 0
Tresury funds 0.77913845 0.77913845 0 0.001510394 0
Assets alocation effect
Asset class Active Performance Benchmark Return Excess Performance Benchmark Weight Selection Effect
ETF 0.001875918 0.002293605 -0.000417687 0.22086155 -0.000092251
Tresury funds 0.002175232 0.001510394 0.000664838 0.77913845 0.000518001
Security selection Effect
The portfolio is being created by taking in £450,000 and the amount is invested in
different exchange traded fund and treasury funds. The objective is to minimise the risk of the
investors and generate a fair return. Before creating a portfolio of social fund, different social
responsibility exchange traded funds and different treasury bonds exchange trade funds are
evaluated on the basis of the return and their performance. The calculation of the average return
and different performance ratios such as sharp and treynor ratio are calculated to compare the
returns with the risk and volatility in the market (Ko and Ge 2018). The returns of different funds
are also compared with the benchmark return to see how much they can outperform the market.
The capitalisation of the ETF and Treasury funds are kept same as per the index. However, it can
be seen with the help of the above table that the ETF are performing lower than the benchmark
while treasury funds are capable of outperforming the benchmark performance (Santandrea et al.
2017). The different exchange traded funds which are taken for making the portfolio are SUSA,
PBW, PBD and the different treasury funds which are taken for creating the portfolio are TSBIX,
TIP and BND.
Answer d
The closing prices at which the ETF funds and treasury funds are traded on the market for
a period of 60 days are analysed to determine the actual return they are generating over this
period. The average return for a period of 60 days of SUSA fund is 0.008, the average return for
PBW is -0.0004 and the average return for the PBD fund is 0.00164. The standard deviation
shows the amount of volatility the fund is facing in the market. The SUSA fund is a moderately
risky fund and generating a good amount of return. However the PBW is showing the highest
volatility and risk is high with standard deviation at 0.0638. The PBW fund is generating a
INVESTMENT MANAGEMENT
Asset class Active weight Benchmark weight Excess Weight Benchmark Return Allocation Effect
ETF 0.22086155 0.22086155 0 0.002293605 0
Tresury funds 0.77913845 0.77913845 0 0.001510394 0
Assets alocation effect
Asset class Active Performance Benchmark Return Excess Performance Benchmark Weight Selection Effect
ETF 0.001875918 0.002293605 -0.000417687 0.22086155 -0.000092251
Tresury funds 0.002175232 0.001510394 0.000664838 0.77913845 0.000518001
Security selection Effect
The portfolio is being created by taking in £450,000 and the amount is invested in
different exchange traded fund and treasury funds. The objective is to minimise the risk of the
investors and generate a fair return. Before creating a portfolio of social fund, different social
responsibility exchange traded funds and different treasury bonds exchange trade funds are
evaluated on the basis of the return and their performance. The calculation of the average return
and different performance ratios such as sharp and treynor ratio are calculated to compare the
returns with the risk and volatility in the market (Ko and Ge 2018). The returns of different funds
are also compared with the benchmark return to see how much they can outperform the market.
The capitalisation of the ETF and Treasury funds are kept same as per the index. However, it can
be seen with the help of the above table that the ETF are performing lower than the benchmark
while treasury funds are capable of outperforming the benchmark performance (Santandrea et al.
2017). The different exchange traded funds which are taken for making the portfolio are SUSA,
PBW, PBD and the different treasury funds which are taken for creating the portfolio are TSBIX,
TIP and BND.
Answer d
The closing prices at which the ETF funds and treasury funds are traded on the market for
a period of 60 days are analysed to determine the actual return they are generating over this
period. The average return for a period of 60 days of SUSA fund is 0.008, the average return for
PBW is -0.0004 and the average return for the PBD fund is 0.00164. The standard deviation
shows the amount of volatility the fund is facing in the market. The SUSA fund is a moderately
risky fund and generating a good amount of return. However the PBW is showing the highest
volatility and risk is high with standard deviation at 0.0638. The PBW fund is generating a
11
INVESTMENT MANAGEMENT
negative return for the investors due the amount of increased volatility in the market. The PBD
fund is also facing high volatility and risk as compared to the return, it is generating for its
investors as the standard deviation calculated is showing value of 0.050624 and the average
return of this ETF fund is 0.00164 (McCaughey et al. 2016).
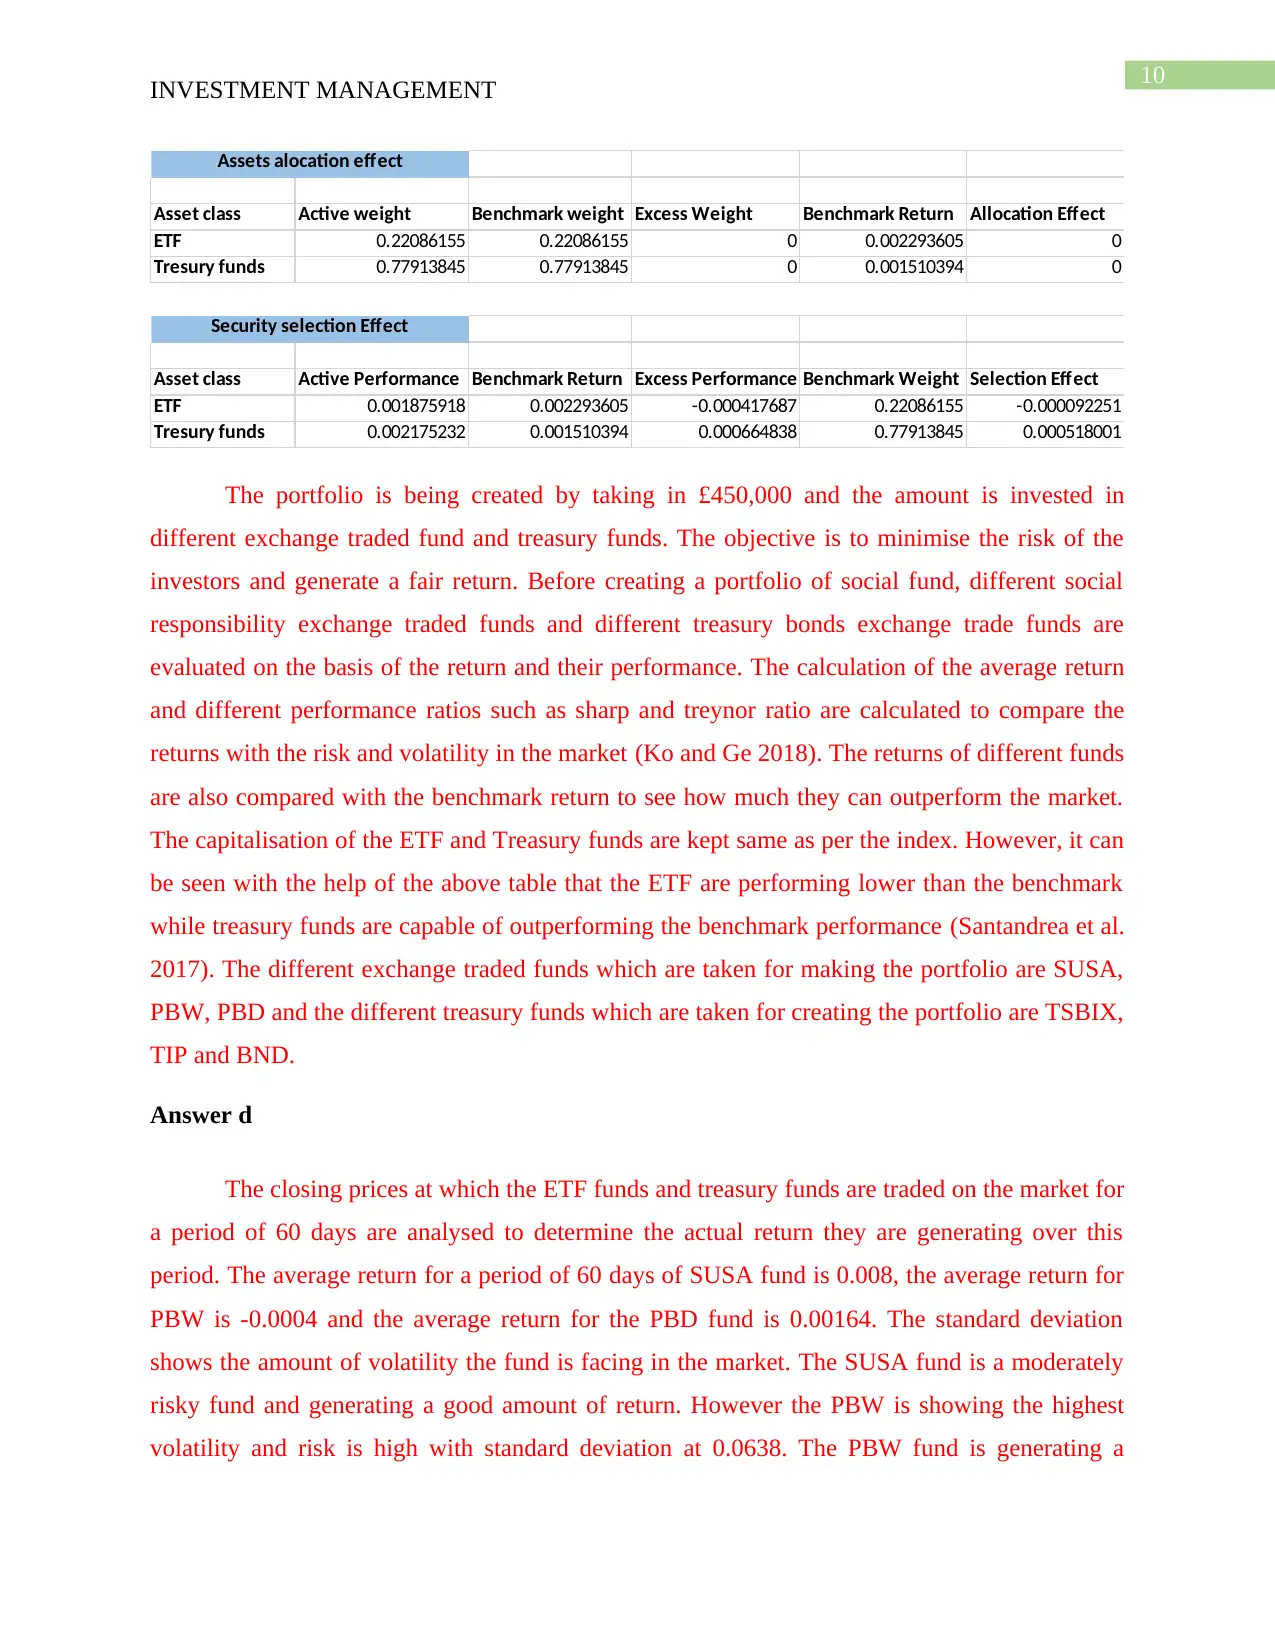
The performance comparision of the ETF fund shows that SBW is taking the lesser risk
and it is showing lesser volatility and earing higher return than the other two ETF which are
PBW and PBD. The sharp ratio calculates the excess return that the fund can generate over the
risk free return and the result then divided by the standard deviation. The sharp ratio of the
portfolio of social responsibility funds and the treasury funds is calculated as 0.31. which shows
that when a portfolio is created by combining one social responsibility fund and treasury fund on
the basis of the average return contribution for 60 days period, the excess return that the portfolio
is generating is positive and over the risk free return of the funds (Gravit 2017). The treynor ratio
is similar to the sharp ratio and showing the excess return over the risk free return generated by
the funds but it considers the market volatility as a whole by taking beta as one of the factor for
its calculation. The treynor ratio is also positive and shows that the social fund portfolio can beat
the market to some extent as ratio is positive but lower than the sharp ratio (Andrienko et al.
2019). The Jensen Alpha ratio shows a positive value shows that the portfolio consisting of ETF
and Treasury bond can outperform the market. The sortino ratio is also calculated for looking the
performance of the fund concerning the downside risk present in the market. The sortino ratio
shows the value of 0.0017 which is the lowest among the 4 ratios. It shows that the social funds
have the highest risk of downside volatility (Robiyanto 2018).
Task 3
In the above case, it is seen that a hedge fund manager has an initial cash balance of
£350,000, which he needs to invest fully or partially to obtain profitable outcomes. To ensure
INVESTMENT MANAGEMENT
negative return for the investors due the amount of increased volatility in the market. The PBD
fund is also facing high volatility and risk as compared to the return, it is generating for its
investors as the standard deviation calculated is showing value of 0.050624 and the average
return of this ETF fund is 0.00164 (McCaughey et al. 2016).
The performance comparision of the ETF fund shows that SBW is taking the lesser risk
and it is showing lesser volatility and earing higher return than the other two ETF which are
PBW and PBD. The sharp ratio calculates the excess return that the fund can generate over the
risk free return and the result then divided by the standard deviation. The sharp ratio of the
portfolio of social responsibility funds and the treasury funds is calculated as 0.31. which shows
that when a portfolio is created by combining one social responsibility fund and treasury fund on
the basis of the average return contribution for 60 days period, the excess return that the portfolio
is generating is positive and over the risk free return of the funds (Gravit 2017). The treynor ratio
is similar to the sharp ratio and showing the excess return over the risk free return generated by
the funds but it considers the market volatility as a whole by taking beta as one of the factor for
its calculation. The treynor ratio is also positive and shows that the social fund portfolio can beat
the market to some extent as ratio is positive but lower than the sharp ratio (Andrienko et al.
2019). The Jensen Alpha ratio shows a positive value shows that the portfolio consisting of ETF
and Treasury bond can outperform the market. The sortino ratio is also calculated for looking the
performance of the fund concerning the downside risk present in the market. The sortino ratio
shows the value of 0.0017 which is the lowest among the 4 ratios. It shows that the social funds
have the highest risk of downside volatility (Robiyanto 2018).
Task 3
In the above case, it is seen that a hedge fund manager has an initial cash balance of
£350,000, which he needs to invest fully or partially to obtain profitable outcomes. To ensure
⊘ This is a preview!⊘
Do you want full access?
Subscribe today to unlock all pages.
Trusted by 1+ million students worldwide
1 out of 23
Related Documents


Your All-in-One AI-Powered Toolkit for Academic Success.
+13062052269
info@desklib.com
Available 24*7 on WhatsApp / Email
![[object Object]](/_next/static/media/star-bottom.7253800d.svg)
Unlock your academic potential
Copyright © 2020–2026 A2Z Services. All Rights Reserved. Developed and managed by ZUCOL.