Investment and Portfolio Management: Performance and Analysis Report

Verified

Added on  2021/06/18

|18
|3614
|47
Report
AI Summary
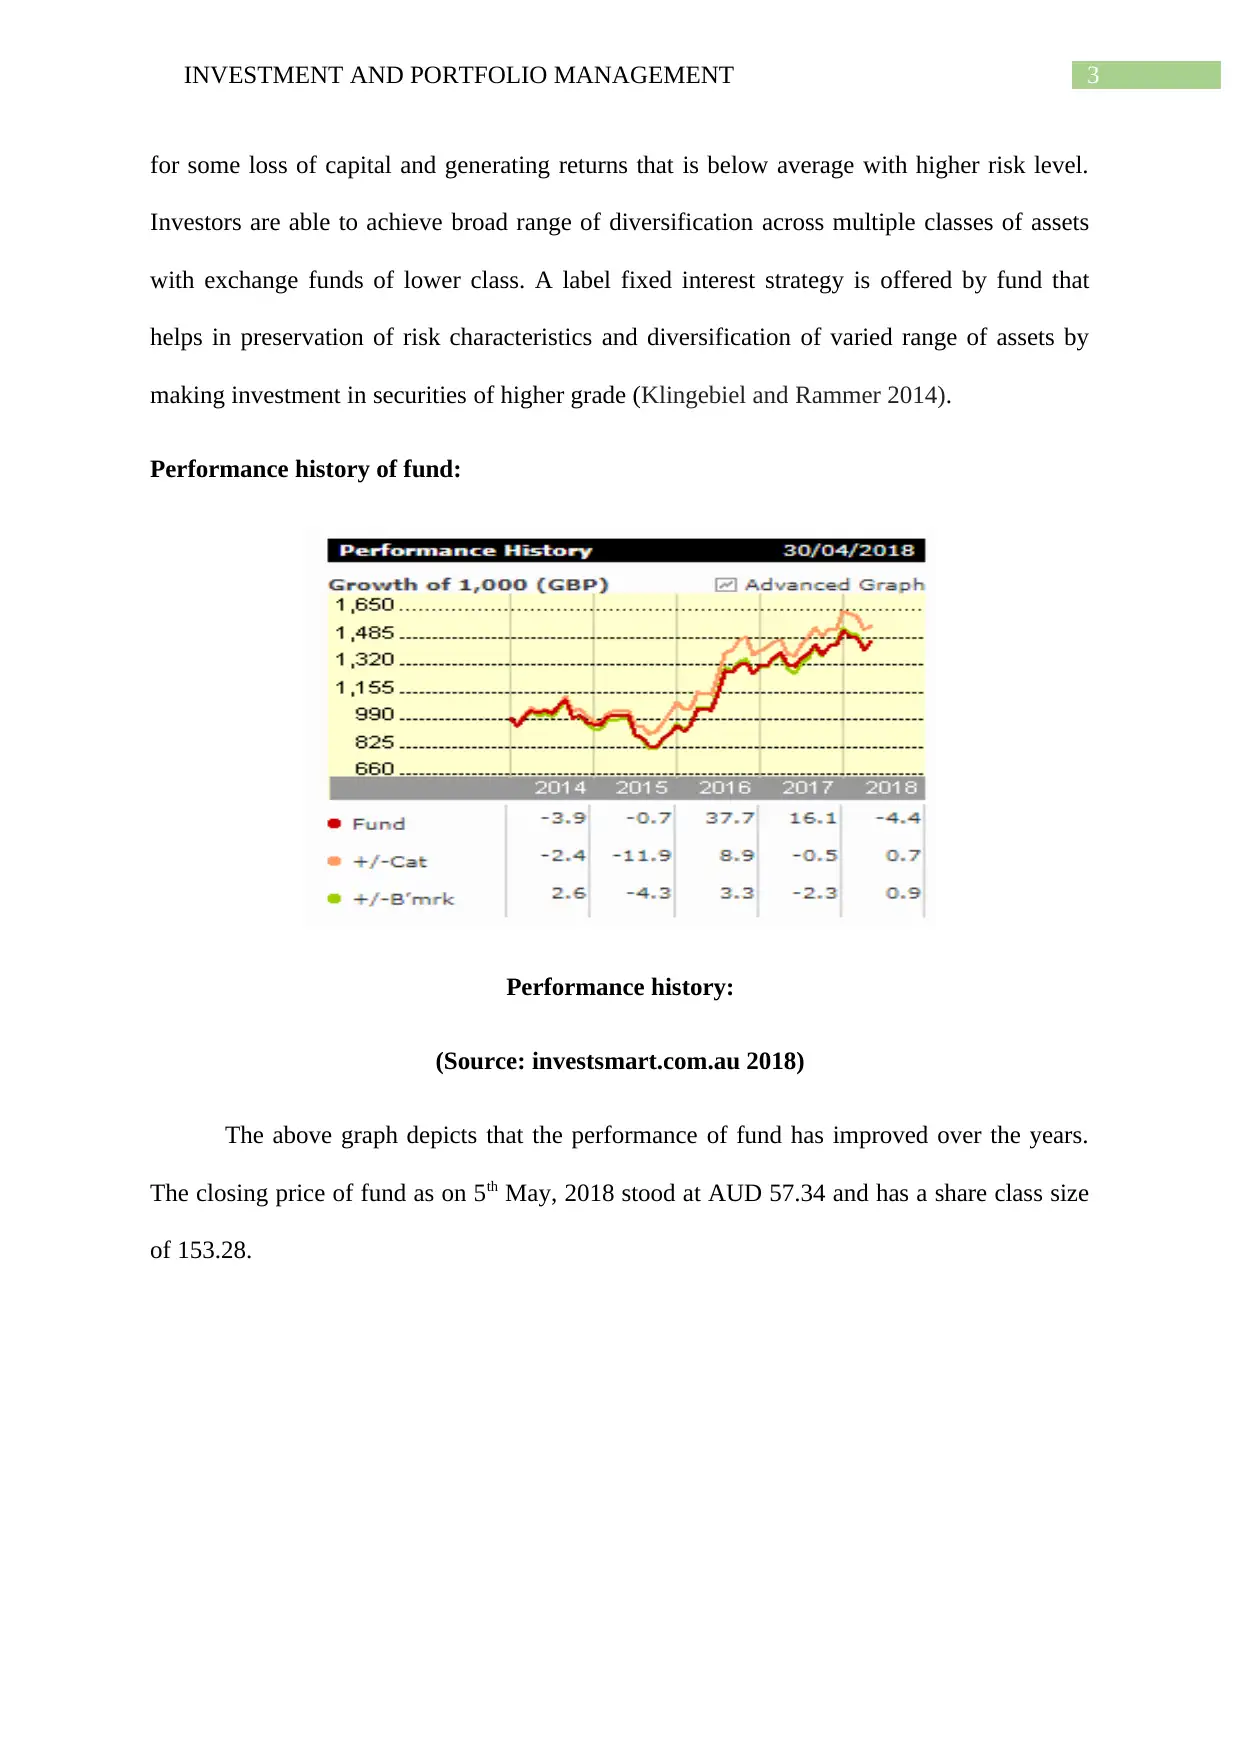
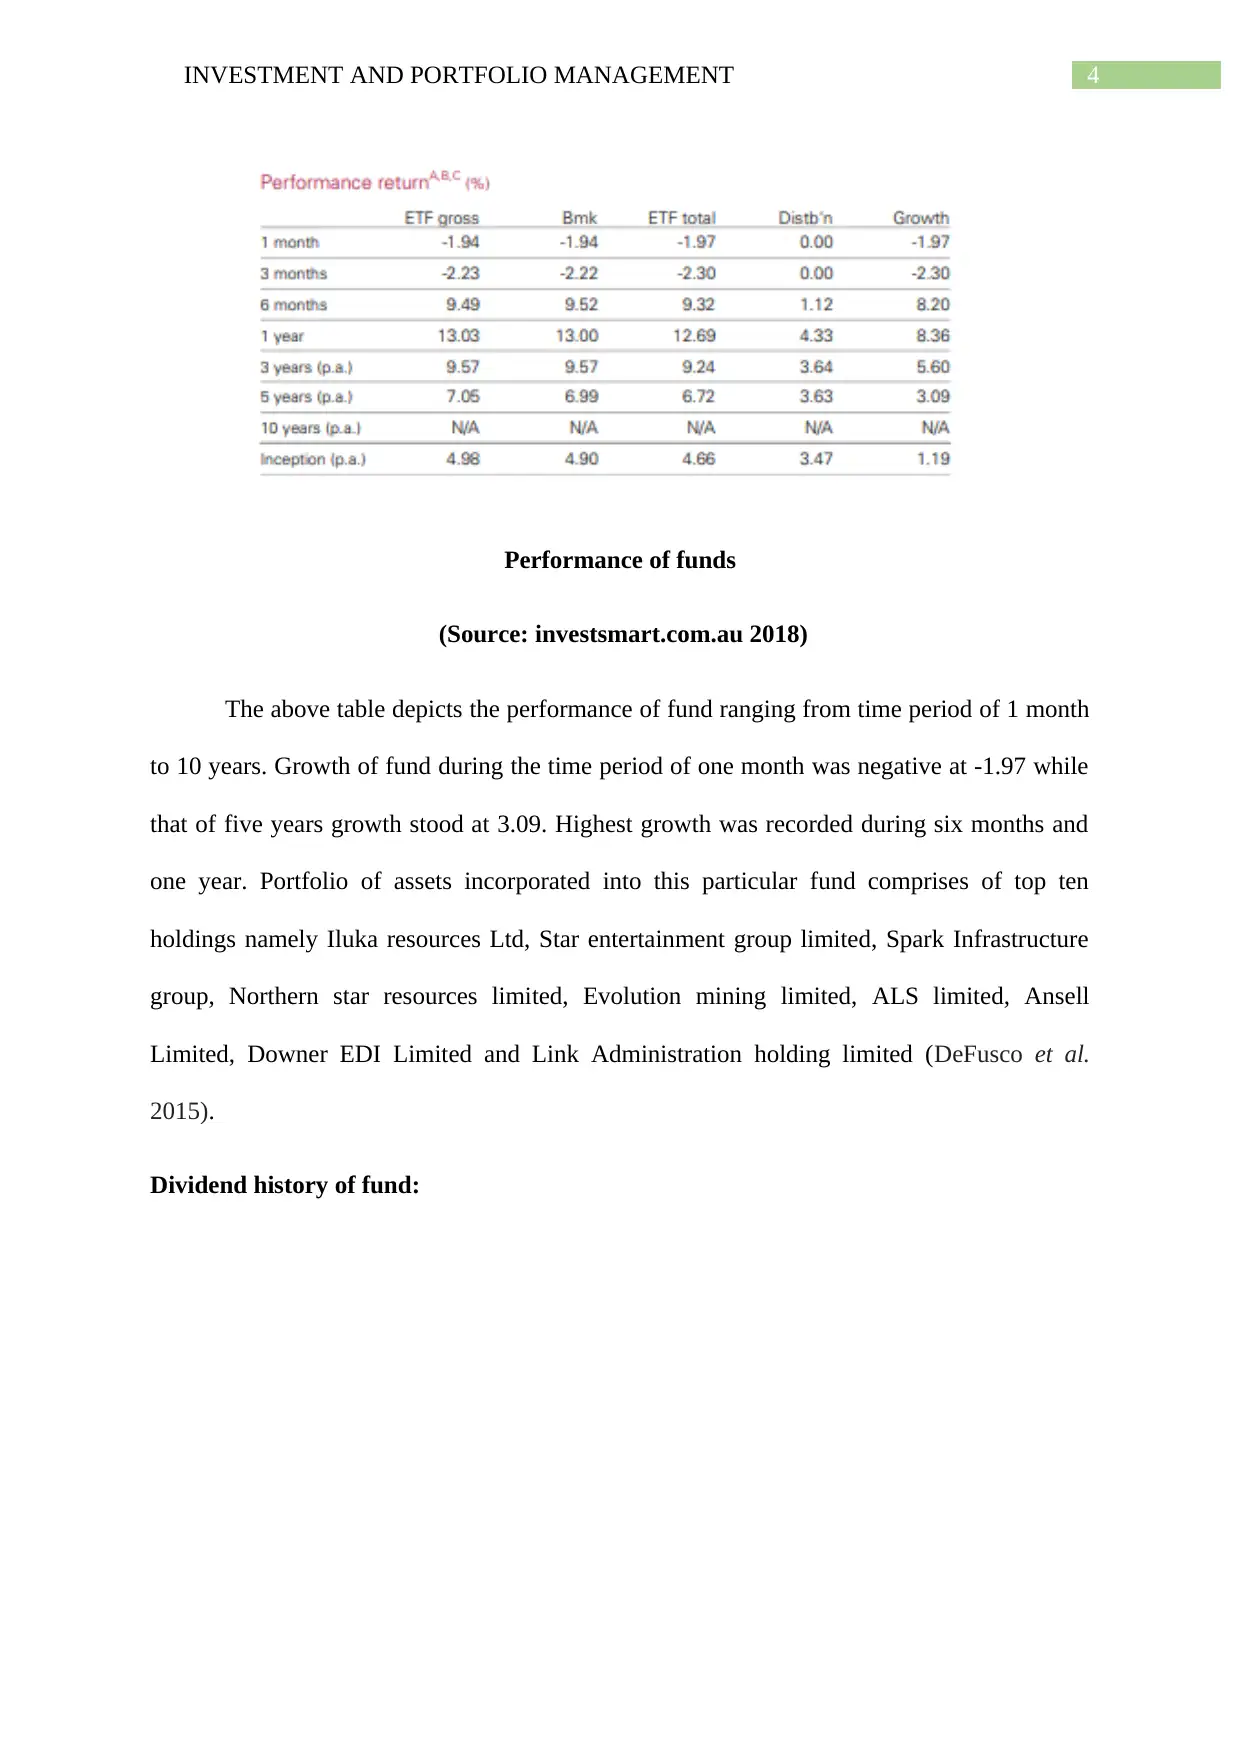
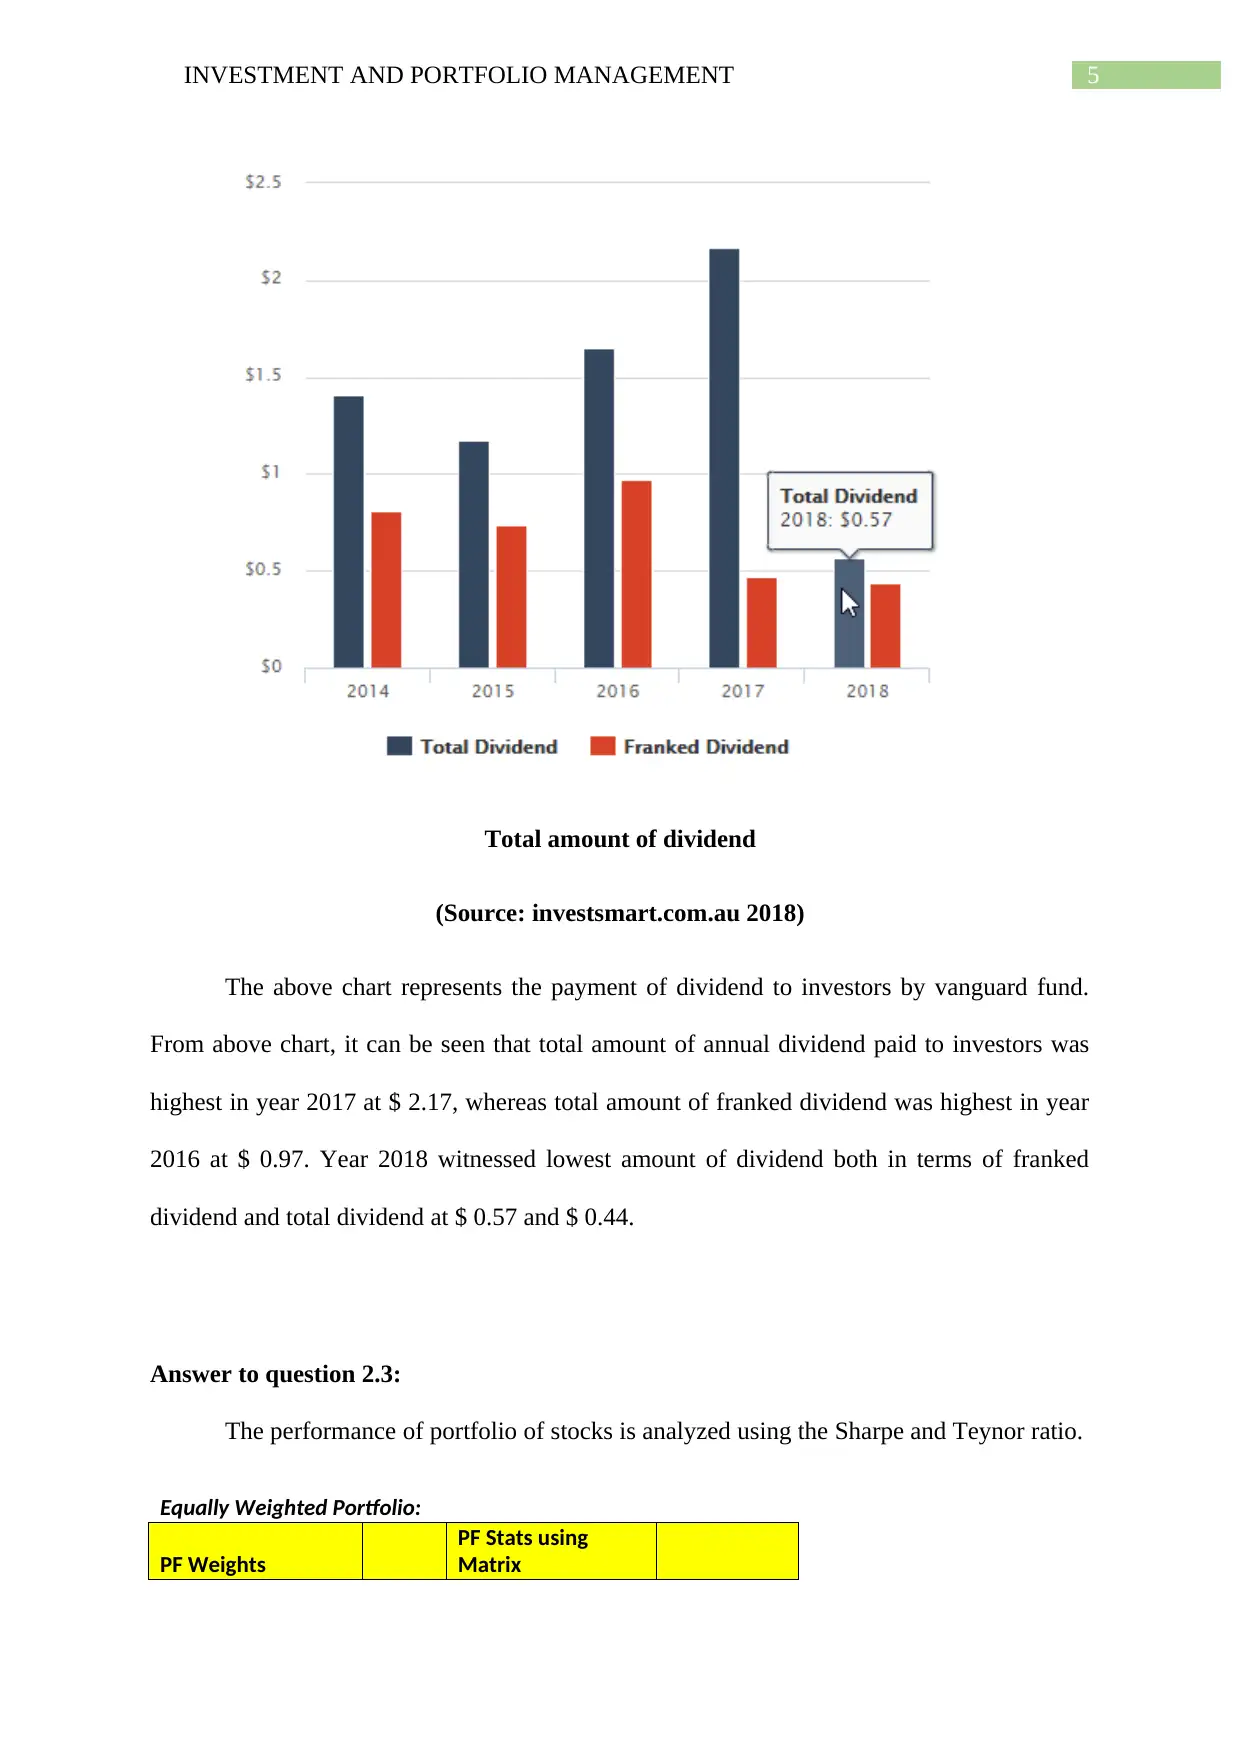
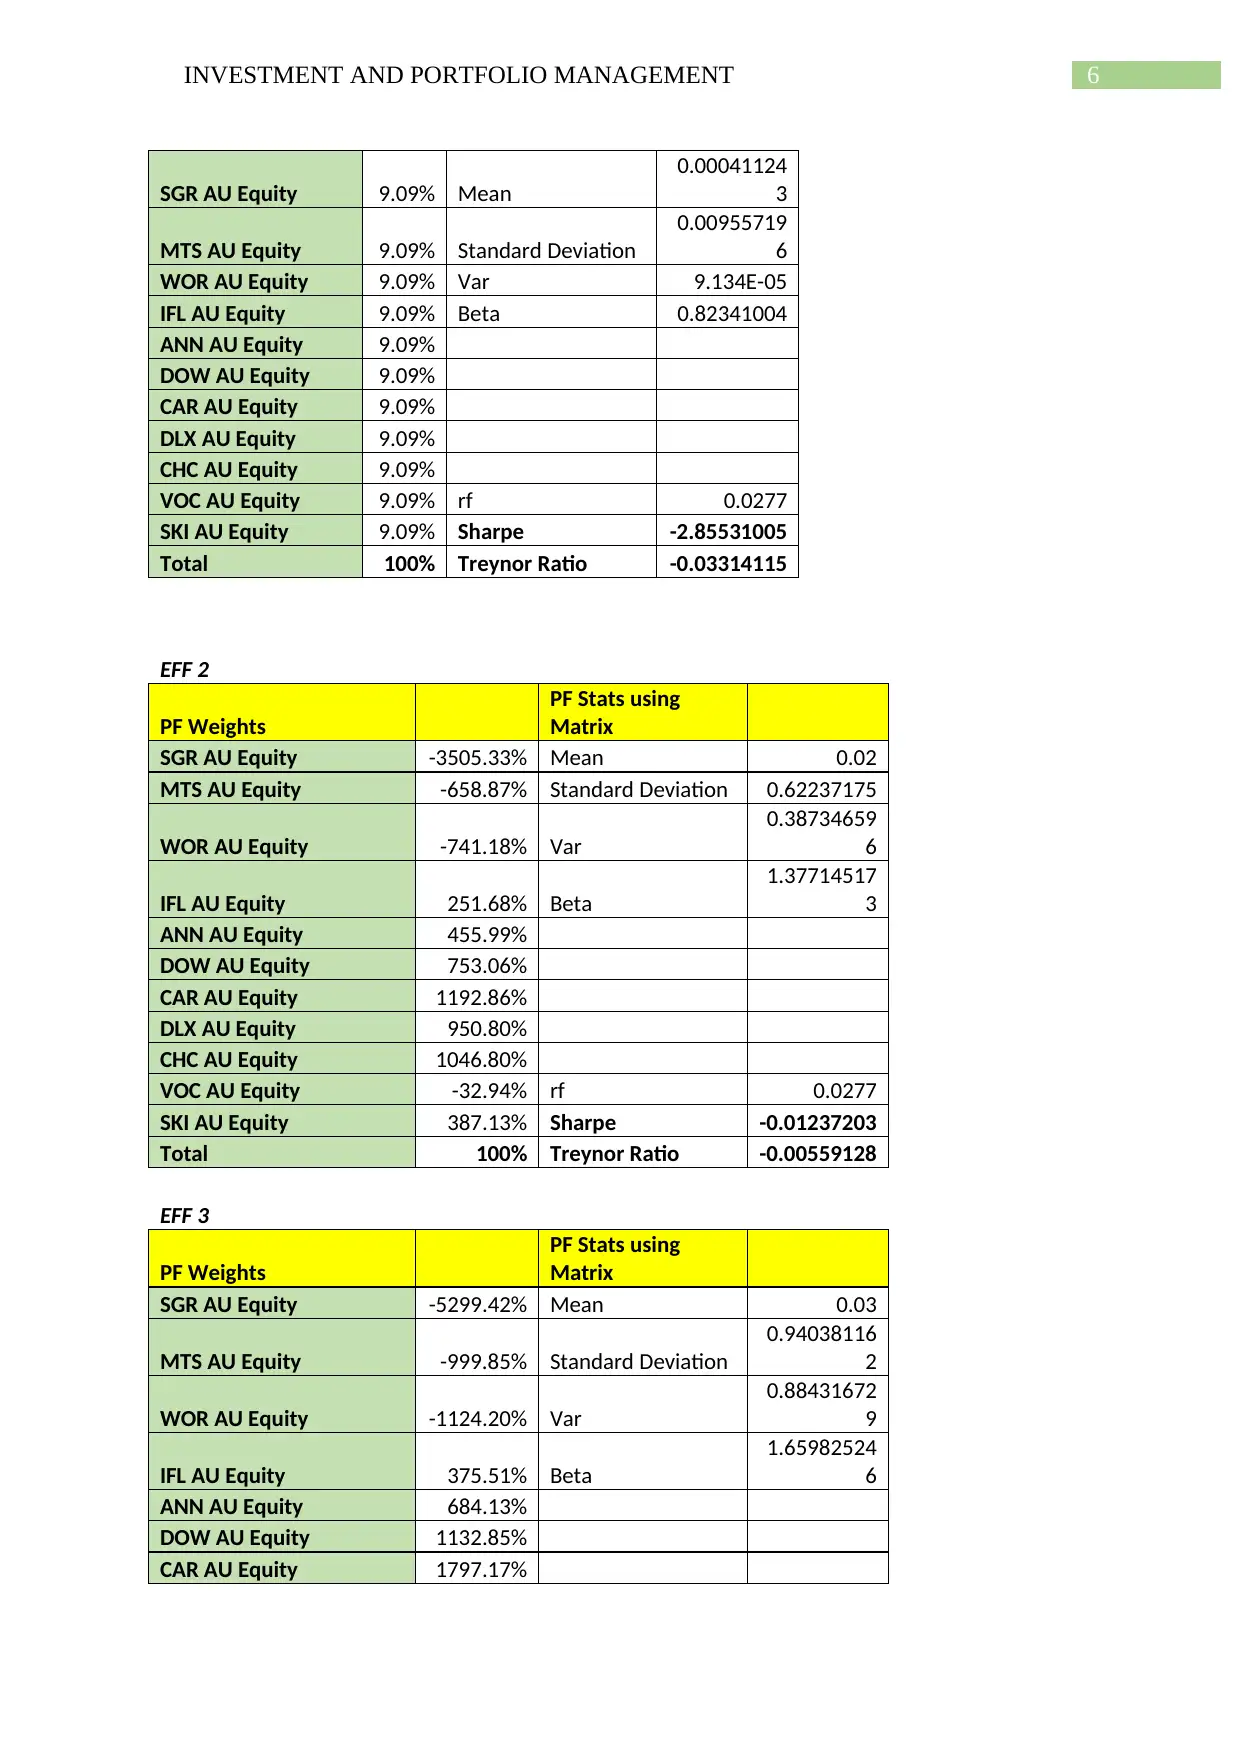
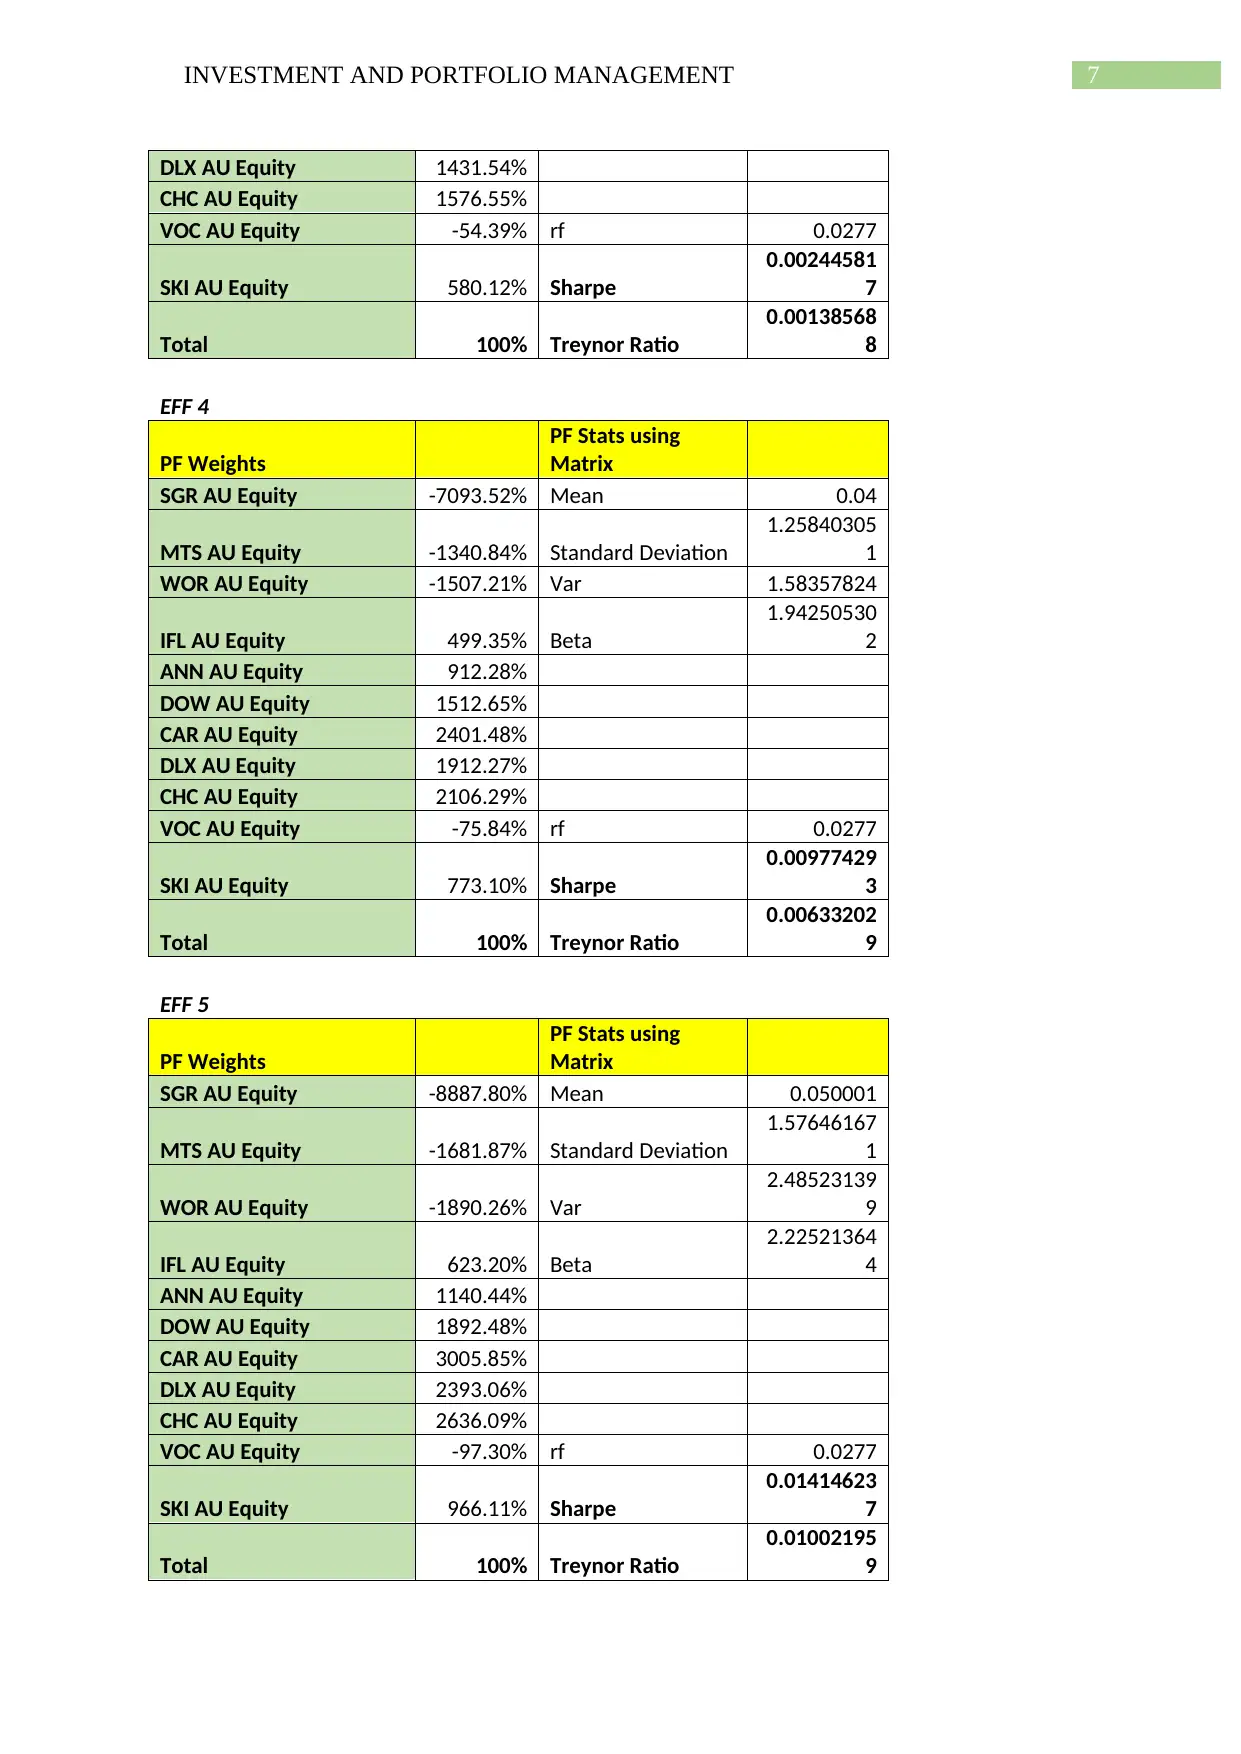
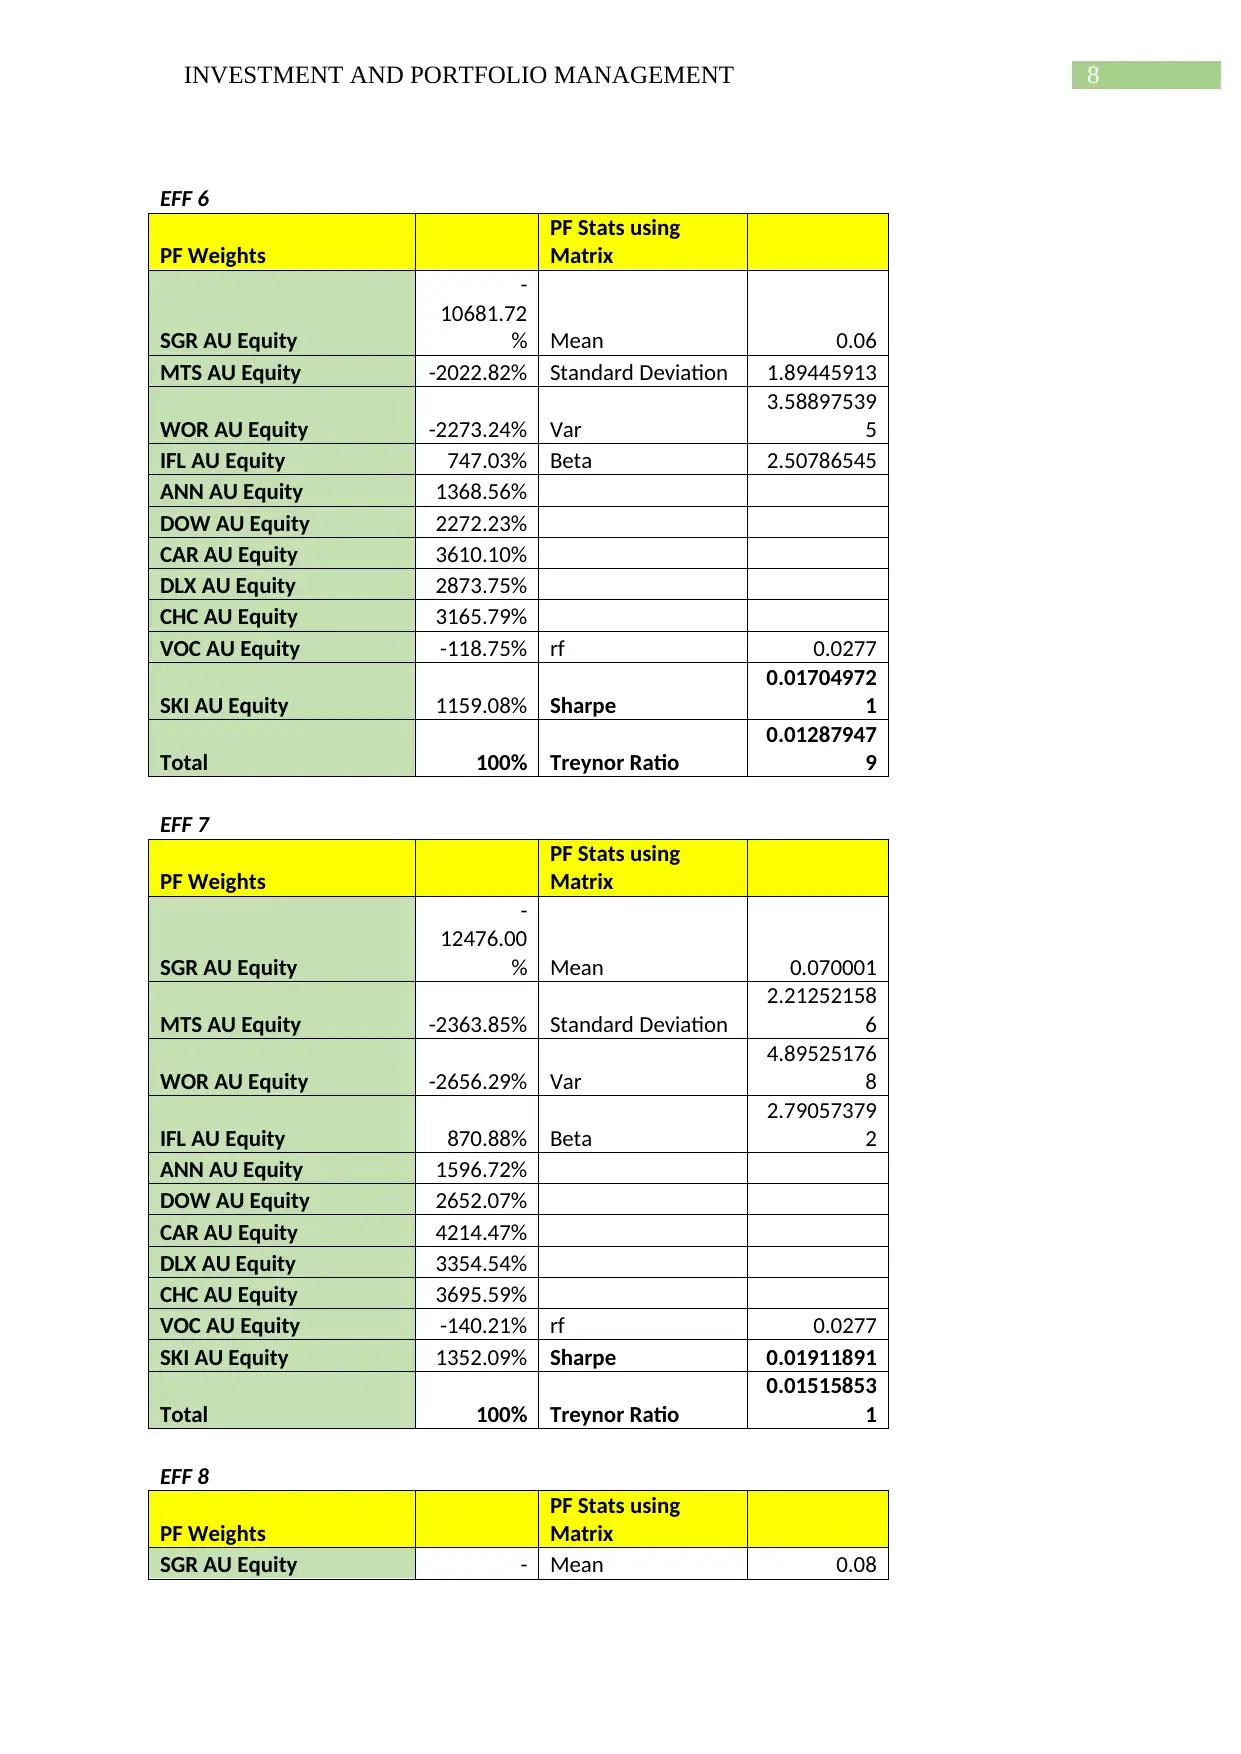
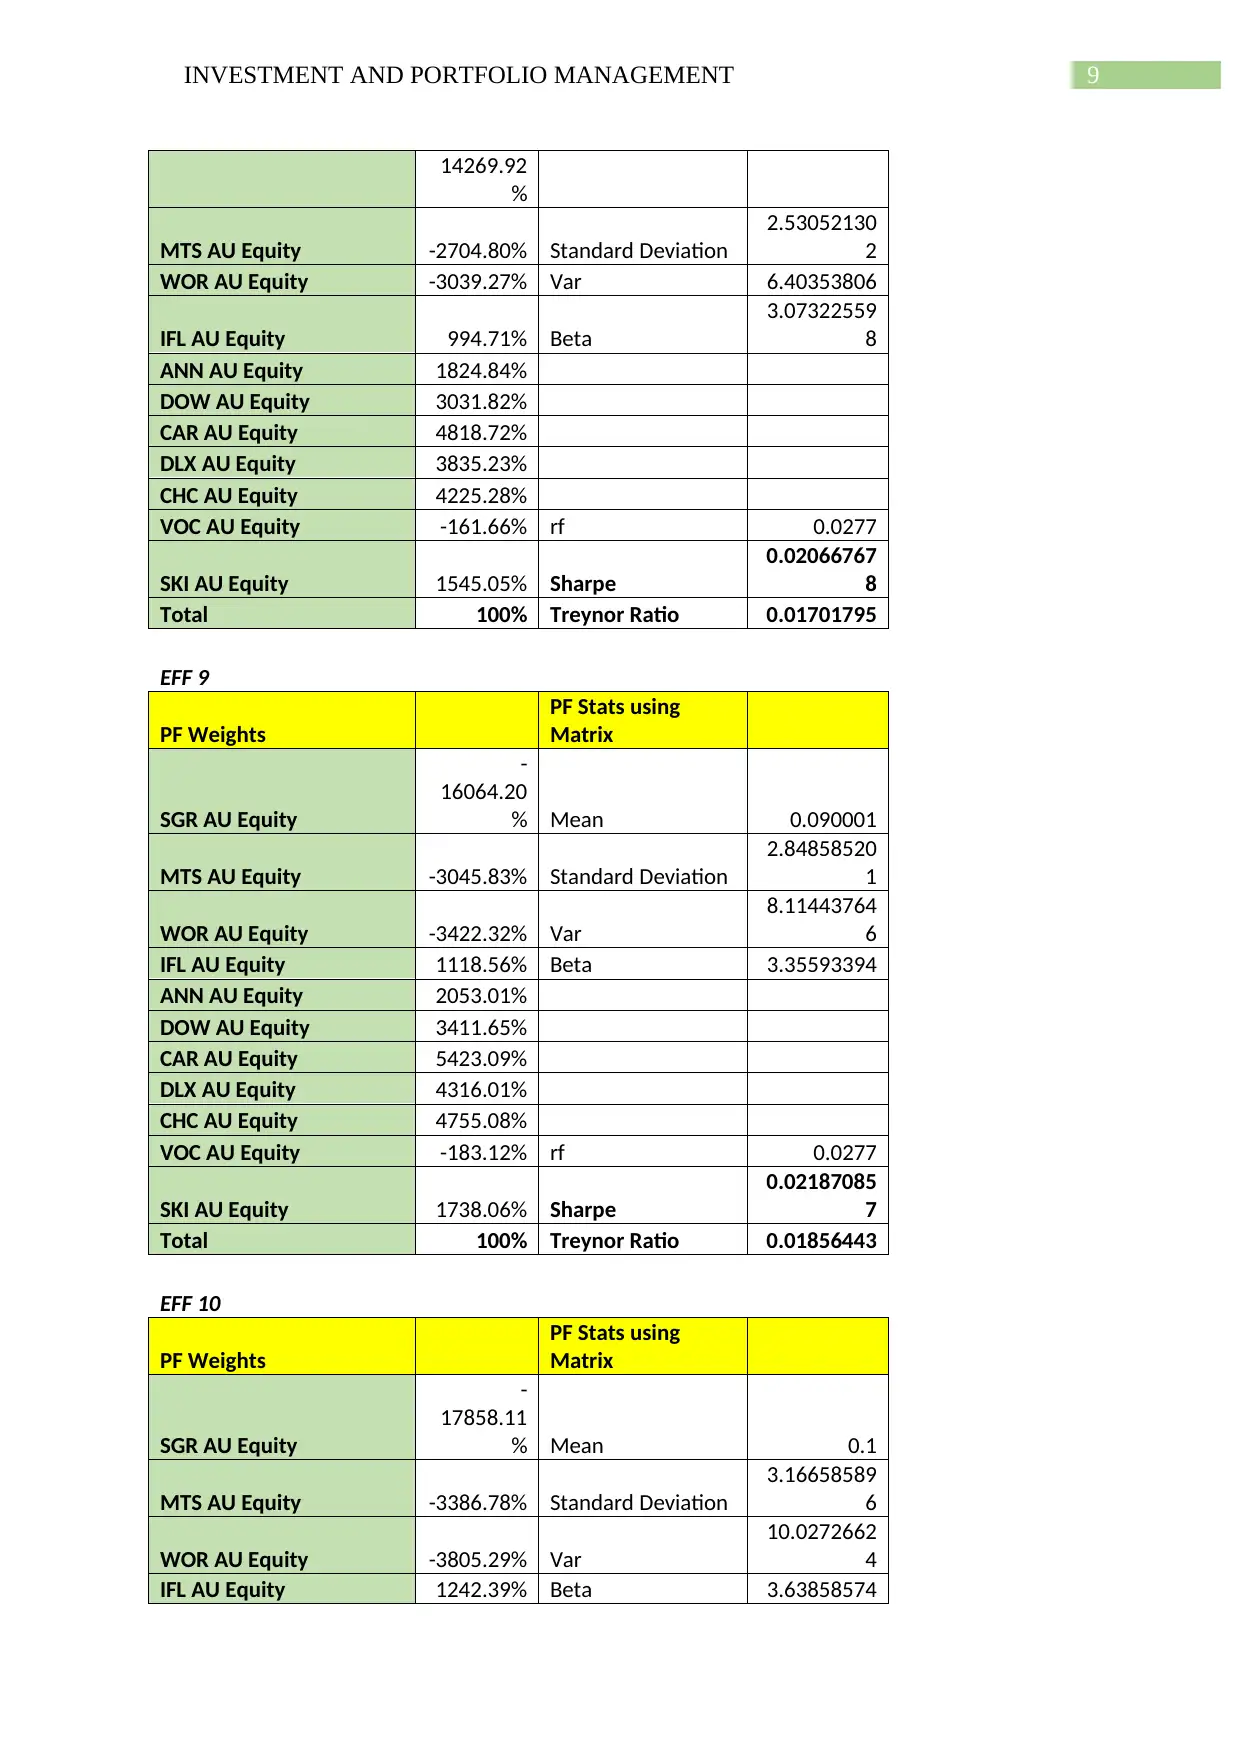
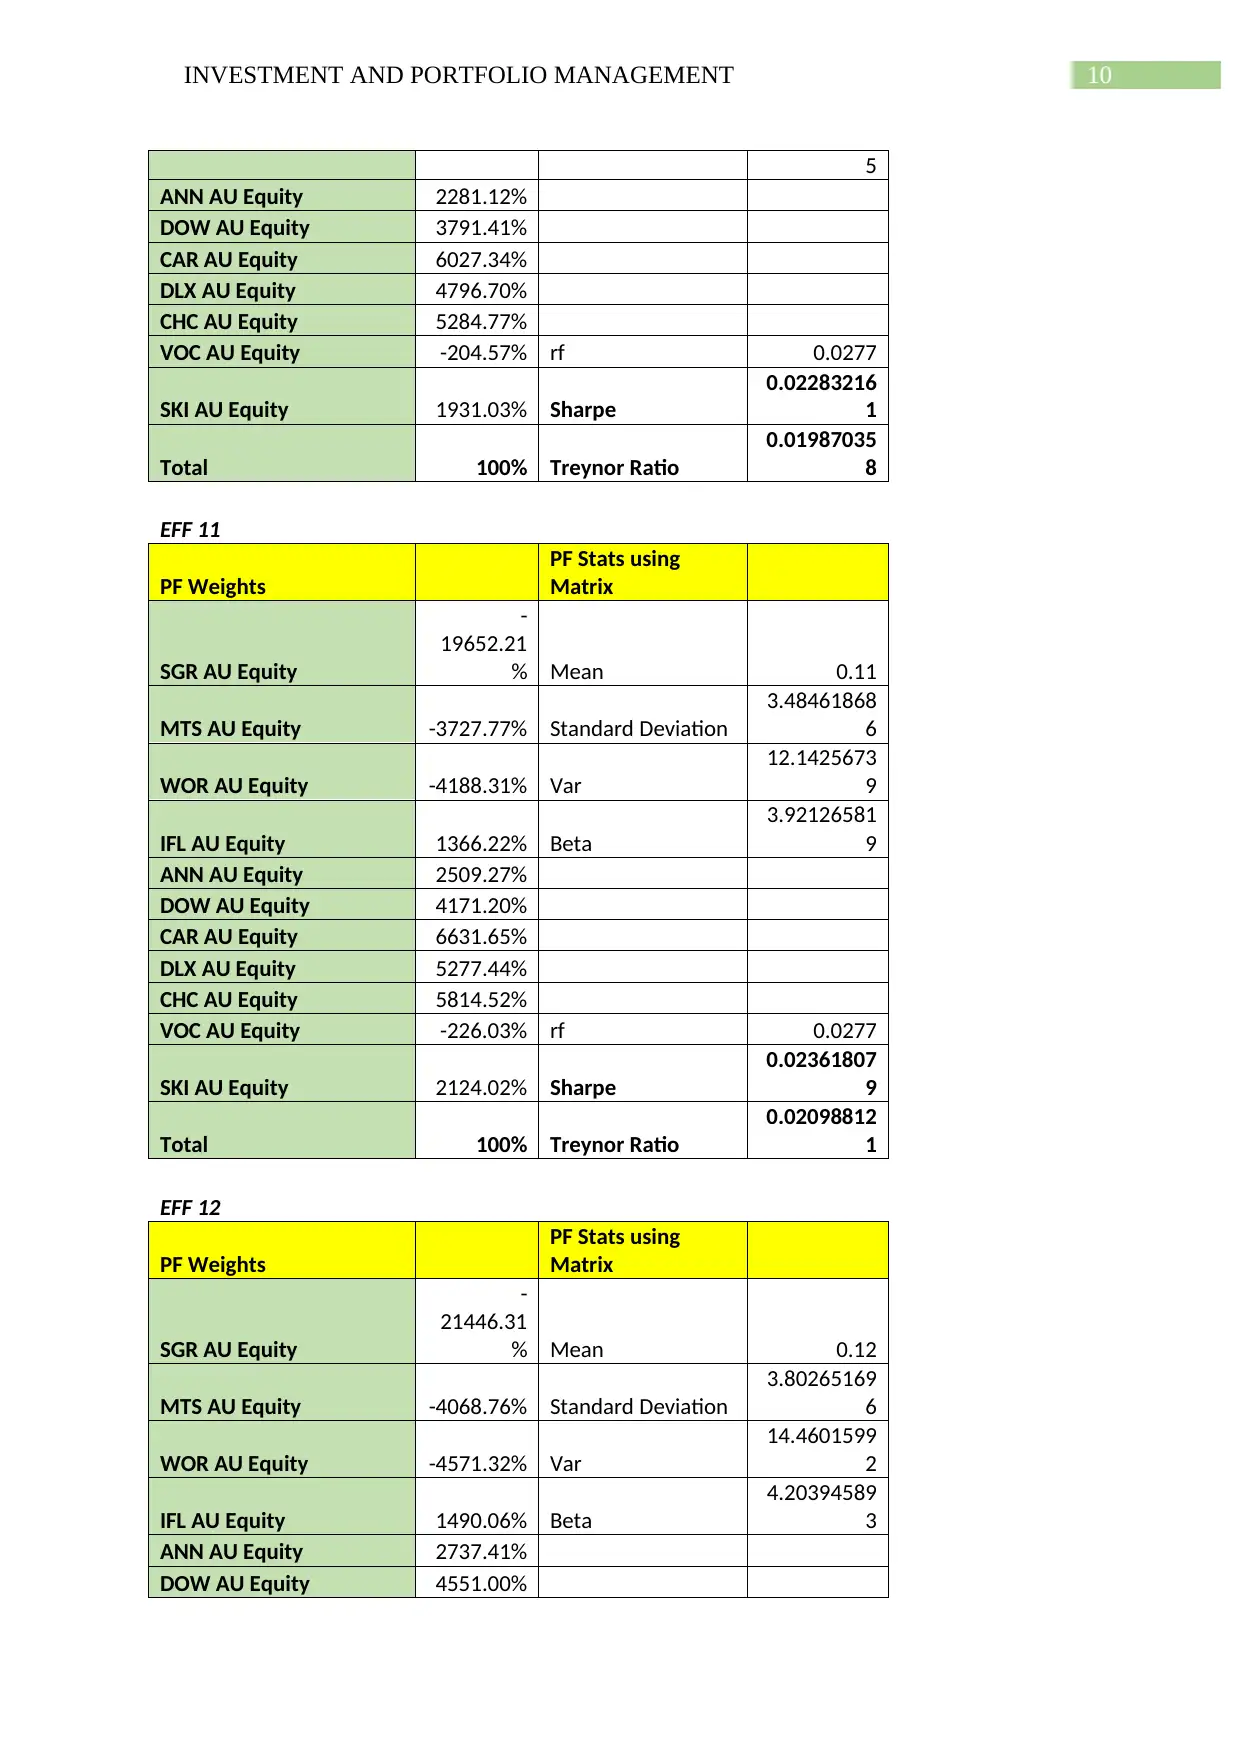
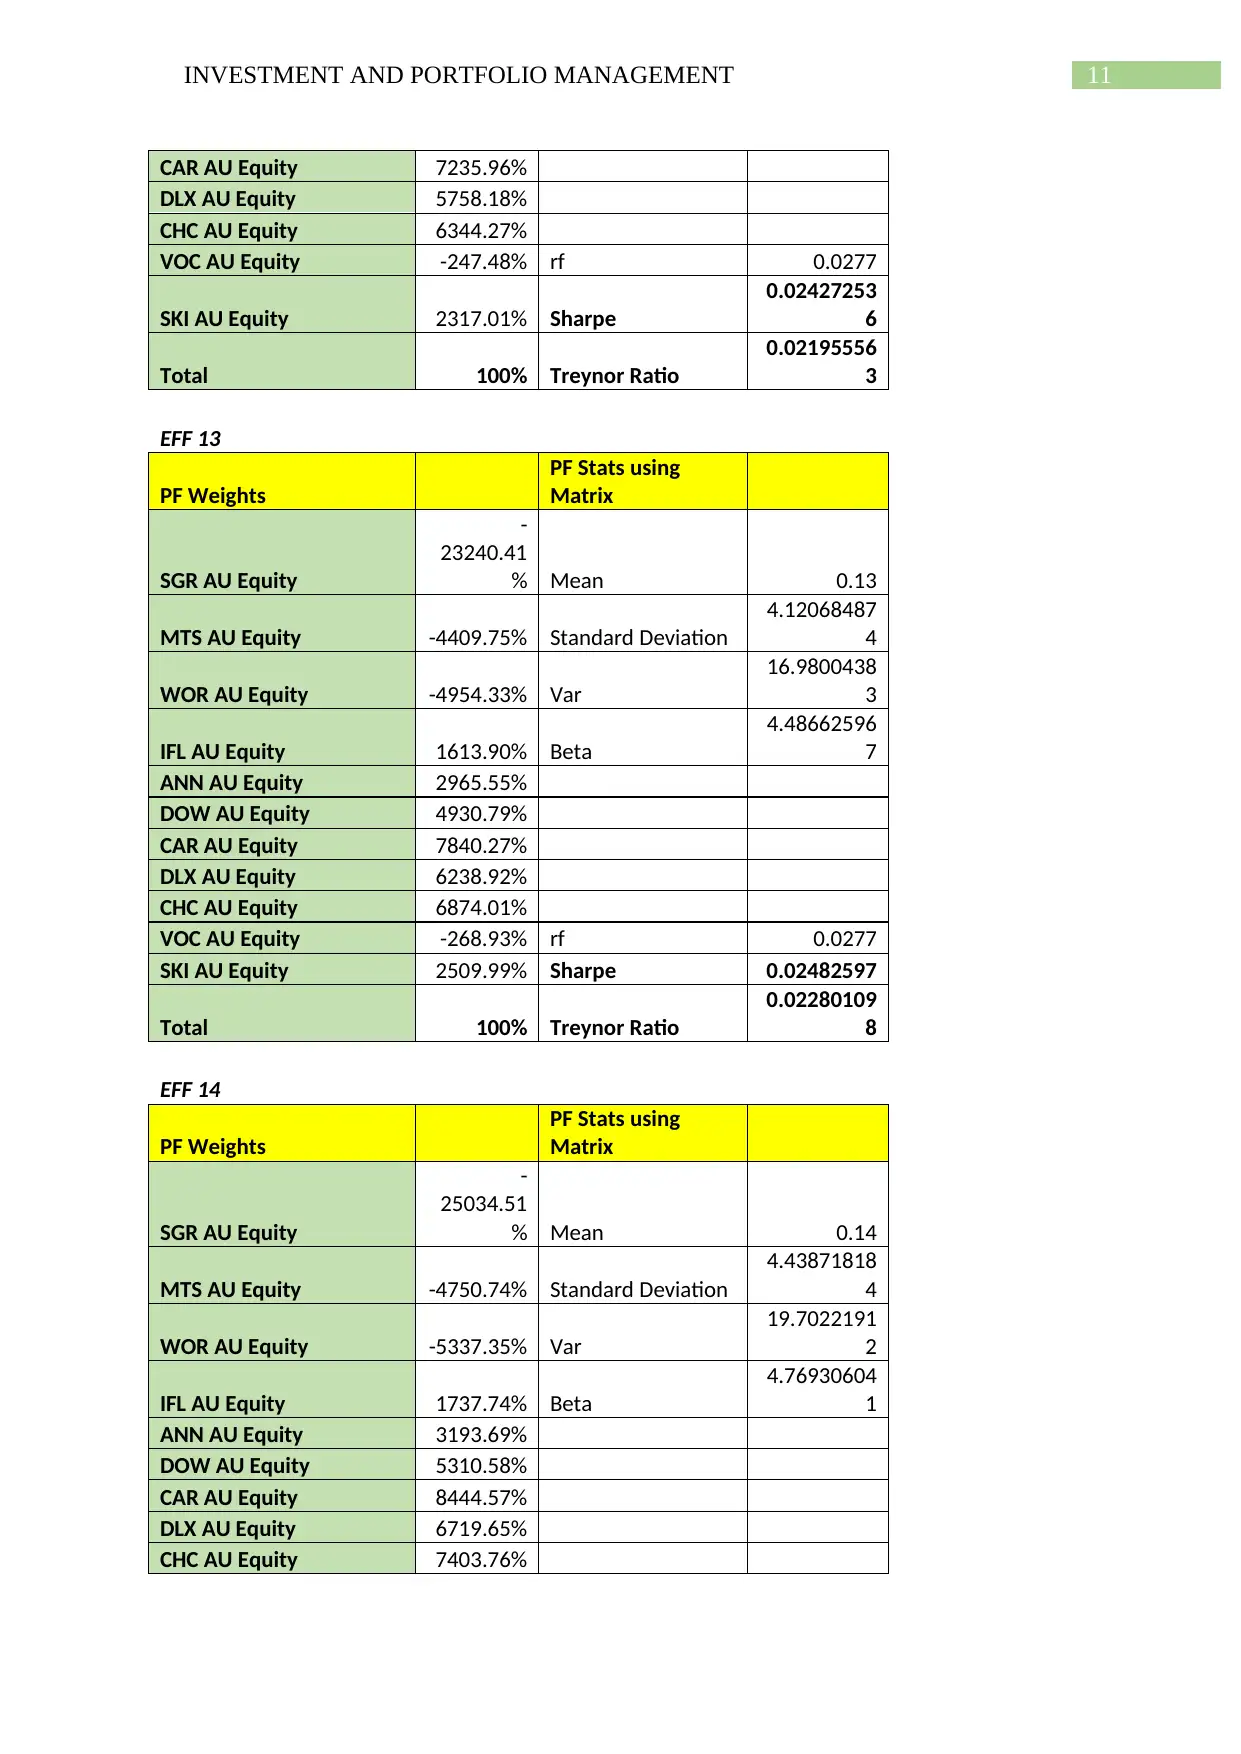
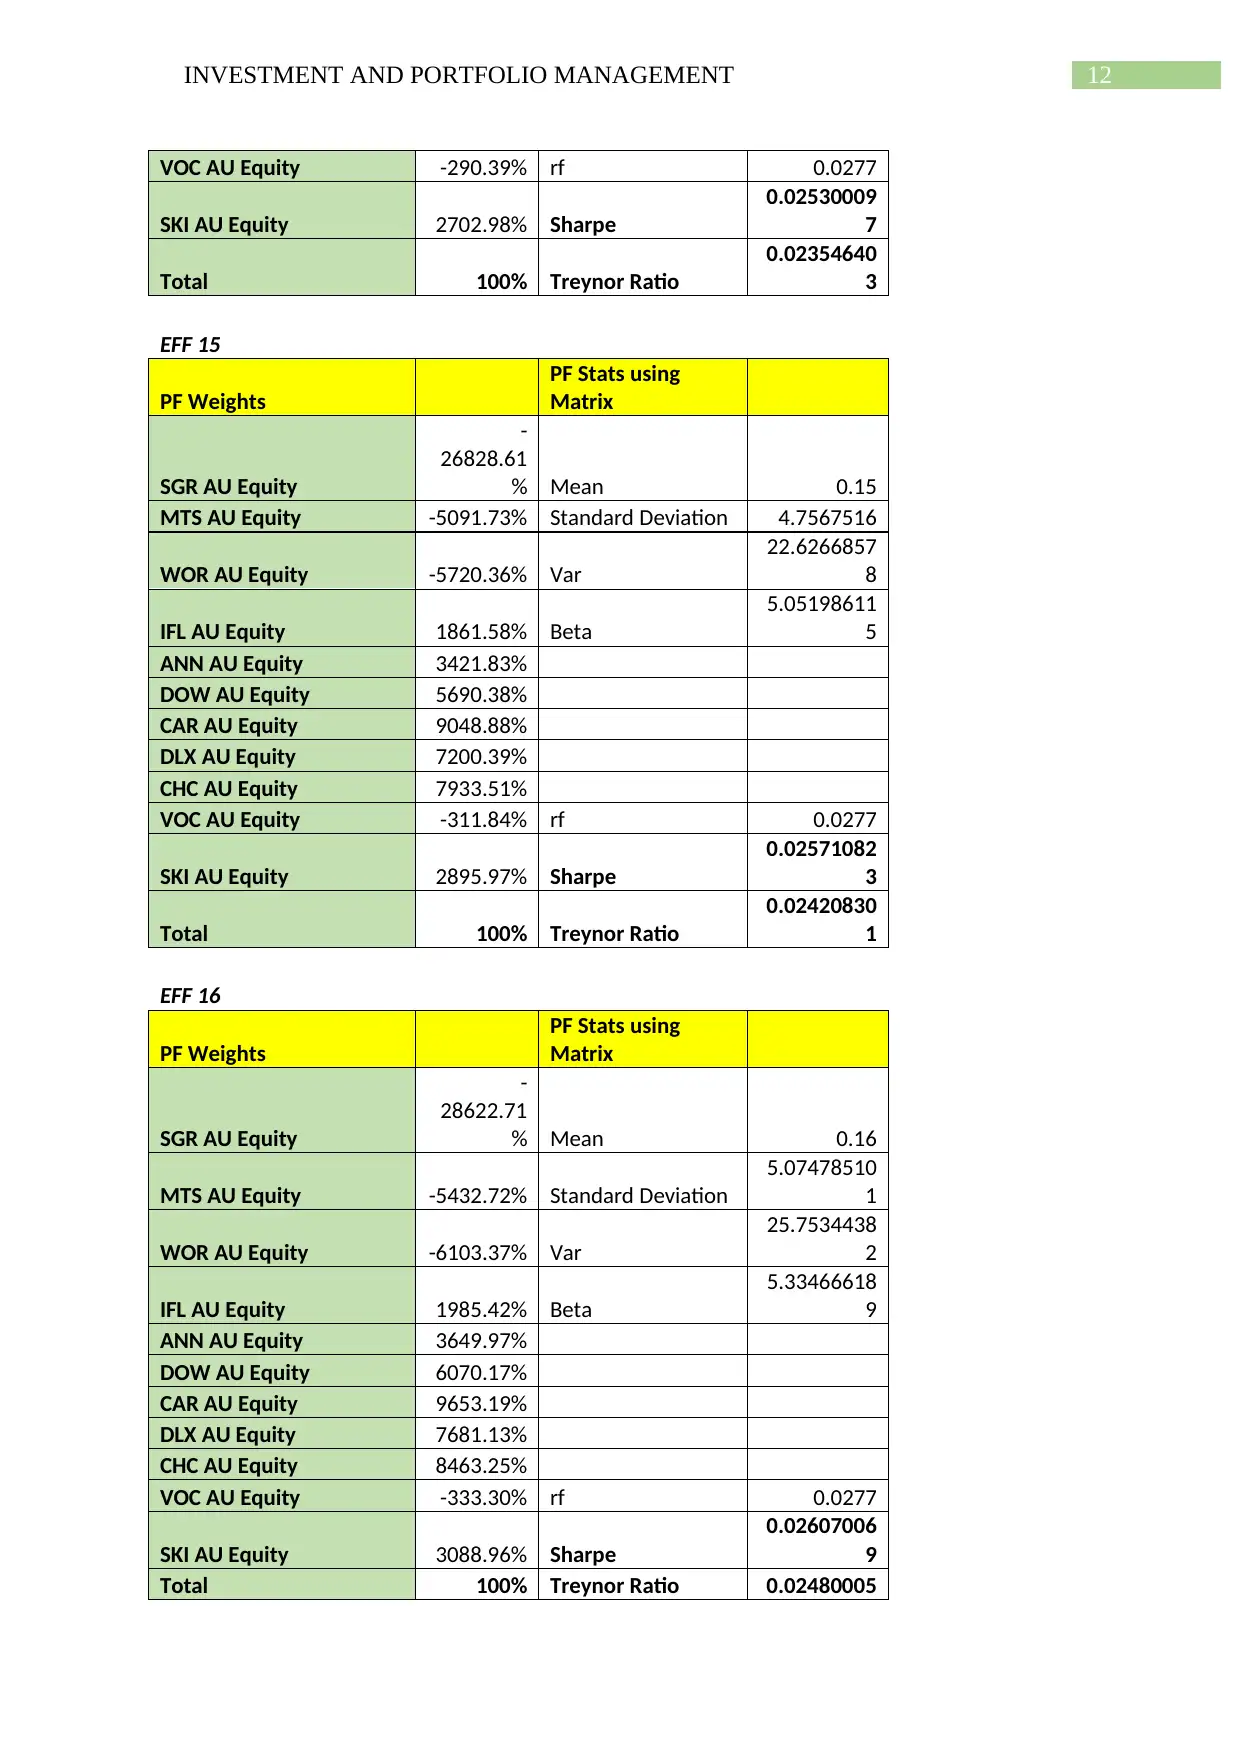
This report provides a comprehensive analysis of investment and portfolio management, focusing on the Vanguard MSCI Australian small companies index. It begins with an overview of the fund, its objectives, and investment strategies, highlighting its aim to match the returns of the MSCI small cap index and provide diversified exposure to Australian small companies. The report examines the fund's performance history, including closing prices, share class size, and growth over various time periods, supported by data from investsmart.com.au. The portfolio's composition is detailed, listing the top ten holdings and dividend history. Furthermore, the report assesses portfolio performance using Sharpe and Treynor ratios across multiple efficiency frontiers, providing insights into risk-adjusted returns and portfolio optimization. The analysis includes equally weighted portfolios and explores different weight allocations to evaluate their impact on key performance indicators. The findings offer valuable insights into the fund's performance, risk profile, and investment strategies, making it a useful resource for investors and financial analysts.
Document Page
Running head: INVESTMENT AND PORTFOLIO MANAGEMENT
Investment and portfolio management
University Name
Student Name
Authors’ Note
tabler-icon-diamond-filled.svg

Paraphrase This Document

Need a fresh take? Get an instant paraphrase of this document with our AI Paraphraser
Document Page
2INVESTMENT AND PORTFOLIO MANAGEMENT
Answer to question 2.2:
Vanguard MSCI Australian small companies index is an exchange traded fund that
intends to match the return in terms of capital appreciation and income of the MSCI small cap
index Australian shares. The fund is a small capitalisation index that generally involves
smaller companies on the equity market of Australia that target coverage of around 14% of
free float of market capitalisation of share market that is adjusted. Such return from fund is
considered before the expenses, tax and fees are taken into consideration. The fund intends to
provide investors with diversified exposure and low cost to the small companies that is listed
on stock exchange of Australia. This is indicative of the fact that investors are provided with
the low cost way for making investment in the portfolio of smallest companies of Australia.
A sector in which the investment is made by the fund involves materials, industrial,
financials, real estate, information technology, healthcare, Utilities, energy, consumer staples
and customer discretionary (Stettina and Hörz 2015). It can therefore be seen that the fund
makes investment in diversified sectors with maximum percentage of allocation made in
materials sector and minimum allocation made in 1.2. A long term potential capital growth is
offered by the fund that can be typical to the market sector of small company.
Objective and strategies of fund:
The objective of fund is to track the appreciation of capita and income of the FTSE
ASFA Australia index high dividend yield. Most of the securities of fund will involve FTSE
ASFA Australia index high dividend yield that will allow weighting on individual security to
vary marginally from index. In addition to this, investment in securities may be made by fund
that is expected to be included in the index it has been removed form index. The fund
provides investors with benefits of diversification, potential return that is tax effective, risks
and potential of capital growth and income that is tax effective. Moreover, fund has potential
Document Page
3INVESTMENT AND PORTFOLIO MANAGEMENT
for some loss of capital and generating returns that is below average with higher risk level.
Investors are able to achieve broad range of diversification across multiple classes of assets
with exchange funds of lower class. A label fixed interest strategy is offered by fund that
helps in preservation of risk characteristics and diversification of varied range of assets by
making investment in securities of higher grade (Klingebiel and Rammer 2014).
Performance history of fund:
Performance history:
(Source: investsmart.com.au 2018)
The above graph depicts that the performance of fund has improved over the years.
The closing price of fund as on 5th May, 2018 stood at AUD 57.34 and has a share class size
of 153.28.
Document Page
4INVESTMENT AND PORTFOLIO MANAGEMENT
Performance of funds
(Source: investsmart.com.au 2018)
The above table depicts the performance of fund ranging from time period of 1 month
to 10 years. Growth of fund during the time period of one month was negative at -1.97 while
that of five years growth stood at 3.09. Highest growth was recorded during six months and
one year. Portfolio of assets incorporated into this particular fund comprises of top ten
holdings namely Iluka resources Ltd, Star entertainment group limited, Spark Infrastructure
group, Northern star resources limited, Evolution mining limited, ALS limited, Ansell
Limited, Downer EDI Limited and Link Administration holding limited (DeFusco et al.
2015).
Dividend history of fund:
tabler-icon-diamond-filled.svg

Paraphrase This Document

Need a fresh take? Get an instant paraphrase of this document with our AI Paraphraser
Document Page
5INVESTMENT AND PORTFOLIO MANAGEMENT
Total amount of dividend
(Source: investsmart.com.au 2018)
The above chart represents the payment of dividend to investors by vanguard fund.
From above chart, it can be seen that total amount of annual dividend paid to investors was
highest in year 2017 at $ 2.17, whereas total amount of franked dividend was highest in year
2016 at $ 0.97. Year 2018 witnessed lowest amount of dividend both in terms of franked
dividend and total dividend at $ 0.57 and $ 0.44.
Answer to question 2.3:
The performance of portfolio of stocks is analyzed using the Sharpe and Teynor ratio.
Equally Weighted Portfolio:
PF Weights
PF Stats using
Matrix
Document Page
6INVESTMENT AND PORTFOLIO MANAGEMENT
SGR AU Equity 9.09% Mean
0.00041124
3
MTS AU Equity 9.09% Standard Deviation
0.00955719
6
WOR AU Equity 9.09% Var 9.134E-05
IFL AU Equity 9.09% Beta 0.82341004
ANN AU Equity 9.09%
DOW AU Equity 9.09%
CAR AU Equity 9.09%
DLX AU Equity 9.09%
CHC AU Equity 9.09%
VOC AU Equity 9.09% rf 0.0277
SKI AU Equity 9.09% Sharpe -2.85531005
Total 100% Treynor Ratio -0.03314115
EFF 2
PF Weights
PF Stats using
Matrix
SGR AU Equity -3505.33% Mean 0.02
MTS AU Equity -658.87% Standard Deviation 0.62237175
WOR AU Equity -741.18% Var
0.38734659
6
IFL AU Equity 251.68% Beta
1.37714517
3
ANN AU Equity 455.99%
DOW AU Equity 753.06%
CAR AU Equity 1192.86%
DLX AU Equity 950.80%
CHC AU Equity 1046.80%
VOC AU Equity -32.94% rf 0.0277
SKI AU Equity 387.13% Sharpe -0.01237203
Total 100% Treynor Ratio -0.00559128
EFF 3
PF Weights
PF Stats using
Matrix
SGR AU Equity -5299.42% Mean 0.03
MTS AU Equity -999.85% Standard Deviation
0.94038116
2
WOR AU Equity -1124.20% Var
0.88431672
9
IFL AU Equity 375.51% Beta
1.65982524
6
ANN AU Equity 684.13%
DOW AU Equity 1132.85%
CAR AU Equity 1797.17%
Document Page
7INVESTMENT AND PORTFOLIO MANAGEMENT
DLX AU Equity 1431.54%
CHC AU Equity 1576.55%
VOC AU Equity -54.39% rf 0.0277
SKI AU Equity 580.12% Sharpe
0.00244581
7
Total 100% Treynor Ratio
0.00138568
8
EFF 4
PF Weights
PF Stats using
Matrix
SGR AU Equity -7093.52% Mean 0.04
MTS AU Equity -1340.84% Standard Deviation
1.25840305
1
WOR AU Equity -1507.21% Var 1.58357824
IFL AU Equity 499.35% Beta
1.94250530
2
ANN AU Equity 912.28%
DOW AU Equity 1512.65%
CAR AU Equity 2401.48%
DLX AU Equity 1912.27%
CHC AU Equity 2106.29%
VOC AU Equity -75.84% rf 0.0277
SKI AU Equity 773.10% Sharpe
0.00977429
3
Total 100% Treynor Ratio
0.00633202
9
EFF 5
PF Weights
PF Stats using
Matrix
SGR AU Equity -8887.80% Mean 0.050001
MTS AU Equity -1681.87% Standard Deviation
1.57646167
1
WOR AU Equity -1890.26% Var
2.48523139
9
IFL AU Equity 623.20% Beta
2.22521364
4
ANN AU Equity 1140.44%
DOW AU Equity 1892.48%
CAR AU Equity 3005.85%
DLX AU Equity 2393.06%
CHC AU Equity 2636.09%
VOC AU Equity -97.30% rf 0.0277
SKI AU Equity 966.11% Sharpe
0.01414623
7
Total 100% Treynor Ratio
0.01002195
9
tabler-icon-diamond-filled.svg

Paraphrase This Document

Need a fresh take? Get an instant paraphrase of this document with our AI Paraphraser
Document Page
8INVESTMENT AND PORTFOLIO MANAGEMENT
EFF 6
PF Weights
PF Stats using
Matrix
SGR AU Equity
-
10681.72
% Mean 0.06
MTS AU Equity -2022.82% Standard Deviation 1.89445913
WOR AU Equity -2273.24% Var
3.58897539
5
IFL AU Equity 747.03% Beta 2.50786545
ANN AU Equity 1368.56%
DOW AU Equity 2272.23%
CAR AU Equity 3610.10%
DLX AU Equity 2873.75%
CHC AU Equity 3165.79%
VOC AU Equity -118.75% rf 0.0277
SKI AU Equity 1159.08% Sharpe
0.01704972
1
Total 100% Treynor Ratio
0.01287947
9
EFF 7
PF Weights
PF Stats using
Matrix
SGR AU Equity
-
12476.00
% Mean 0.070001
MTS AU Equity -2363.85% Standard Deviation
2.21252158
6
WOR AU Equity -2656.29% Var
4.89525176
8
IFL AU Equity 870.88% Beta
2.79057379
2
ANN AU Equity 1596.72%
DOW AU Equity 2652.07%
CAR AU Equity 4214.47%
DLX AU Equity 3354.54%
CHC AU Equity 3695.59%
VOC AU Equity -140.21% rf 0.0277
SKI AU Equity 1352.09% Sharpe 0.01911891
Total 100% Treynor Ratio
0.01515853
1
EFF 8
PF Weights
PF Stats using
Matrix
SGR AU Equity - Mean 0.08
Document Page
9INVESTMENT AND PORTFOLIO MANAGEMENT
14269.92
%
MTS AU Equity -2704.80% Standard Deviation
2.53052130
2
WOR AU Equity -3039.27% Var 6.40353806
IFL AU Equity 994.71% Beta
3.07322559
8
ANN AU Equity 1824.84%
DOW AU Equity 3031.82%
CAR AU Equity 4818.72%
DLX AU Equity 3835.23%
CHC AU Equity 4225.28%
VOC AU Equity -161.66% rf 0.0277
SKI AU Equity 1545.05% Sharpe
0.02066767
8
Total 100% Treynor Ratio 0.01701795
EFF 9
PF Weights
PF Stats using
Matrix
SGR AU Equity
-
16064.20
% Mean 0.090001
MTS AU Equity -3045.83% Standard Deviation
2.84858520
1
WOR AU Equity -3422.32% Var
8.11443764
6
IFL AU Equity 1118.56% Beta 3.35593394
ANN AU Equity 2053.01%
DOW AU Equity 3411.65%
CAR AU Equity 5423.09%
DLX AU Equity 4316.01%
CHC AU Equity 4755.08%
VOC AU Equity -183.12% rf 0.0277
SKI AU Equity 1738.06% Sharpe
0.02187085
7
Total 100% Treynor Ratio 0.01856443
EFF 10
PF Weights
PF Stats using
Matrix
SGR AU Equity
-
17858.11
% Mean 0.1
MTS AU Equity -3386.78% Standard Deviation
3.16658589
6
WOR AU Equity -3805.29% Var
10.0272662
4
IFL AU Equity 1242.39% Beta 3.63858574
Document Page
10INVESTMENT AND PORTFOLIO MANAGEMENT
5
ANN AU Equity 2281.12%
DOW AU Equity 3791.41%
CAR AU Equity 6027.34%
DLX AU Equity 4796.70%
CHC AU Equity 5284.77%
VOC AU Equity -204.57% rf 0.0277
SKI AU Equity 1931.03% Sharpe
0.02283216
1
Total 100% Treynor Ratio
0.01987035
8
EFF 11
PF Weights
PF Stats using
Matrix
SGR AU Equity
-
19652.21
% Mean 0.11
MTS AU Equity -3727.77% Standard Deviation
3.48461868
6
WOR AU Equity -4188.31% Var
12.1425673
9
IFL AU Equity 1366.22% Beta
3.92126581
9
ANN AU Equity 2509.27%
DOW AU Equity 4171.20%
CAR AU Equity 6631.65%
DLX AU Equity 5277.44%
CHC AU Equity 5814.52%
VOC AU Equity -226.03% rf 0.0277
SKI AU Equity 2124.02% Sharpe
0.02361807
9
Total 100% Treynor Ratio
0.02098812
1
EFF 12
PF Weights
PF Stats using
Matrix
SGR AU Equity
-
21446.31
% Mean 0.12
MTS AU Equity -4068.76% Standard Deviation
3.80265169
6
WOR AU Equity -4571.32% Var
14.4601599
2
IFL AU Equity 1490.06% Beta
4.20394589
3
ANN AU Equity 2737.41%
DOW AU Equity 4551.00%
tabler-icon-diamond-filled.svg

Paraphrase This Document

Need a fresh take? Get an instant paraphrase of this document with our AI Paraphraser
Document Page
11INVESTMENT AND PORTFOLIO MANAGEMENT
CAR AU Equity 7235.96%
DLX AU Equity 5758.18%
CHC AU Equity 6344.27%
VOC AU Equity -247.48% rf 0.0277
SKI AU Equity 2317.01% Sharpe
0.02427253
6
Total 100% Treynor Ratio
0.02195556
3
EFF 13
PF Weights
PF Stats using
Matrix
SGR AU Equity
-
23240.41
% Mean 0.13
MTS AU Equity -4409.75% Standard Deviation
4.12068487
4
WOR AU Equity -4954.33% Var
16.9800438
3
IFL AU Equity 1613.90% Beta
4.48662596
7
ANN AU Equity 2965.55%
DOW AU Equity 4930.79%
CAR AU Equity 7840.27%
DLX AU Equity 6238.92%
CHC AU Equity 6874.01%
VOC AU Equity -268.93% rf 0.0277
SKI AU Equity 2509.99% Sharpe 0.02482597
Total 100% Treynor Ratio
0.02280109
8
EFF 14
PF Weights
PF Stats using
Matrix
SGR AU Equity
-
25034.51
% Mean 0.14
MTS AU Equity -4750.74% Standard Deviation
4.43871818
4
WOR AU Equity -5337.35% Var
19.7022191
2
IFL AU Equity 1737.74% Beta
4.76930604
1
ANN AU Equity 3193.69%
DOW AU Equity 5310.58%
CAR AU Equity 8444.57%
DLX AU Equity 6719.65%
CHC AU Equity 7403.76%
Document Page
12INVESTMENT AND PORTFOLIO MANAGEMENT
VOC AU Equity -290.39% rf 0.0277
SKI AU Equity 2702.98% Sharpe
0.02530009
7
Total 100% Treynor Ratio
0.02354640
3
EFF 15
PF Weights
PF Stats using
Matrix
SGR AU Equity
-
26828.61
% Mean 0.15
MTS AU Equity -5091.73% Standard Deviation 4.7567516
WOR AU Equity -5720.36% Var
22.6266857
8
IFL AU Equity 1861.58% Beta
5.05198611
5
ANN AU Equity 3421.83%
DOW AU Equity 5690.38%
CAR AU Equity 9048.88%
DLX AU Equity 7200.39%
CHC AU Equity 7933.51%
VOC AU Equity -311.84% rf 0.0277
SKI AU Equity 2895.97% Sharpe
0.02571082
3
Total 100% Treynor Ratio
0.02420830
1
EFF 16
PF Weights
PF Stats using
Matrix
SGR AU Equity
-
28622.71
% Mean 0.16
MTS AU Equity -5432.72% Standard Deviation
5.07478510
1
WOR AU Equity -6103.37% Var
25.7534438
2
IFL AU Equity 1985.42% Beta
5.33466618
9
ANN AU Equity 3649.97%
DOW AU Equity 6070.17%
CAR AU Equity 9653.19%
DLX AU Equity 7681.13%
CHC AU Equity 8463.25%
VOC AU Equity -333.30% rf 0.0277
SKI AU Equity 3088.96% Sharpe
0.02607006
9
Total 100% Treynor Ratio 0.02480005
chevron_up_icon
1 out of 18
circle_padding
hide_on_mobile
zoom_out_icon
[object Object]