Comprehensive Analysis of Portfolio Risk and Return Strategies

Verified

Added on  2020/05/08

|8
|1270
|59
Homework Assignment
AI Summary
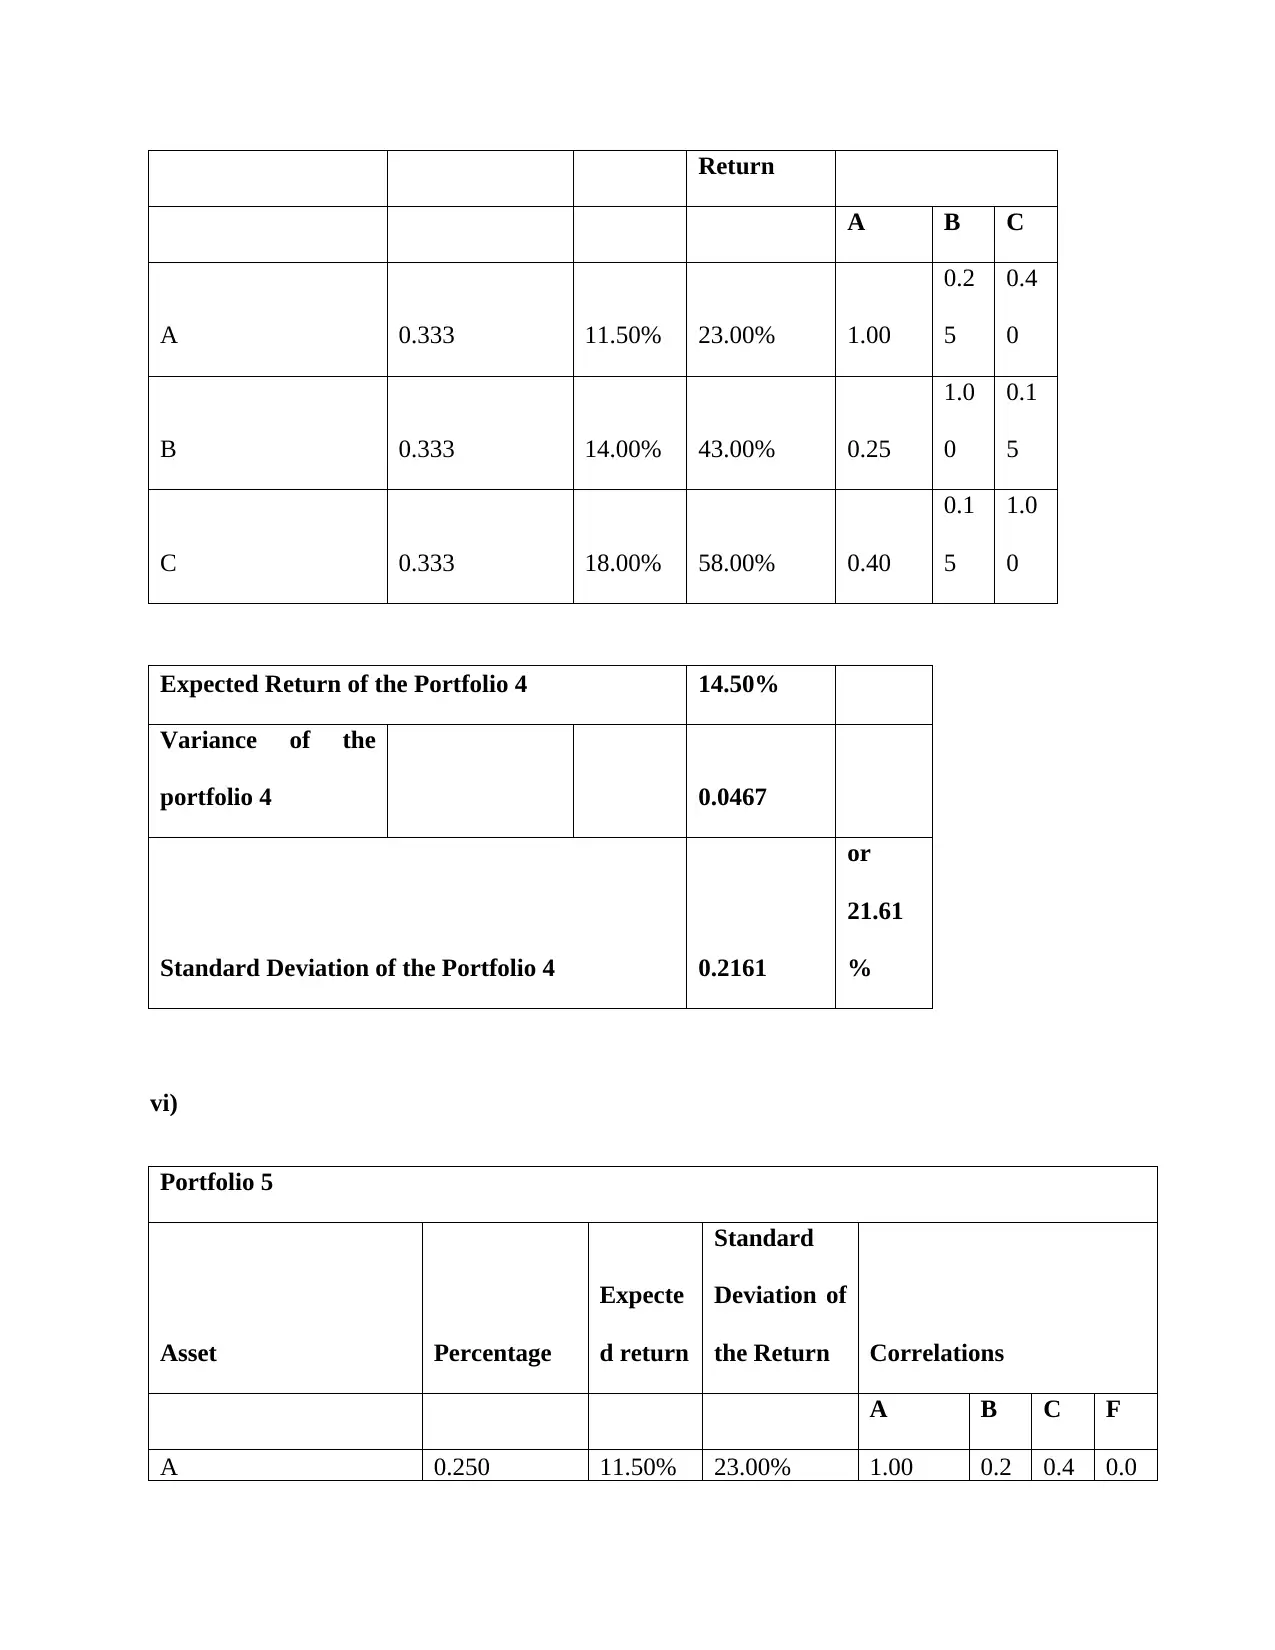
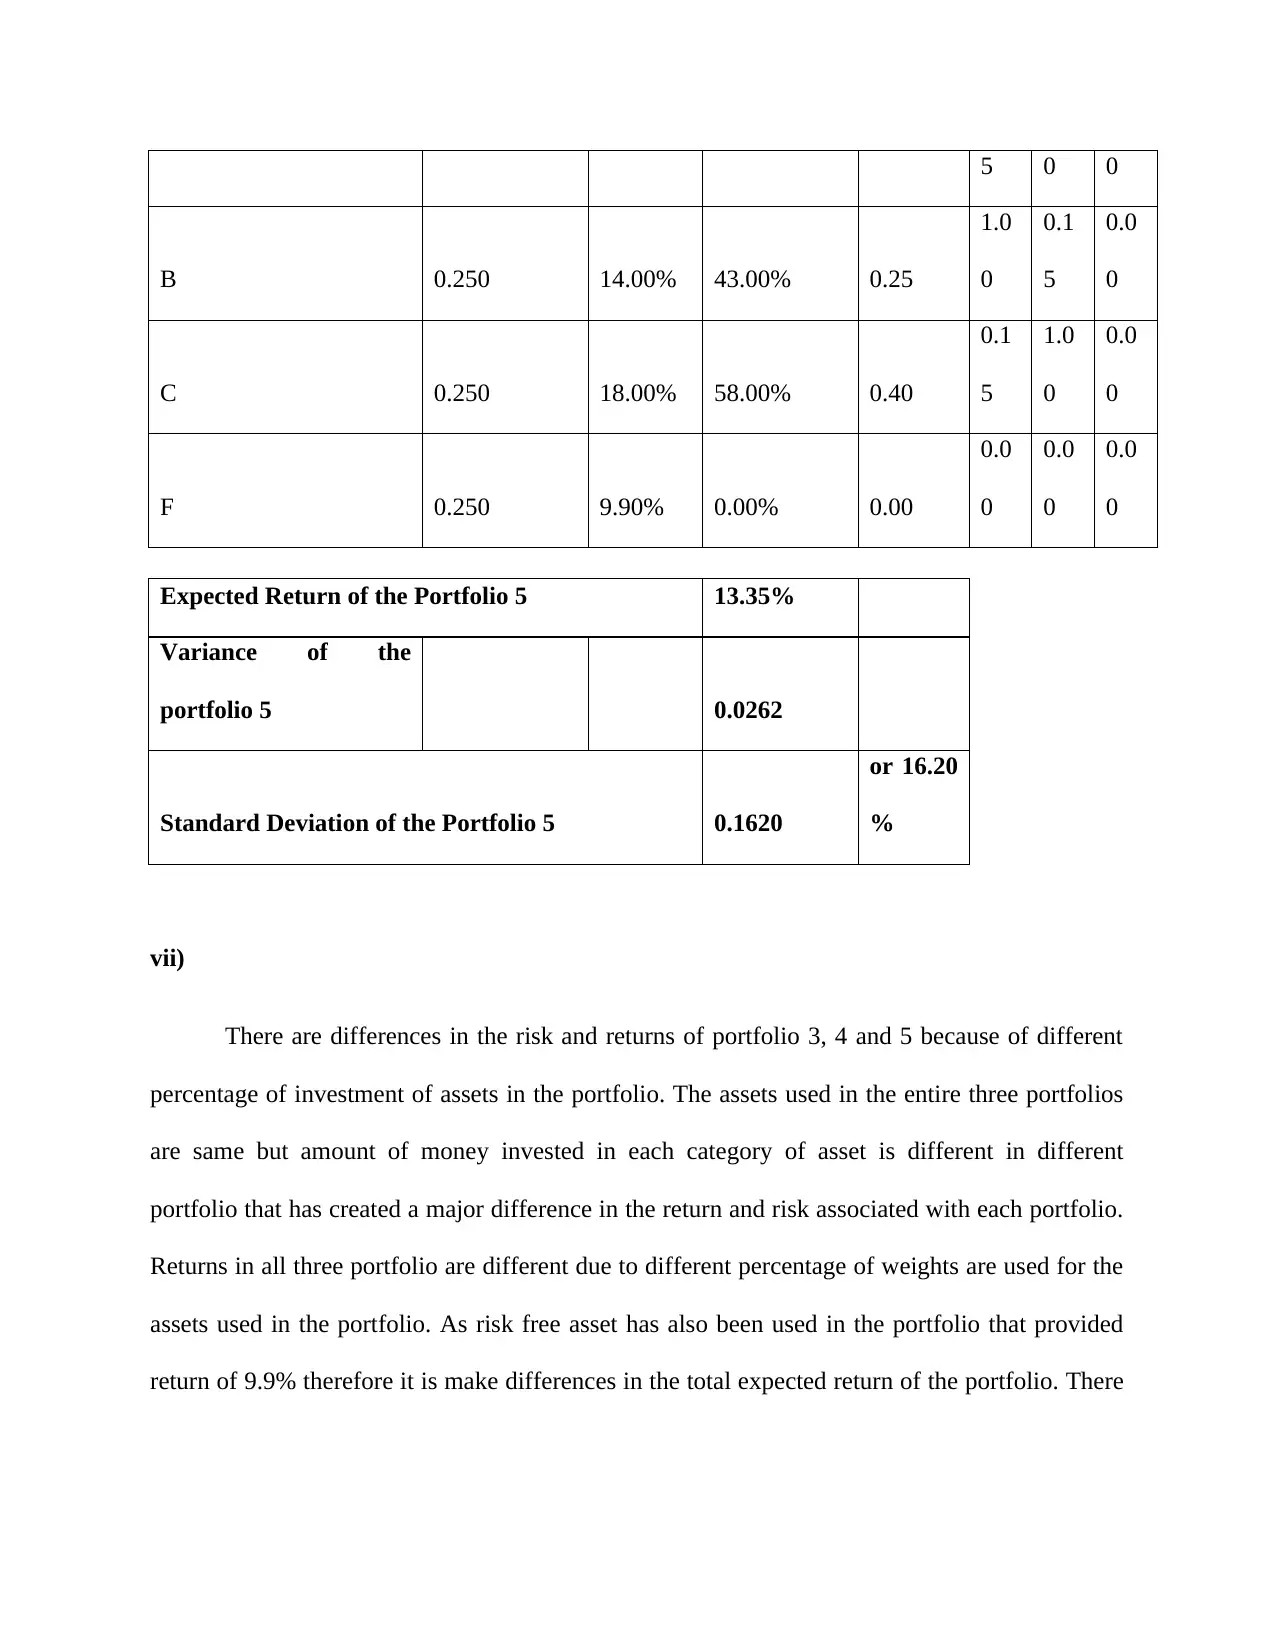
This assignment provides a comprehensive analysis of portfolio risk and return, covering key concepts such as standard deviation, correlation, and diversification. Part 1 explains the measurement of market volatility through standard deviation, the impact of beta on returns, and the role of correlation in portfolio risk. It also differentiates between systematic and unsystematic risk, and discusses the risk-free asset. Part 2 involves the calculation of expected returns, variance, and standard deviation for five different portfolios with varying asset allocations, including the use of a risk-free asset. The analysis highlights how different portfolio compositions affect overall risk and return profiles, emphasizing the importance of diversification and asset weighting in financial decision-making. The assignment references key financial accounting texts to support its analysis.
Document Page
Part 1:
i)
As we know the standard deviation measures the average value by which the individual
returns deviate from the average of return (Mean). In short it calculates the deviation of the
returns as per the probability of their occurrence that is termed as market volatility. For example,
if the returns of the stock changes frequently and has wide range there will be larger deviations
from the mean of return. So it will provide higher standard deviation means high risk. If in actual
buying of any stock has normal distribution of return that means 95% of returns fall under the 2
times change in standard deviation, than it can be said that there is more than 68%probability
that return are highly close (+/-) to the average return (Palepu, 2007).
ii)
Every share or stock has its own risk (Beta) and it impact the returns accordingly. If any
investor wants to buy two or more risky assets than he will have to consider the risk associated
with both the stocks to come with the risk of whole portfolio. Every stock has its own risk but
there exists some co-relation between the stocks in portfolio. Co-relation is defined as the
strength of relationship between two stocks. The risk of portfolio is the weight-age average of the
risks of two stocks in accordance with the correlation exists between them. For example, if 80%
money is invested in 5% risk stock and 20% in 30% risky stock and there is positive relation of 1
between them, than it can be said that risk of whole portfolio will be surely highly less than 30%
but slightly greater than 5% as more weight-age has been given to stock with 5% risk (Weil,
Schipper and Francis, 2013).
iii)
tabler-icon-diamond-filled.svg

Paraphrase This Document

Need a fresh take? Get an instant paraphrase of this document with our AI Paraphraser
Document Page
The risk and standard deviation of risk free asset is zero as there is no risk in such stocks.
In case the risk free asset are kept in any portfolio with other risky assets than the calculation of
risk of such portfolio will change. For example if there is two equally weighted stocks, one with
risk and other one with no risk than the risk of the whole portfolio will be square root of square
of weight of risky assets multiply by its risk. There was no addition of risks of other assets as
there is risk associated with it and its standard deviation is zero which is provide zero if added to
square of its weight. Coming to the last part of risk calculation, i.e. correlation part, I must tell
you there is no need to calculate such part as co-relation if risk and risk free assets is not defined
or zero and there is multiplication of standard deviation which is also zero hence the answer will
zero (Weil, Schipper and Francis, 2013).
iv)
Systematic risk refers to the risks that arise due to market conditions like wars, interest
rate etc. Whereas unsystematic risk refers to risk that is associated within the security i.e. risk in
the company or the particular industry. Unsystematic risk can be reduce through diversification
of investment whereas systematic risks can be reduced through taking prompt action while such
risk take place for example taking the use of hedge (Weygandt, Kieso and Kimmel, 2010).
Document Page
Part 2: Calculation Part
Answer 1:
i )
Portfolio 1
Asset Percentage
Expecte
d return
Standard
Deviation
of the
Return Correlations
A B
A 0.40 11.50% 23.00% 1
0.2
5
B 0.60 14.00% 43.00% 0.25 1
Expected Return of the Portfolio 1 13.00%
Variance of the
portfolio 1 0.0869
Standard Deviation of the Portfolio 1 0.2948
or
29.48
%
ii)
Portfolio 2
Document Page
Asset Percentage
Expecte
d return
Standard
Deviation of
the Return Correlations
A B C
A 0.600 11.50% 23.00% 1.00
0.2
5
0.4
0
B 0.225 14.00% 43.00% 0.25
1.0
0
0.1
5
C 0.175 18.00% 58.00% 0.40
0.1
5
1.0
0
Expected Return of the Portfolio 2 13.20%
Variance of the portfolio 2
0.0426
Standard Deviation of the Portfolio 2 0.2064
or
20.64
%
iii)
There is difference between risk and return of portfolio 1 and portfolio 2 because in
portfolio 1 there is 2 assets whereas portfolio 2 has three assets and different weights has been
assigned to the assets while making the portfolio 1 and 2 (Stickney, 2009).
tabler-icon-diamond-filled.svg

Paraphrase This Document

Need a fresh take? Get an instant paraphrase of this document with our AI Paraphraser
Document Page
iv)
Portfolio 3
Asset Percentage
Expecte
d return
Standard
Deviation of
the Return Correlations
A B F
A 0.048 11.50% 23.00% 1.00 0.25 0.00
B 0.750 14.00% 43.00% 0.25 1.00 0.00
F 0.202 9.90% 0.00% 0.00 0.00 0.00
Expected Return of the Portfolio 3 13.05%
Variance of the
portfolio 3 0.1059
Standard Deviation of the Portfolio 3 0.3254
or
32.54
%
(Stickney, 2009).
v)
Portfolio 4
Asset Percentage Expecte
d return
Standard
Deviation
of the
Correlations
Document Page
Return
A B C
A 0.333 11.50% 23.00% 1.00
0.2
5
0.4
0
B 0.333 14.00% 43.00% 0.25
1.0
0
0.1
5
C 0.333 18.00% 58.00% 0.40
0.1
5
1.0
0
Expected Return of the Portfolio 4 14.50%
Variance of the
portfolio 4 0.0467
Standard Deviation of the Portfolio 4 0.2161
or
21.61
%
vi)
Portfolio 5
Asset Percentage
Expecte
d return
Standard
Deviation of
the Return Correlations
A B C F
A 0.250 11.50% 23.00% 1.00 0.2 0.4 0.0
Document Page
5 0 0
B 0.250 14.00% 43.00% 0.25
1.0
0
0.1
5
0.0
0
C 0.250 18.00% 58.00% 0.40
0.1
5
1.0
0
0.0
0
F 0.250 9.90% 0.00% 0.00
0.0
0
0.0
0
0.0
0
Expected Return of the Portfolio 5 13.35%
Variance of the
portfolio 5 0.0262
Standard Deviation of the Portfolio 5 0.1620
or 16.20
%
vii)
There are differences in the risk and returns of portfolio 3, 4 and 5 because of different
percentage of investment of assets in the portfolio. The assets used in the entire three portfolios
are same but amount of money invested in each category of asset is different in different
portfolio that has created a major difference in the return and risk associated with each portfolio.
Returns in all three portfolio are different due to different percentage of weights are used for the
assets used in the portfolio. As risk free asset has also been used in the portfolio that provided
return of 9.9% therefore it is make differences in the total expected return of the portfolio. There
tabler-icon-diamond-filled.svg

Paraphrase This Document

Need a fresh take? Get an instant paraphrase of this document with our AI Paraphraser
Document Page
is no risk in the risk free assets so if no weights are changed but the returns of the assets got
changed than risk will be same (Stickney, 2009).
chevron_up_icon
1 out of 8
circle_padding
hide_on_mobile
zoom_out_icon
[object Object]