Portfolio Assessment Report: ASX and Japan Securities Exchange

Verified

Added on  2023/01/09

|21
|1759
|62
Report
AI Summary
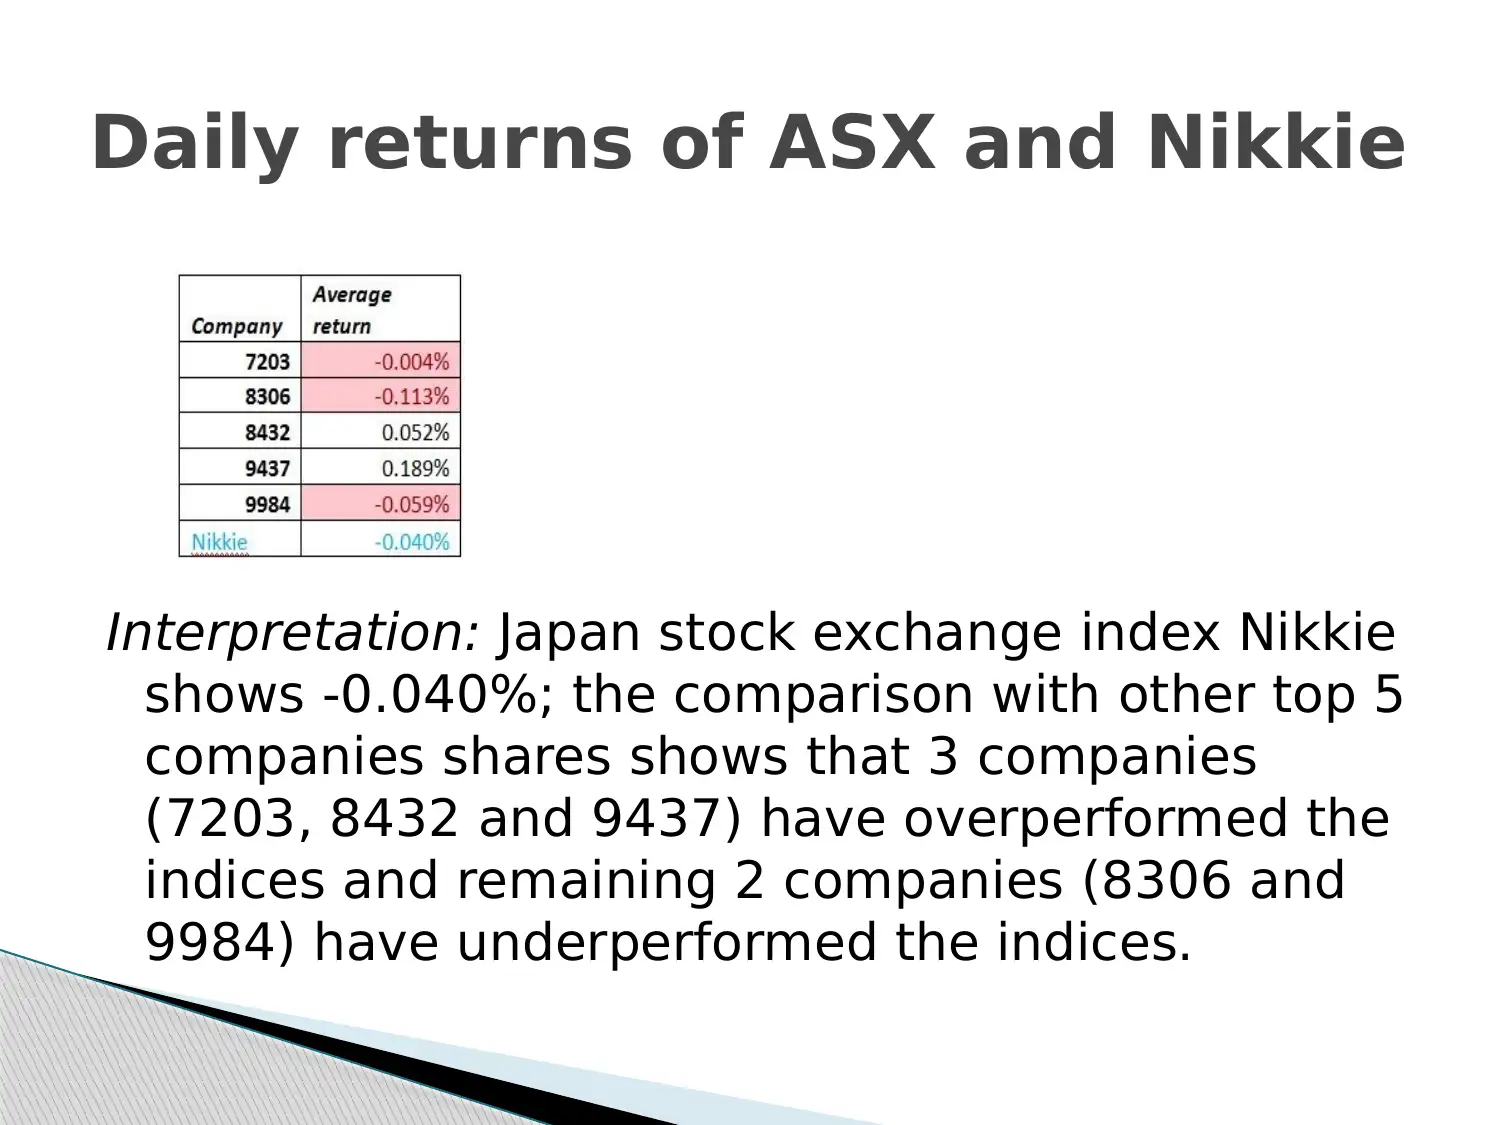
This report presents a portfolio assessment comparing the Australian Securities Exchange (ASX) and the Japan Securities Exchange (Nikkei), recommending suitable portfolio options for risk-averse investors. It analyzes market indices, identifying underperforming and overperforming shares, and explains the reasons behind these trends. The report delves into portfolio beta calculations, mean return, and standard deviation to assess risk and volatility. Recommendations are provided based on the investor's risk profile, favoring the ASX due to its more secure returns. Additionally, the report examines the impact of COVID-19 on bond markets in both Australia and Japan, providing a comprehensive overview of the financial landscape.
Document Page
Managing finance
tabler-icon-diamond-filled.svg

Paraphrase This Document

Need a fresh take? Get an instant paraphrase of this document with our AI Paraphraser
Document Page
Introduction
Task 1
Task 2
Task 3
Task 4
References
Content
Document Page
This presentation report is based on portfolio
assessment of two different securities
Australian securities exchange (ASX) and
Japan securities exchange (Nikkie). These
exchanges has been diversified into two
different portfolios which are Australia and
Japan. The scenario consists of
recommending suitable portfolio options to
risk averse investors.
Introduction
Document Page
Shares market index
A stock exchange index, or stock exchange
index, is a chart that measures the exchange
of securities, or a subset of the stock
exchange, which helps speculators with
different levels of normal value and past
costs to measure performance. It is processed
by the selected stock costs (mathematically
coherent meaning by weight).
Continue…
Task 1
tabler-icon-diamond-filled.svg

Paraphrase This Document

Need a fresh take? Get an instant paraphrase of this document with our AI Paraphraser
Document Page
Free-float adjusted Market-Capitalization Weighting shows
the optimal loads from each component’s applications,
especially for intentional or deliberate applications not
commonly found on the open market. Governments,
subsidiaries, entrants and employees may withhold these
offers. Boundaries of foreign property imposed by
government directives may be subject to movement
changes. These changes educate financial experts about
potential liquidity problems from these funds that are not
clear from the sheer number of staggering stock offers.
Free skimming conversions are soft-minded endeavors,
and several file providers have specialized editing
techniques, which can yield a number of results here and
there.
Document Page
Underperform and over performed shares
Underperform shares: If an investment doesn't work, it
doesn't keep up with the various guarantees. In a
growing industrial sector, for example, stocks do not
meet expectations unless they experience increases
equivalent to or more specific to the development of
the ASX 200 index. A stock that falls faster than the
market is larger than a sub- producer. There is also "If
expectations are not met" an analyst's
recommendation is given to equities when bids are
expected to be slightly worse than market
performance. The ad is called an "average sale" or
"visible catch".
Task 2
Document Page
Overperform shares: In the financial media,
Overperform is typically used as an
assessment provided by analysts who review
and recommend safeguards. If they change
their rating of a particular stock to
“Outperform” from “Market Performance” or
even “If you don’t meet expectations”
something has changed in their test that will
make them assume that the stock will
produce more important result , for a long
time to come, the important market files
tabler-icon-diamond-filled.svg

Paraphrase This Document

Need a fresh take? Get an instant paraphrase of this document with our AI Paraphraser
Document Page
Interpretation: Australian stock exchange index shows
average return of -0.0145%; by comparing this to other
top 5 companies shares, it was found that BHP, CBA, CSL
and RIOP overperformed while WBC under performed by -
0.171% during the period (31st August, 2019 to 31st
March, 2020).
Daily returns of ASX and Nikkie
Document Page
Interpretation: Japan stock exchange index Nikkie
shows -0.040%; the comparison with other top 5
companies shares shows that 3 companies
(7203, 8432 and 9437) have overperformed the
indices and remaining 2 companies (8306 and
9984) have underperformed the indices.
Daily returns of ASX and Nikkie
Document Page
This is due to the fact that the example of
earnings in stock trading is severely reduced,
which means that a relatively small number of
high yield stocks tend to be mostly, or all, of the
arrival of the market.
The good performance of an equity return occurs,
while the maximum amount a security can lose is
100%, the expected positive returns for a security
are well above 100%. The same thing happens
with numbers, reducing irregular returns, even if
distributed evenly, causing a slow circulation of
profits over time.
Reason for shares underperformed
or over performed the index
tabler-icon-diamond-filled.svg

Paraphrase This Document

Need a fresh take? Get an instant paraphrase of this document with our AI Paraphraser
Document Page
A portfolio is a collection of monetary resources, such as
equities, securities, commodities, cash standards and
liquidity, just like store partners, including shared goods,
closed trading and exchange. A package may also include
non-free trade protections, such as land, work and private
enterprise. Cash accounts use this concept to function
properly.
The packages are managed directly by speculators and
distributed by money experts and money leaders. Financial
experts should create a business package based on the
strength of risk and associated objectives. Likewise,
financial experts may have different responsibilities for
different purposes. It all depends on a person's goals as a
financial expert.
Task 2
Document Page
The beta of a portfolio is the total weight of the
individual resource betas, based on the level of
interests in the portfolio. For example, if half of the
available money A with a beta of 2.00 and half of
the available money B with a beta of 1.00, the
beta package is 1.50. The beta pack represents
the instability of two protection packs, taken as a
whole, as assessed by the individual stocks of the
protections that caused it to rise. A beta of 1.05
compared to the ASX 200 suggests that if the ASX
pre-funded yield increases by 10%, the package is
expected to increase by 10.5%.
Beta of portfolio
chevron_up_icon
1 out of 21
circle_padding
hide_on_mobile
zoom_out_icon
[object Object]