University Finance: Portfolio Optimization, Risk, and Return Analysis

Verified

Added on  2022/09/10

|4
|634
|18
Homework Assignment
AI Summary
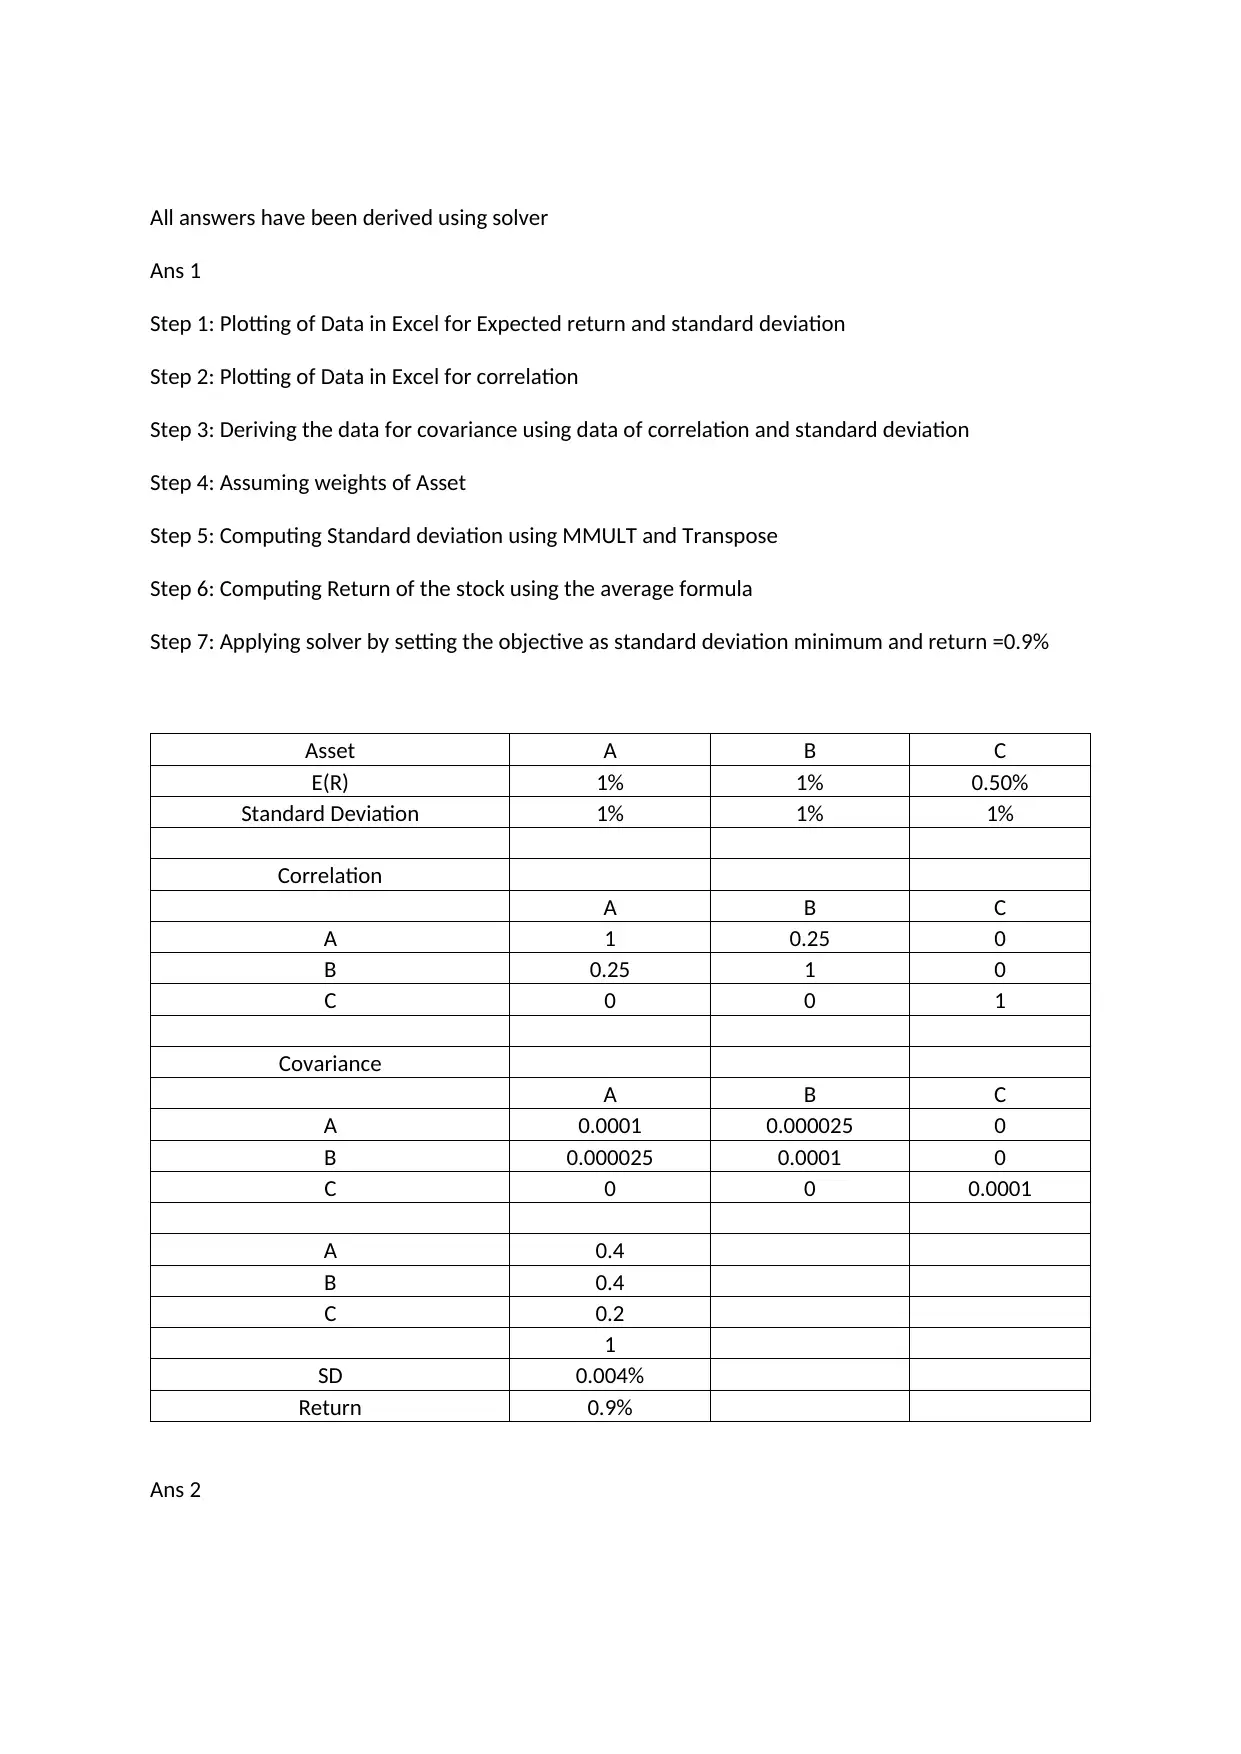
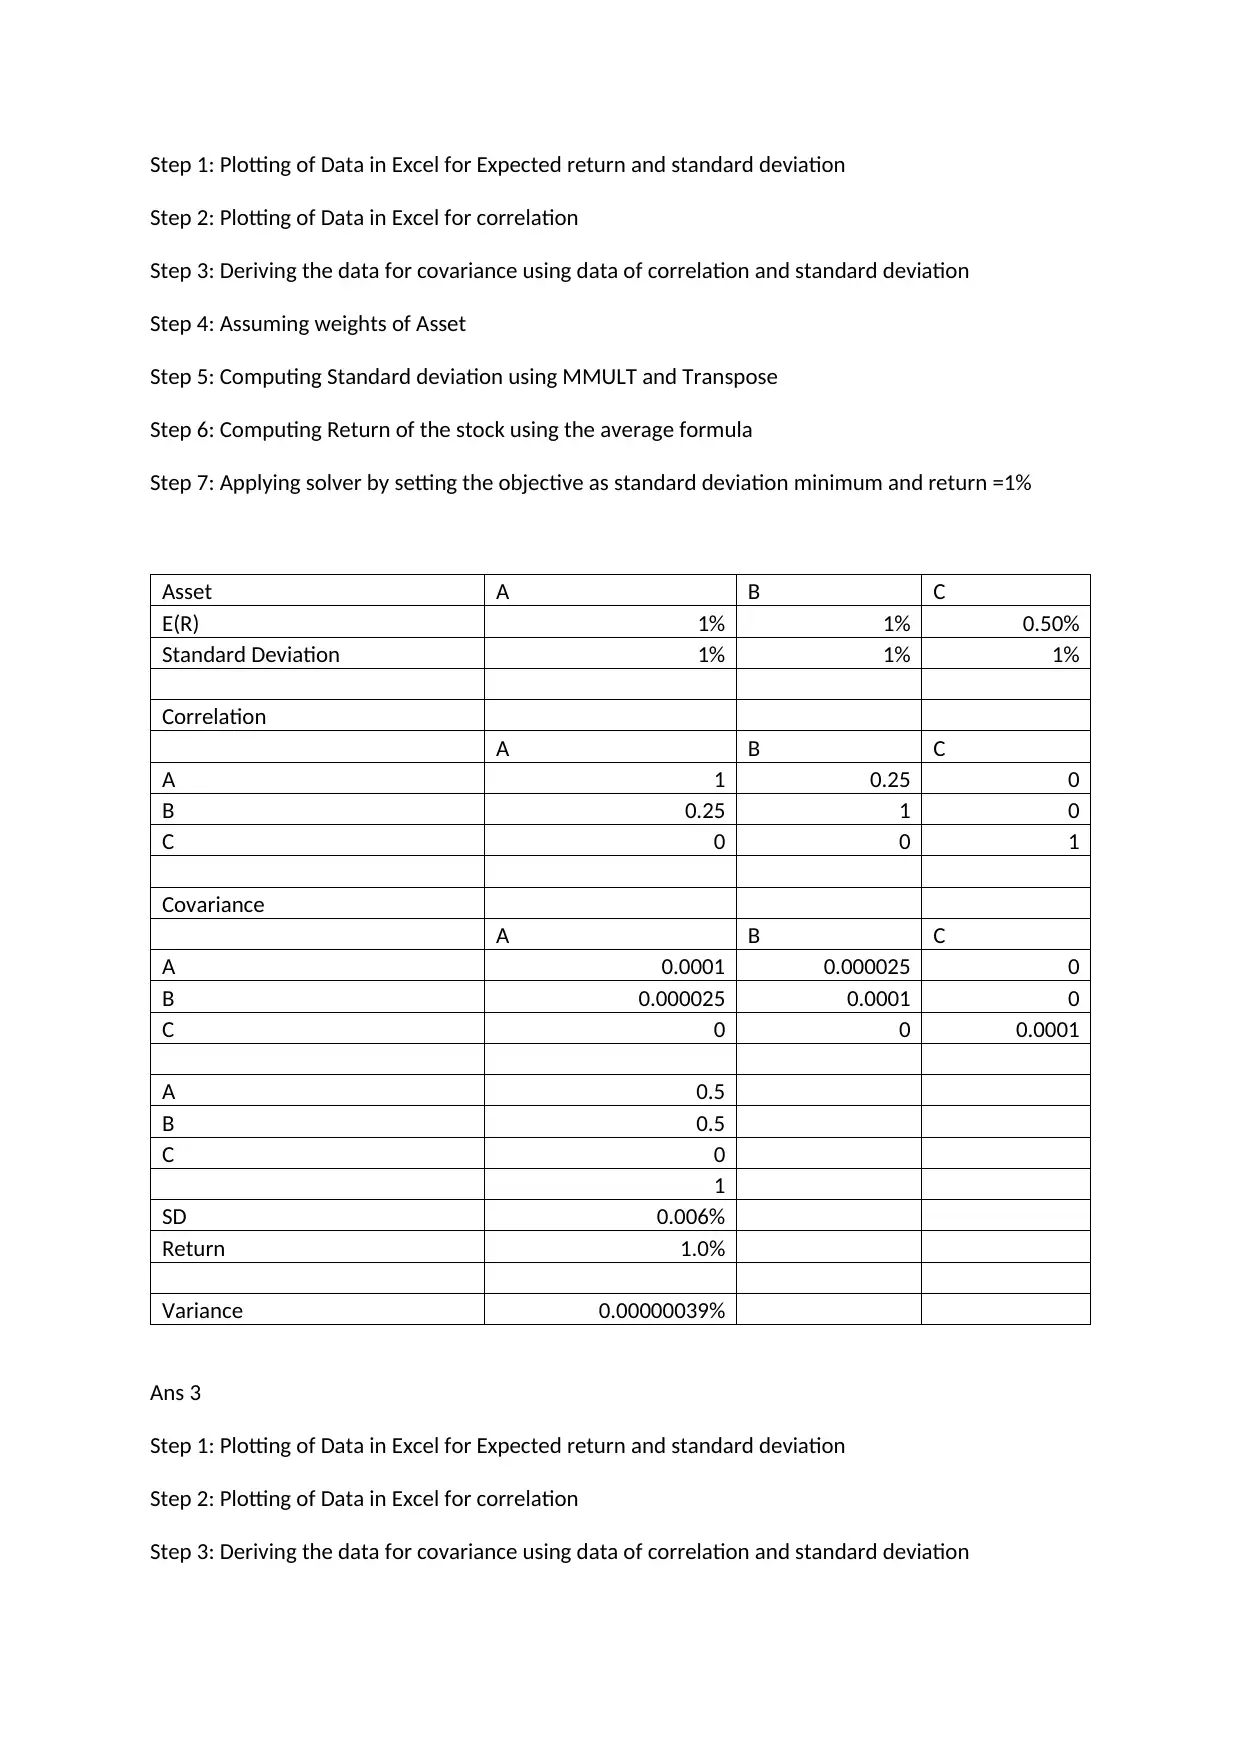
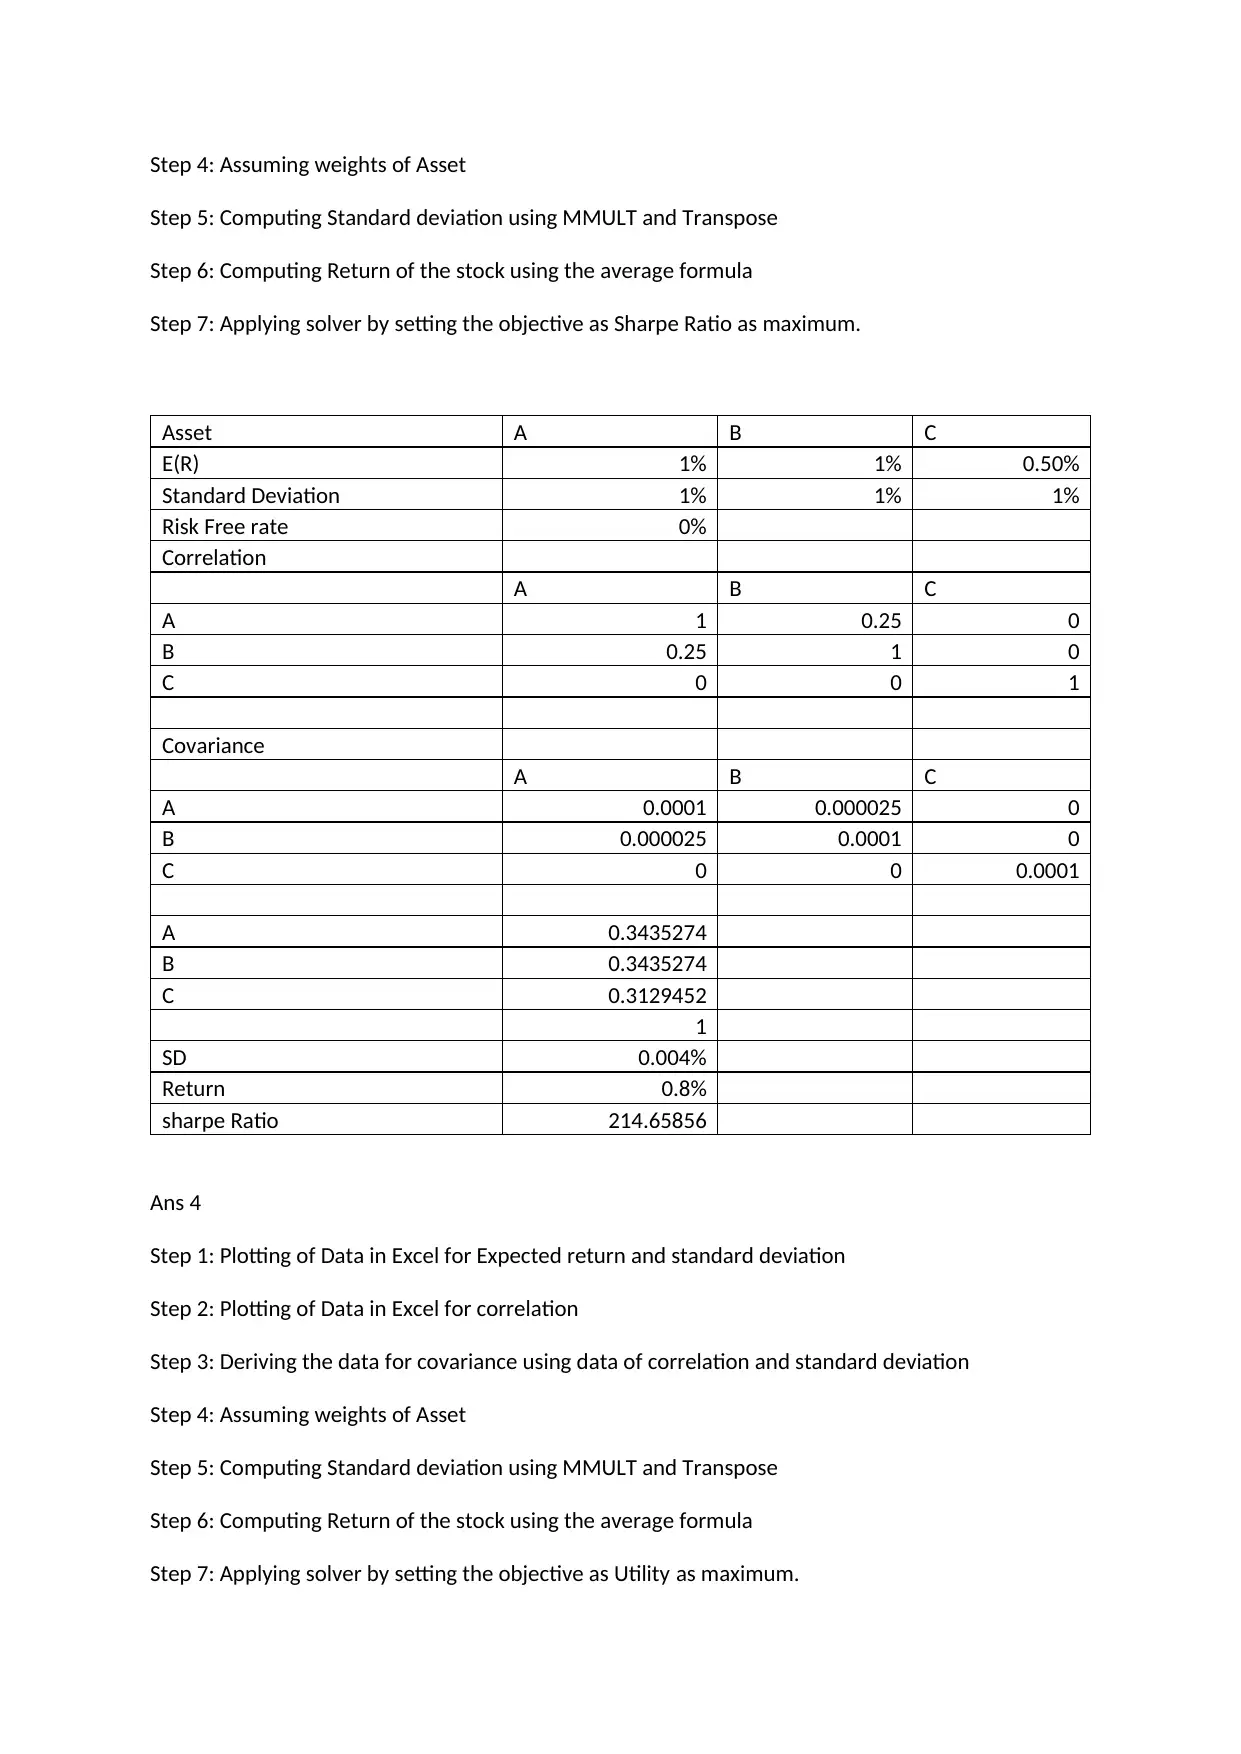
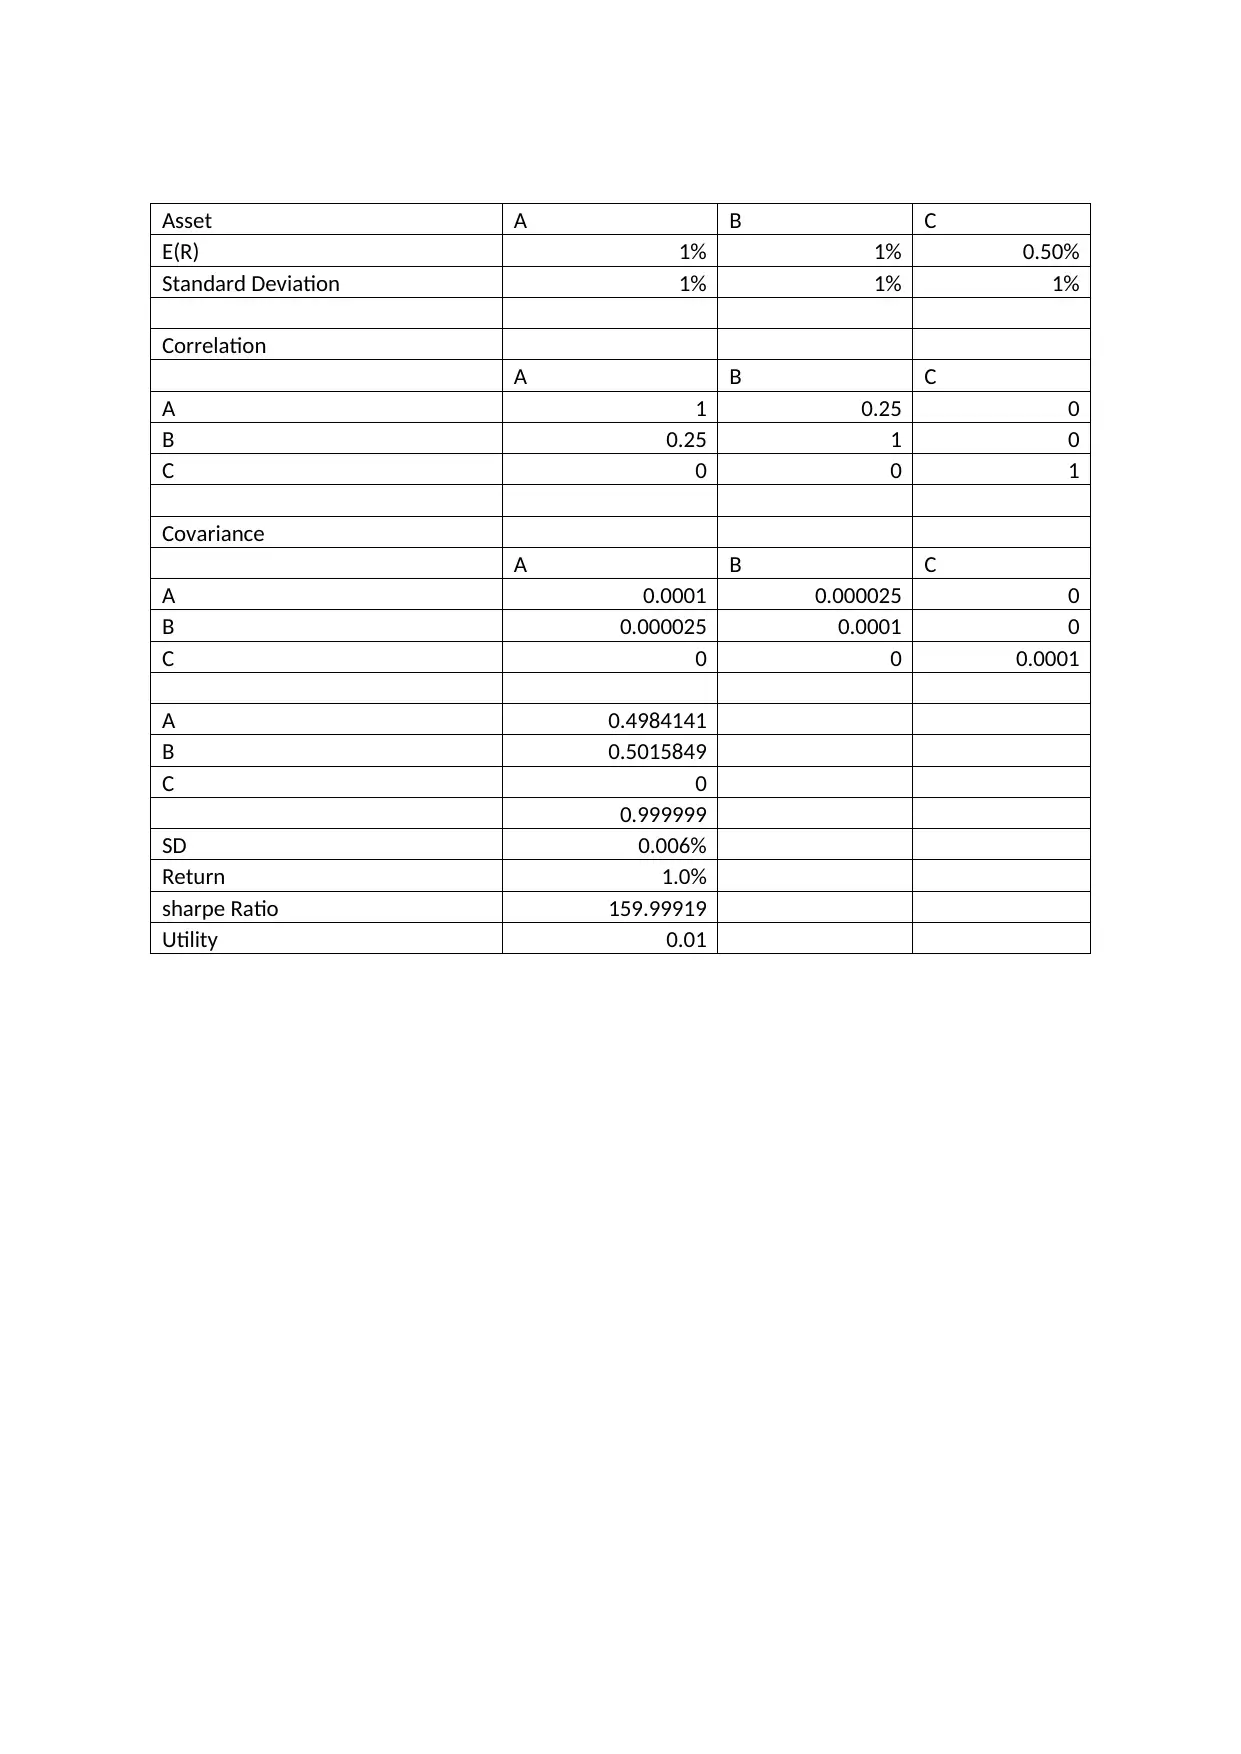
This homework assignment focuses on portfolio optimization using Excel, analyzing the risk and return of different assets. The solution demonstrates the process of plotting data, calculating covariance, and applying the Excel Solver to determine optimal asset weights. The assignment covers three scenarios: minimizing standard deviation for a target return, maximizing the Sharpe ratio, and maximizing utility. Each scenario involves detailed steps, including the use of correlation matrices, covariance calculations, and the application of the MMULT and TRANSPOSE functions in Excel. The results include the optimized weights for each asset, the resulting standard deviation, return, Sharpe ratio, and utility, providing a practical guide to portfolio construction and risk management. The assignment also highlights the importance of understanding these concepts in making informed investment decisions.
Document Page
All answers have been derived using solver
Ans 1
Step 1: Plotting of Data in Excel for Expected return and standard deviation
Step 2: Plotting of Data in Excel for correlation
Step 3: Deriving the data for covariance using data of correlation and standard deviation
Step 4: Assuming weights of Asset
Step 5: Computing Standard deviation using MMULT and Transpose
Step 6: Computing Return of the stock using the average formula
Step 7: Applying solver by setting the objective as standard deviation minimum and return =0.9%
Asset A B C
E(R) 1% 1% 0.50%
Standard Deviation 1% 1% 1%
Correlation
A B C
A 1 0.25 0
B 0.25 1 0
C 0 0 1
Covariance
A B C
A 0.0001 0.000025 0
B 0.000025 0.0001 0
C 0 0 0.0001
A 0.4
B 0.4
C 0.2
1
SD 0.004%
Return 0.9%
Ans 2
tabler-icon-diamond-filled.svg

Secure Best Marks with AI Grader

Need help grading? Try our AI Grader for instant feedback on your assignments.
Document Page
Step 1: Plotting of Data in Excel for Expected return and standard deviation
Step 2: Plotting of Data in Excel for correlation
Step 3: Deriving the data for covariance using data of correlation and standard deviation
Step 4: Assuming weights of Asset
Step 5: Computing Standard deviation using MMULT and Transpose
Step 6: Computing Return of the stock using the average formula
Step 7: Applying solver by setting the objective as standard deviation minimum and return =1%
Asset A B C
E(R) 1% 1% 0.50%
Standard Deviation 1% 1% 1%
Correlation
A B C
A 1 0.25 0
B 0.25 1 0
C 0 0 1
Covariance
A B C
A 0.0001 0.000025 0
B 0.000025 0.0001 0
C 0 0 0.0001
A 0.5
B 0.5
C 0
1
SD 0.006%
Return 1.0%
Variance 0.00000039%
Ans 3
Step 1: Plotting of Data in Excel for Expected return and standard deviation
Step 2: Plotting of Data in Excel for correlation
Step 3: Deriving the data for covariance using data of correlation and standard deviation
Document Page
Step 4: Assuming weights of Asset
Step 5: Computing Standard deviation using MMULT and Transpose
Step 6: Computing Return of the stock using the average formula
Step 7: Applying solver by setting the objective as Sharpe Ratio as maximum.
Asset A B C
E(R) 1% 1% 0.50%
Standard Deviation 1% 1% 1%
Risk Free rate 0%
Correlation
A B C
A 1 0.25 0
B 0.25 1 0
C 0 0 1
Covariance
A B C
A 0.0001 0.000025 0
B 0.000025 0.0001 0
C 0 0 0.0001
A 0.3435274
B 0.3435274
C 0.3129452
1
SD 0.004%
Return 0.8%
sharpe Ratio 214.65856
Ans 4
Step 1: Plotting of Data in Excel for Expected return and standard deviation
Step 2: Plotting of Data in Excel for correlation
Step 3: Deriving the data for covariance using data of correlation and standard deviation
Step 4: Assuming weights of Asset
Step 5: Computing Standard deviation using MMULT and Transpose
Step 6: Computing Return of the stock using the average formula
Step 7: Applying solver by setting the objective as Utility as maximum.
Document Page
Asset A B C
E(R) 1% 1% 0.50%
Standard Deviation 1% 1% 1%
Correlation
A B C
A 1 0.25 0
B 0.25 1 0
C 0 0 1
Covariance
A B C
A 0.0001 0.000025 0
B 0.000025 0.0001 0
C 0 0 0.0001
A 0.4984141
B 0.5015849
C 0
0.999999
SD 0.006%
Return 1.0%
sharpe Ratio 159.99919
Utility 0.01
chevron_up_icon
1 out of 4
circle_padding
hide_on_mobile
zoom_out_icon
[object Object]