Portfolio Management Project: Investment Opportunity Set Analysis
VerifiedAdded on 2022/08/26
|14
|3291
|25
Project
AI Summary
This portfolio management project analyzes investment strategies based on modern portfolio theory. It examines historical stock data of two companies, calculating returns, volatility, and correlation to construct an investment opportunity set. The project explores portfolio construction, the importance of diversification, and the concepts of optimal risky and minimum variance portfolios. The analysis includes the capital allocation line and a comparison between the two portfolios. The project uses real-world data to demonstrate how to build and manage investment portfolios effectively, considering risk-return profiles and diversification benefits. The project provides a detailed analysis of portfolio construction, risk management, and return optimization, offering practical insights for students in finance.
Running head: PORTFOLIO MANAGEMENT
Portfolio Management
Name of the Student:
Name of the University:
Author Note:
Portfolio Management
Name of the Student:
Name of the University:
Author Note:
Paraphrase This Document
Need a fresh take? Get an instant paraphrase of this document with our AI Paraphraser
1PORTFOLIO MANAGEMENT
Table of Contents
Introduction:...............................................................................................................................2
Discussion:.................................................................................................................................2
Portfolio Construction:...........................................................................................................2
Importance of Diversification:...............................................................................................3
Stock Return and the Correlation:..........................................................................................5
Portfolio Opportunity Set:......................................................................................................6
Optimal Risky Portfolio, Capital Allocation Line and minimum variance portfolio:...........7
Comparison between the Two Portfolios:..............................................................................9
Conclusion:..............................................................................................................................10
References:...............................................................................................................................11
2PORTFOLIO MANAGEMENT
Introduction:
Modern portfolio theory highlights the concept of optimal risky portfolio and the
minimum variance portfolio in the investment universe. The investment universe highlights
the use of various asset classes for the purpose of investment of an investor’s portfolio. An
investor can be having different risk preference and return preference according to which a
portfolio manager makes investment decisions. The asset classes can be characterized as
bonds, equity, alternative investment and many other types of hybrid securities which is
included by the portfolio manager as per the risk return profile of the investor (Johannes
2018).
The report presented below aims to highlight the various theoretical concepts of the
modern portfolio theory. This report provides the efficient frontier or the investment
opportunity set of the securities selected for the portfolio. It also highlights the optimal risky
portfolio and the minimum variance portfolio of the securities. Also it tends to provide an
insight of the benefits of diversification which can be achieved by the mix of the securities in
the portfolio.
Discussion and Analysis
Historical Data
The historical data has been well collected for a sum of five year whereby relevant
changes in the stock price on a monthly basis has been considered. The monthly closing price
for each of the stock from the time period January 2015 to December 2019 has been well
considered for analysis purpose. The two stocks which have been selected for the portfolio
have provided the following return which would be used in the calculation of the portfolio
return. The historical stock price movements of the stocks have been taken for a period of 5
⊘ This is a preview!⊘
Do you want full access?
Subscribe today to unlock all pages.
Trusted by 1+ million students worldwide
3PORTFOLIO MANAGEMENT
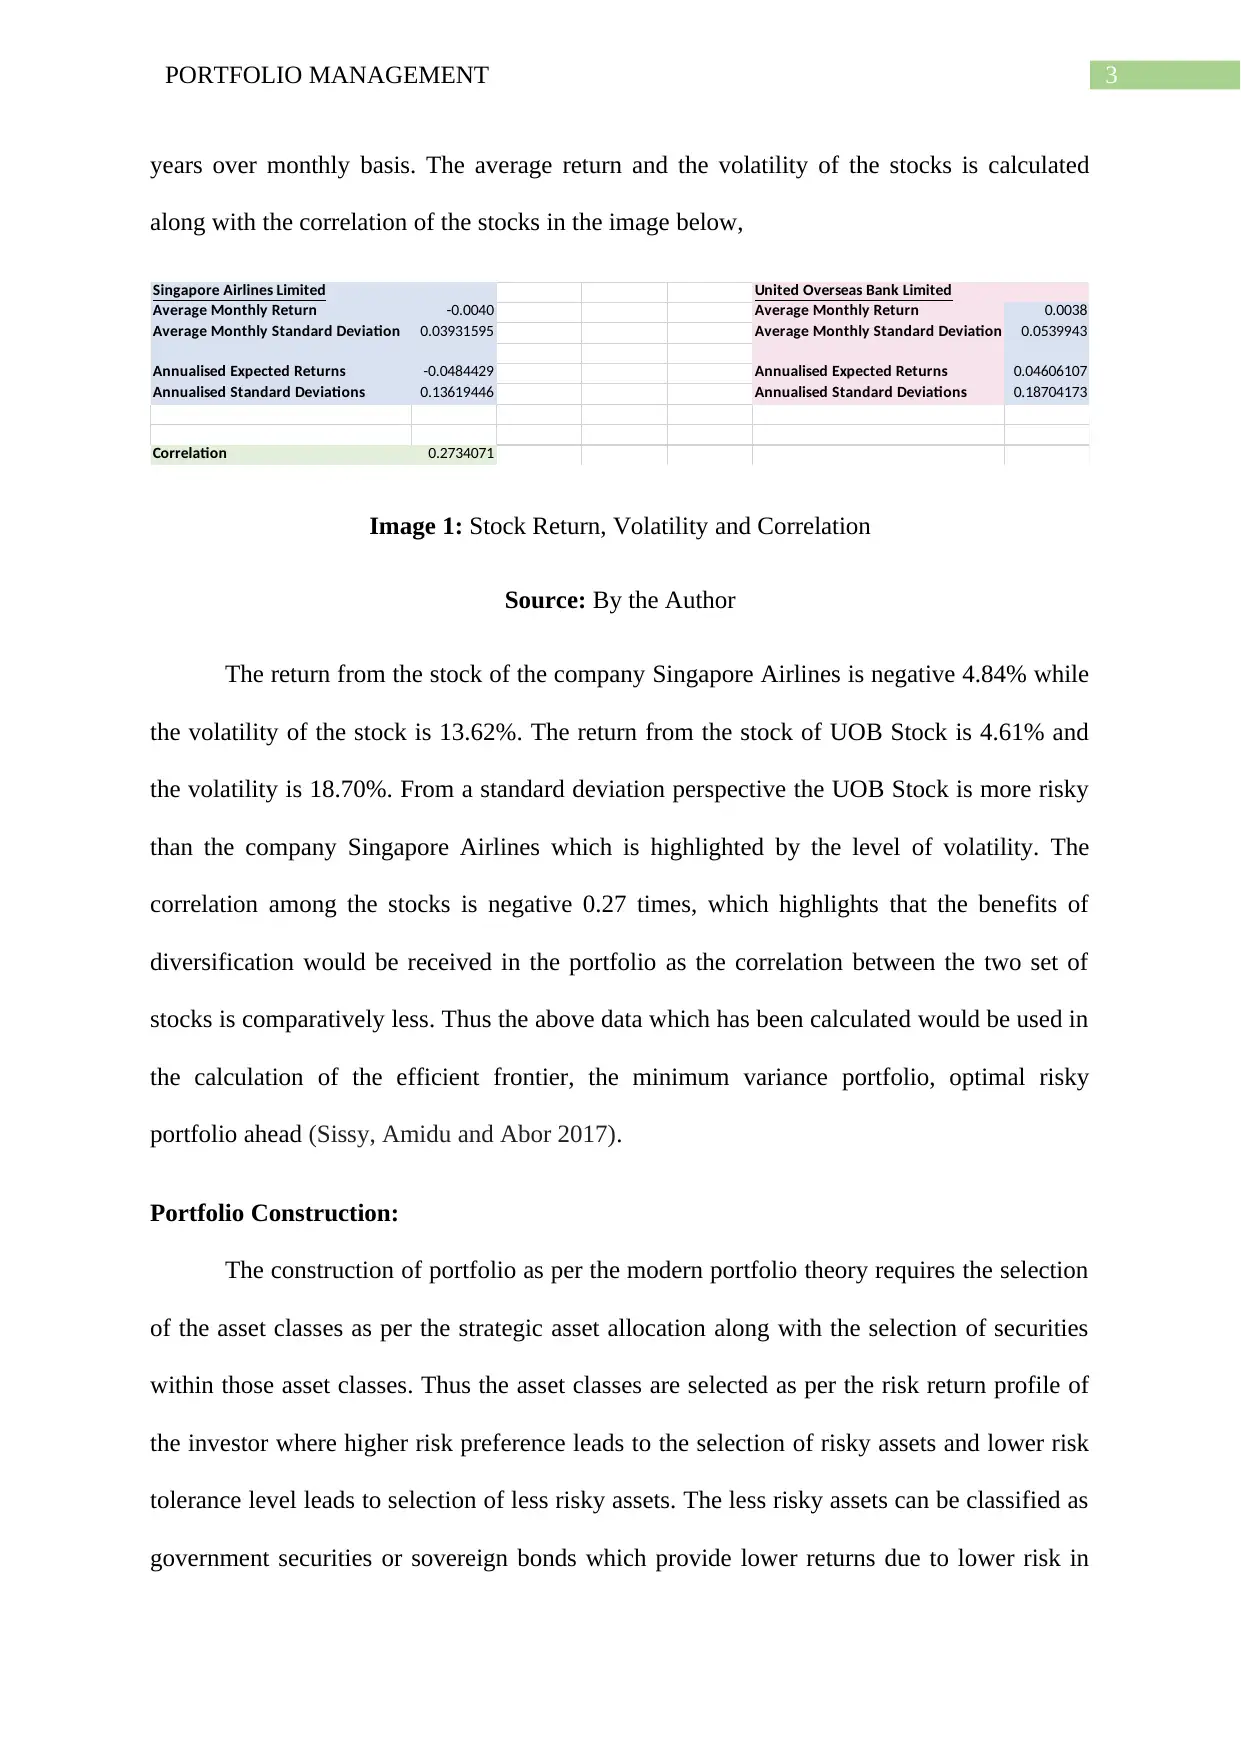
years over monthly basis. The average return and the volatility of the stocks is calculated
along with the correlation of the stocks in the image below,
Singapore Airlines Limited United Overseas Bank Limited
Average Monthly Return -0.0040 Average Monthly Return 0.0038
Average Monthly Standard Deviation 0.03931595 Average Monthly Standard Deviation 0.0539943
Annualised Expected Returns -0.0484429 Annualised Expected Returns 0.04606107
Annualised Standard Deviations 0.13619446 Annualised Standard Deviations 0.18704173
Correlation 0.2734071
Image 1: Stock Return, Volatility and Correlation
Source: By the Author
The return from the stock of the company Singapore Airlines is negative 4.84% while
the volatility of the stock is 13.62%. The return from the stock of UOB Stock is 4.61% and
the volatility is 18.70%. From a standard deviation perspective the UOB Stock is more risky
than the company Singapore Airlines which is highlighted by the level of volatility. The
correlation among the stocks is negative 0.27 times, which highlights that the benefits of
diversification would be received in the portfolio as the correlation between the two set of
stocks is comparatively less. Thus the above data which has been calculated would be used in
the calculation of the efficient frontier, the minimum variance portfolio, optimal risky
portfolio ahead (Sissy, Amidu and Abor 2017).
Portfolio Construction:
The construction of portfolio as per the modern portfolio theory requires the selection
of the asset classes as per the strategic asset allocation along with the selection of securities
within those asset classes. Thus the asset classes are selected as per the risk return profile of
the investor where higher risk preference leads to the selection of risky assets and lower risk
tolerance level leads to selection of less risky assets. The less risky assets can be classified as
government securities or sovereign bonds which provide lower returns due to lower risk in
Paraphrase This Document
Need a fresh take? Get an instant paraphrase of this document with our AI Paraphraser
4PORTFOLIO MANAGEMENT
these assets. Risky assets can be like equity asset class or private equities, hedge funds which
are more risky assets (Lee, Trzcinka and Venkatesan 2019).
The two stocks which are selected are the company Singapore Airlines and the other
company which is selected for the portfolio is United Overseas Bank Ltd (Kopmann, Kock,
Killen and Gemünden 2017). Thus the details of the two companies is provided below,
Singapore Airlines Limited: The airlines company is the flagship carrier airline of the
Singapore with its major hub in the Singapore Changi Airport. The airline is well
notable for well using the Singapore Girl as its central figure for corporate branding.
The company is listed in the Singapore Index with its stock symbol as SGD and the
stock price of the company is currently trading at SGD6.50. The Company represents
the aviation industry of Singapore and provides travel and hospitality services to
individuals. The airlines operate it flights domestically as well as internationally to
almost all the popular destinations around the globe (Singapore Airlines 2020).
United Overseas Bank: United Overseas Bank Ltd is a major Singaporean
Multinational Bank, which is having most of its branches in the Southeast Asian
Countries. The bank was founded in the year 1935 by the United Chinese Bank and its
provides a range of commercial and various corporate banking services along with
personal banking and asset management services (UOB 2020).
Investment Opportunity Set:
The portfolio opportunity set is a line of specific return and risk which is provided
from the portfolio. It tends to provide the highest level of return for a specific level of risk.
The specific level of risk is calculated by the different level of weights provided to the stocks
in the portfolio. This provides a range of return for a specific level of risk which is
highlighted in the graph below:

5PORTFOLIO MANAGEMENT
Investment Opportunity Set
W1 W2 Sp Erp
100
% 0.00%
0.13619
446
-
0.04844
29
95
% 5.00%
0.13224
797
-
0.04371
77
90
%
10.00
%
0.12895
015
-
0.03899
25
85
%
15.00
%
0.12635
18
-
0.03426
73
80
%
20.00
%
0.12449
671
-
0.02954
21
75
%
25.00
%
0.12341
842
-
0.02481
69
70
%
30.00
%
0.12313
733
-
0.02009
17
65
%
35.00
%
0.12365
887
-
0.01536
65
60
%
40.00
%
0.12497
299
-
0.01064
13
55
%
45.00
%
0.12705
512
-
0.00591
61
50
%
50.00
%
0.12986
831
-
0.00119
09
45
%
55.00
%
0.13336
63
0.00353
429
40
%
60.00
%
0.13749
685
0.00825
949
35
%
65.00
%
0.14220
485
0.01298
468
30
%
70.00
%
0.14743
497
0.01770
988
25
%
75.00
%
0.15313
375
0.02243
508
⊘ This is a preview!⊘
Do you want full access?
Subscribe today to unlock all pages.
Trusted by 1+ million students worldwide
6PORTFOLIO MANAGEMENT
20
%
80.00
%
0.15925
086
0.02716
028
15
%
85.00
%
0.16574
001
0.03188
547
10
%
90.00
%
0.17255
921
0.03661
067
5%
95.00
%
0.17967
091
0.04133
587
0%
100.0
0%
0.18704
173
0.04606
107
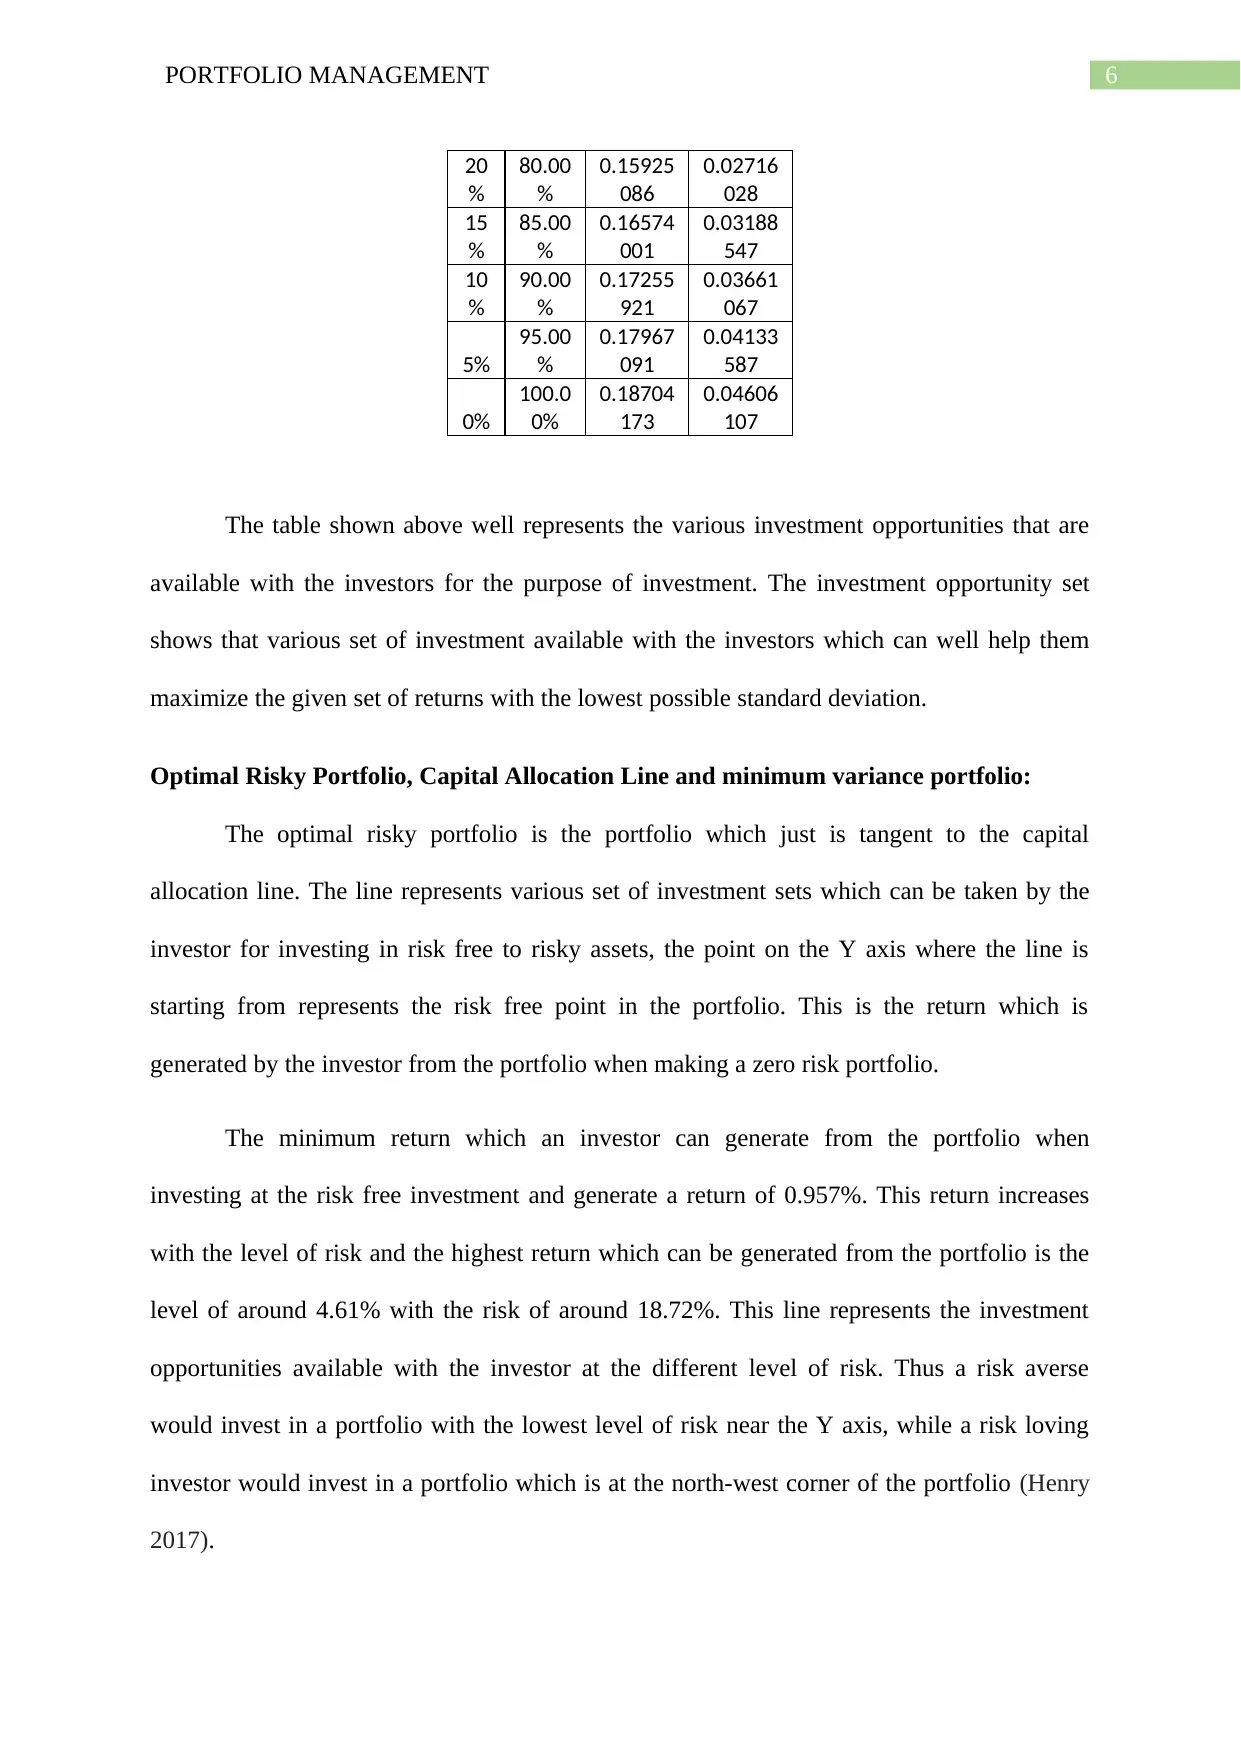
The table shown above well represents the various investment opportunities that are
available with the investors for the purpose of investment. The investment opportunity set
shows that various set of investment available with the investors which can well help them
maximize the given set of returns with the lowest possible standard deviation.
Optimal Risky Portfolio, Capital Allocation Line and minimum variance portfolio:
The optimal risky portfolio is the portfolio which just is tangent to the capital
allocation line. The line represents various set of investment sets which can be taken by the
investor for investing in risk free to risky assets, the point on the Y axis where the line is
starting from represents the risk free point in the portfolio. This is the return which is
generated by the investor from the portfolio when making a zero risk portfolio.
The minimum return which an investor can generate from the portfolio when
investing at the risk free investment and generate a return of 0.957%. This return increases
with the level of risk and the highest return which can be generated from the portfolio is the
level of around 4.61% with the risk of around 18.72%. This line represents the investment
opportunities available with the investor at the different level of risk. Thus a risk averse
would invest in a portfolio with the lowest level of risk near the Y axis, while a risk loving
investor would invest in a portfolio which is at the north-west corner of the portfolio (Henry
2017).
20
%
80.00
%
0.15925
086
0.02716
028
15
%
85.00
%
0.16574
001
0.03188
547
10
%
90.00
%
0.17255
921
0.03661
067
5%
95.00
%
0.17967
091
0.04133
587
0%
100.0
0%
0.18704
173
0.04606
107
The table shown above well represents the various investment opportunities that are
available with the investors for the purpose of investment. The investment opportunity set
shows that various set of investment available with the investors which can well help them
maximize the given set of returns with the lowest possible standard deviation.
Optimal Risky Portfolio, Capital Allocation Line and minimum variance portfolio:
The optimal risky portfolio is the portfolio which just is tangent to the capital
allocation line. The line represents various set of investment sets which can be taken by the
investor for investing in risk free to risky assets, the point on the Y axis where the line is
starting from represents the risk free point in the portfolio. This is the return which is
generated by the investor from the portfolio when making a zero risk portfolio.
The minimum return which an investor can generate from the portfolio when
investing at the risk free investment and generate a return of 0.957%. This return increases
with the level of risk and the highest return which can be generated from the portfolio is the
level of around 4.61% with the risk of around 18.72%. This line represents the investment
opportunities available with the investor at the different level of risk. Thus a risk averse
would invest in a portfolio with the lowest level of risk near the Y axis, while a risk loving
investor would invest in a portfolio which is at the north-west corner of the portfolio (Henry
2017).
Paraphrase This Document
Need a fresh take? Get an instant paraphrase of this document with our AI Paraphraser
7PORTFOLIO MANAGEMENT
0 0.02 0.04 0.06 0.08 0.1 0.12 0.14 0.16 0.18 0.2
-0.06
-0.04
-0.02
0
0.02
0.04
0.06
Effi cient Frontier
Erp Risk Free
Optimal Risky Minimum Variance Portfolio
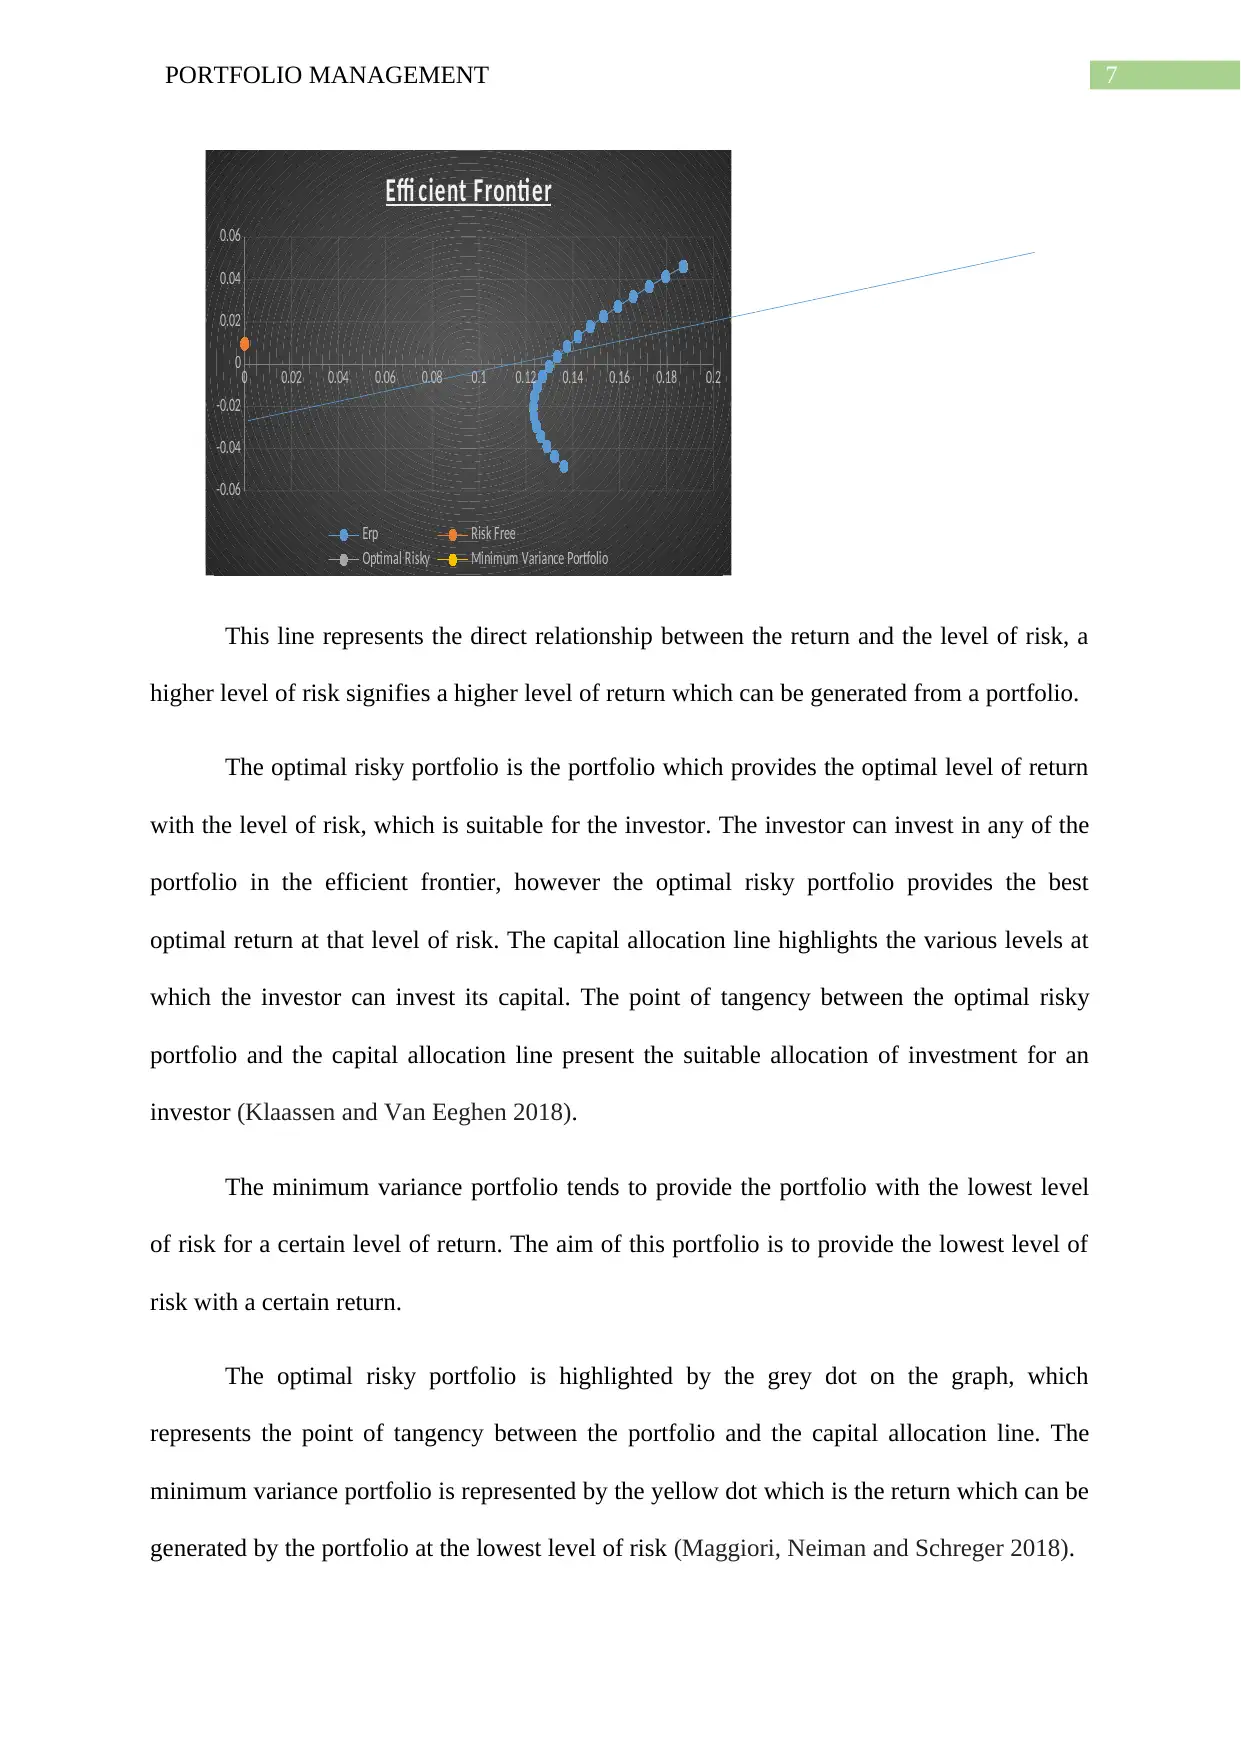
This line represents the direct relationship between the return and the level of risk, a
higher level of risk signifies a higher level of return which can be generated from a portfolio.
The optimal risky portfolio is the portfolio which provides the optimal level of return
with the level of risk, which is suitable for the investor. The investor can invest in any of the
portfolio in the efficient frontier, however the optimal risky portfolio provides the best
optimal return at that level of risk. The capital allocation line highlights the various levels at
which the investor can invest its capital. The point of tangency between the optimal risky
portfolio and the capital allocation line present the suitable allocation of investment for an
investor (Klaassen and Van Eeghen 2018).
The minimum variance portfolio tends to provide the portfolio with the lowest level
of risk for a certain level of return. The aim of this portfolio is to provide the lowest level of
risk with a certain return.
The optimal risky portfolio is highlighted by the grey dot on the graph, which
represents the point of tangency between the portfolio and the capital allocation line. The
minimum variance portfolio is represented by the yellow dot which is the return which can be
generated by the portfolio at the lowest level of risk (Maggiori, Neiman and Schreger 2018).
0 0.02 0.04 0.06 0.08 0.1 0.12 0.14 0.16 0.18 0.2
-0.06
-0.04
-0.02
0
0.02
0.04
0.06
Effi cient Frontier
Erp Risk Free
Optimal Risky Minimum Variance Portfolio
This line represents the direct relationship between the return and the level of risk, a
higher level of risk signifies a higher level of return which can be generated from a portfolio.
The optimal risky portfolio is the portfolio which provides the optimal level of return
with the level of risk, which is suitable for the investor. The investor can invest in any of the
portfolio in the efficient frontier, however the optimal risky portfolio provides the best
optimal return at that level of risk. The capital allocation line highlights the various levels at
which the investor can invest its capital. The point of tangency between the optimal risky
portfolio and the capital allocation line present the suitable allocation of investment for an
investor (Klaassen and Van Eeghen 2018).
The minimum variance portfolio tends to provide the portfolio with the lowest level
of risk for a certain level of return. The aim of this portfolio is to provide the lowest level of
risk with a certain return.
The optimal risky portfolio is highlighted by the grey dot on the graph, which
represents the point of tangency between the portfolio and the capital allocation line. The
minimum variance portfolio is represented by the yellow dot which is the return which can be
generated by the portfolio at the lowest level of risk (Maggiori, Neiman and Schreger 2018).
8PORTFOLIO MANAGEMENT
Minimum Variance Portfolio
Minimum variance portfolio shows the maximum return that an investors can well get
with the help of lowest possible set of risks. The optimal risky portfolio is the suitable
portfolio for the investor as per his risk return profile and should be used for the investment
purpose. However, with the change of the risk return preference of the investor the optimal
risky portfolio changes as the capital allocation line changes for the investor. The minimum
variance portfolio highlights the level of risk and seeks to provide the investor with a
portfolio which has the lowest level of risk and is suitable for a risk hating investor who does
not wish to take excessive risk (Larrain and Stumpner 2017). The return generated by the
minimum variance portfolio has been around -2.08% and the level of risk at the same time for
the portfolio has been around 12.31%.
The optimal portfolio seeks to provide the highest reward in terms of risk undertaken
by the investor and is a suitable investment for a rational investor. The minimum variance
portfolio seeks to lower the risk for the investor without considering the return factor from
the investment. As this is highlighted in the graph above the minimum variance portfolio
provides a negative return while reducing the risk from the portfolio (Christensen, Irle and
Ludwig 2017).
Diversification in Portfolio
The diversification is an important aspect of portfolio management which seeks to
reduce the risk of the investor while maximizing the return at that level of risk. Thus, the
level of diversification which can be received by investments in the portfolio depend on the
correlation among the securities. Thus the lower the correlation the higher the diversification
from the portfolio, while higher the correlation the lesser the diversification from the
portfolio (Grinold 2018).
⊘ This is a preview!⊘
Do you want full access?
Subscribe today to unlock all pages.
Trusted by 1+ million students worldwide
9PORTFOLIO MANAGEMENT
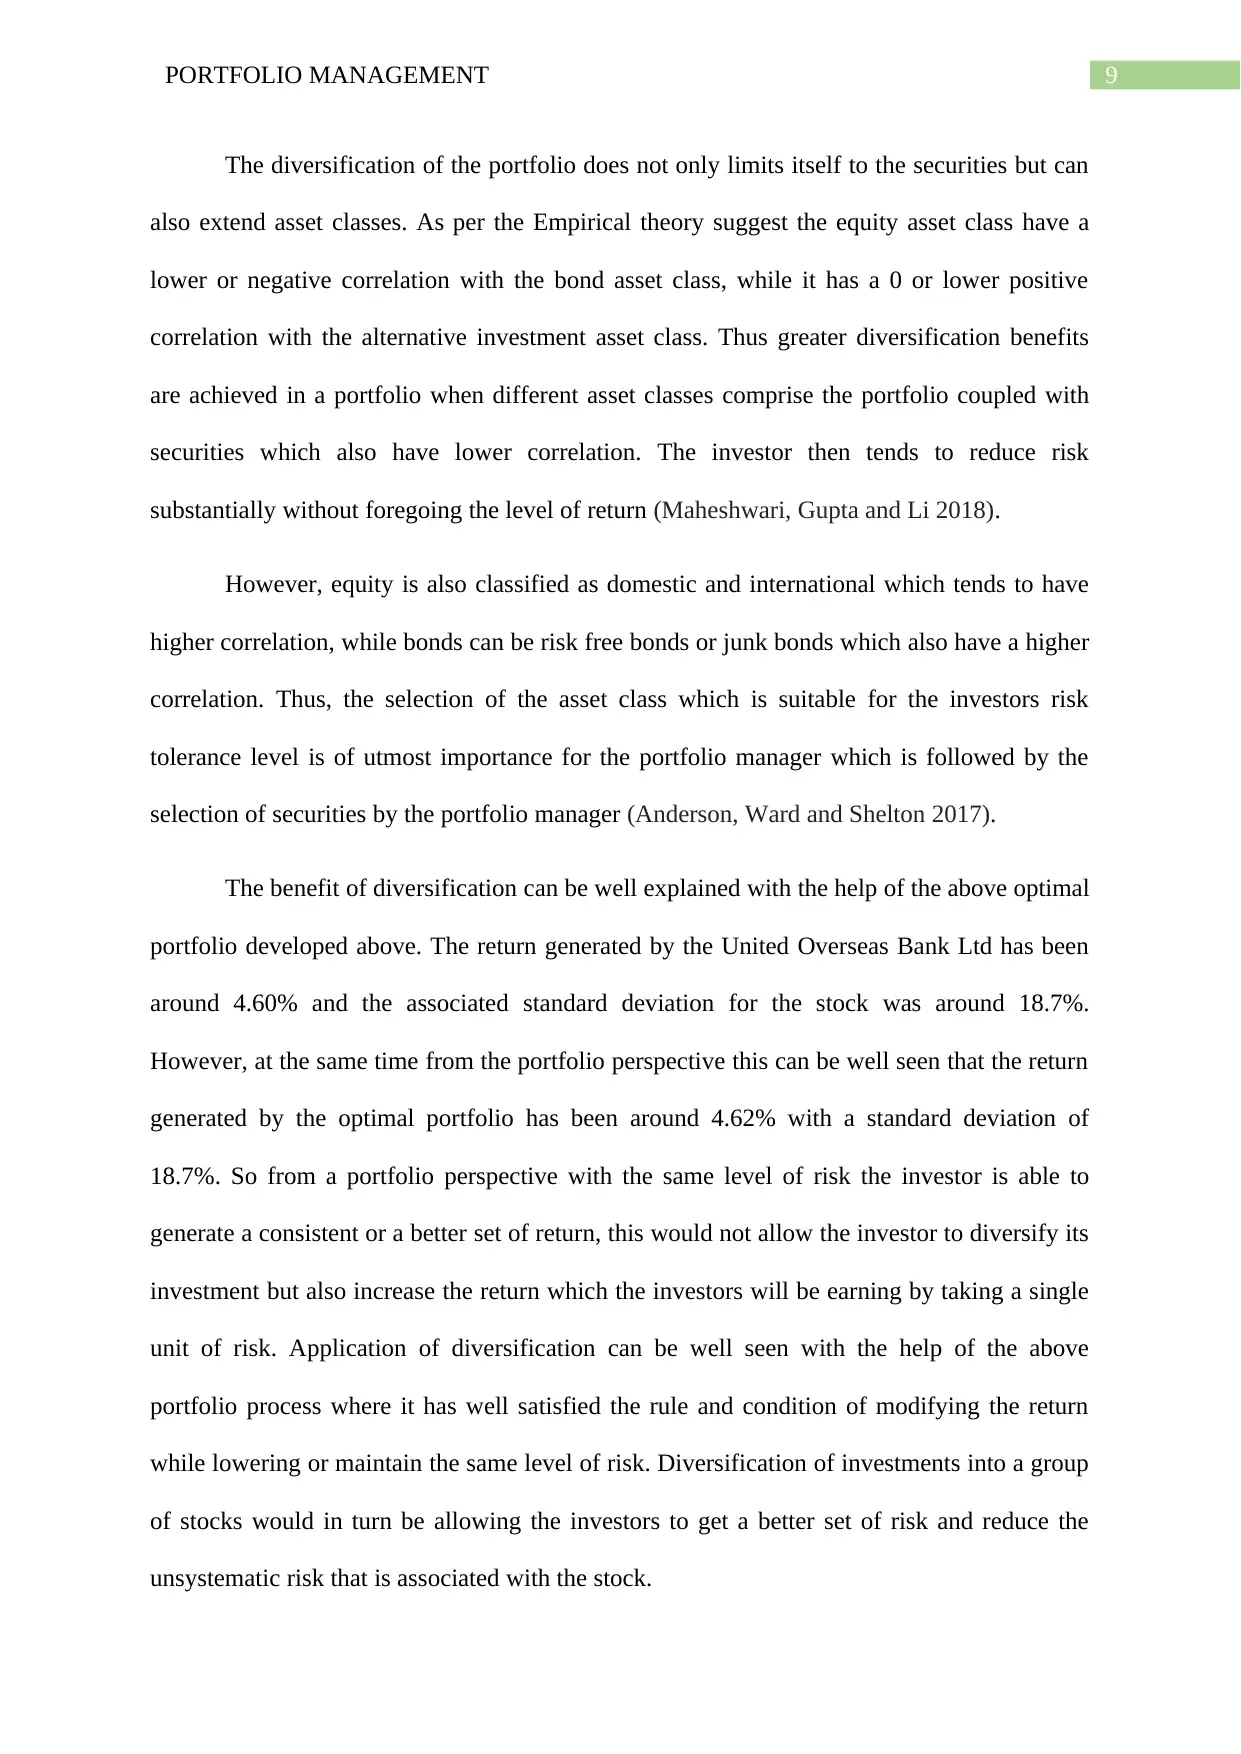
The diversification of the portfolio does not only limits itself to the securities but can
also extend asset classes. As per the Empirical theory suggest the equity asset class have a
lower or negative correlation with the bond asset class, while it has a 0 or lower positive
correlation with the alternative investment asset class. Thus greater diversification benefits
are achieved in a portfolio when different asset classes comprise the portfolio coupled with
securities which also have lower correlation. The investor then tends to reduce risk
substantially without foregoing the level of return (Maheshwari, Gupta and Li 2018).
However, equity is also classified as domestic and international which tends to have
higher correlation, while bonds can be risk free bonds or junk bonds which also have a higher
correlation. Thus, the selection of the asset class which is suitable for the investors risk
tolerance level is of utmost importance for the portfolio manager which is followed by the
selection of securities by the portfolio manager (Anderson, Ward and Shelton 2017).
The benefit of diversification can be well explained with the help of the above optimal
portfolio developed above. The return generated by the United Overseas Bank Ltd has been
around 4.60% and the associated standard deviation for the stock was around 18.7%.
However, at the same time from the portfolio perspective this can be well seen that the return
generated by the optimal portfolio has been around 4.62% with a standard deviation of
18.7%. So from a portfolio perspective with the same level of risk the investor is able to
generate a consistent or a better set of return, this would not allow the investor to diversify its
investment but also increase the return which the investors will be earning by taking a single
unit of risk. Application of diversification can be well seen with the help of the above
portfolio process where it has well satisfied the rule and condition of modifying the return
while lowering or maintain the same level of risk. Diversification of investments into a group
of stocks would in turn be allowing the investors to get a better set of risk and reduce the
unsystematic risk that is associated with the stock.
Paraphrase This Document
Need a fresh take? Get an instant paraphrase of this document with our AI Paraphraser
10PORTFOLIO MANAGEMENT
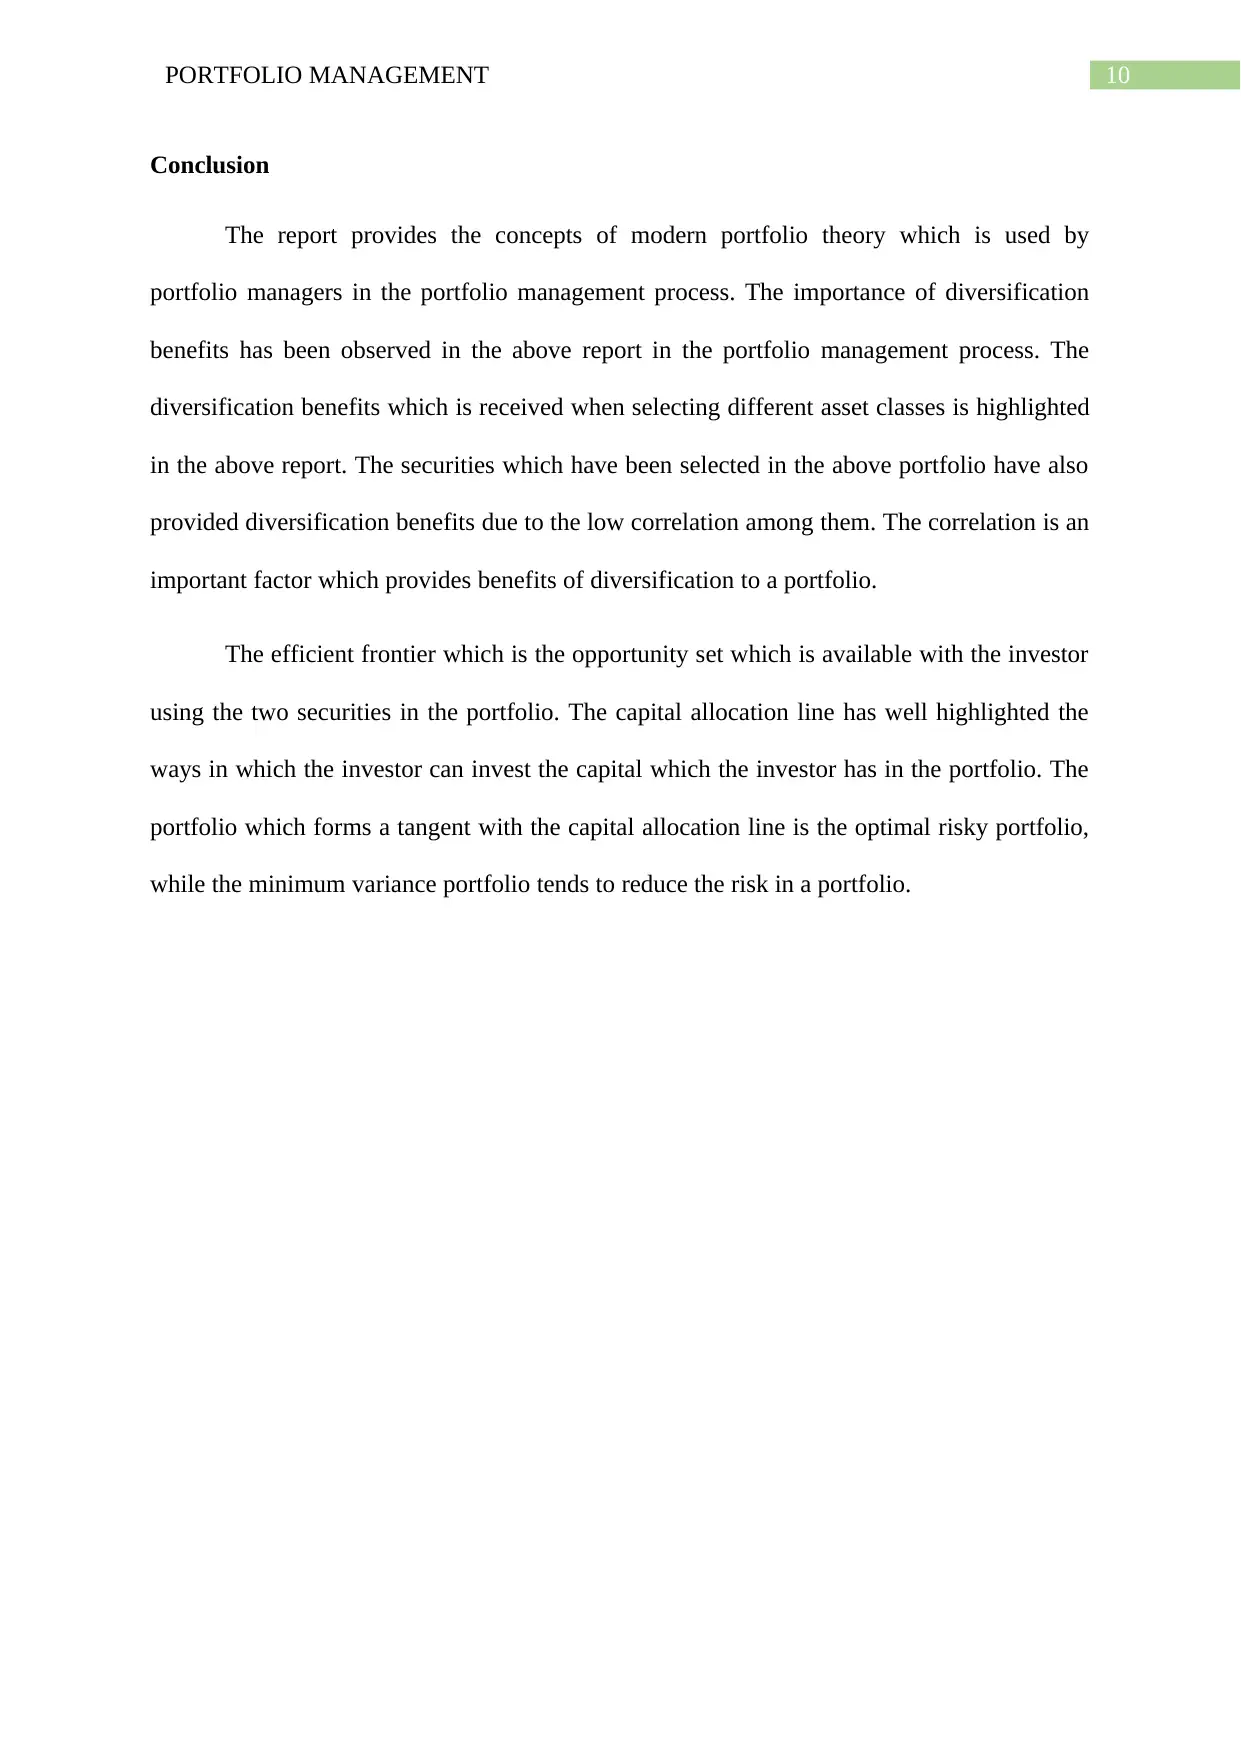
Conclusion
The report provides the concepts of modern portfolio theory which is used by
portfolio managers in the portfolio management process. The importance of diversification
benefits has been observed in the above report in the portfolio management process. The
diversification benefits which is received when selecting different asset classes is highlighted
in the above report. The securities which have been selected in the above portfolio have also
provided diversification benefits due to the low correlation among them. The correlation is an
important factor which provides benefits of diversification to a portfolio.
The efficient frontier which is the opportunity set which is available with the investor
using the two securities in the portfolio. The capital allocation line has well highlighted the
ways in which the investor can invest the capital which the investor has in the portfolio. The
portfolio which forms a tangent with the capital allocation line is the optimal risky portfolio,
while the minimum variance portfolio tends to reduce the risk in a portfolio.
11PORTFOLIO MANAGEMENT
References:
Anderson, S.C., Ward, E.J., Shelton, A.O., Adkison, M.D., Beaudreau, A.H., Brenner, R.E.,
Haynie, A.C., Shriver, J.C., Watson, J.T. and Williams, B.C., 2017. Benefits and risks of
diversification for individual fishers. Proceedings of the National Academy of
Sciences, 114(40), pp.10797-10802.
Birthal, P.S. and Hazrana, J., 2019. Crop diversification and resilience of agriculture to
climatic shocks: evidence from India. Agricultural systems, 173, pp.345-354.
Bodnar, T., Parolya, N. and Schmid, W., 2018. Estimation of the global minimum variance
portfolio in high dimensions. European Journal of Operational Research, 266(1), pp.371-
390.
Branger, N., Lučivjanská, K. and Weissensteiner, A., 2019. Optimal granularity for portfolio
choice. Journal of Empirical Finance, 50, pp.125-146.
Cai, T.T., Hu, J., Li, Y. and Zheng, X., 2020. High-dimensional minimum variance portfolio
estimation based on high-frequency data. Journal of Econometrics, 214(2), pp.482-494.
Christensen, S., Irle, A. and Ludwig, A., 2017. Optimal portfolio selection under vanishing
fixed transaction costs. Advances in Applied Probability, 49(4), pp.1116-1143.
Cui, H., Gao, Z., Kim, Y.J. and Shi, Y., 2017. Review on Capital Allocation Principles.
Grinold, R., 2018. Linear Trading Rules for Portfolio Management. The Journal of Portfolio
Management, 44(6), pp.109-119.
Henry, C., 2017. Managing Natural Capital in Line with Malinvaud's Approach to Efficient
Allocation of Capital. Annals of Economics and Statistics/Annales d'Économie et de
Statistique, (125/126), pp.165-168.
⊘ This is a preview!⊘
Do you want full access?
Subscribe today to unlock all pages.
Trusted by 1+ million students worldwide
1 out of 14
Related Documents


Your All-in-One AI-Powered Toolkit for Academic Success.
+13062052269
info@desklib.com
Available 24*7 on WhatsApp / Email
![[object Object]](/_next/static/media/star-bottom.7253800d.svg)
Unlock your academic potential
Copyright © 2020–2026 A2Z Services. All Rights Reserved. Developed and managed by ZUCOL.