Financial Analysis: Portfolio Risk, Return, and Beta Calculation
VerifiedAdded on 2022/10/15
|11
|1720
|15
Homework Assignment
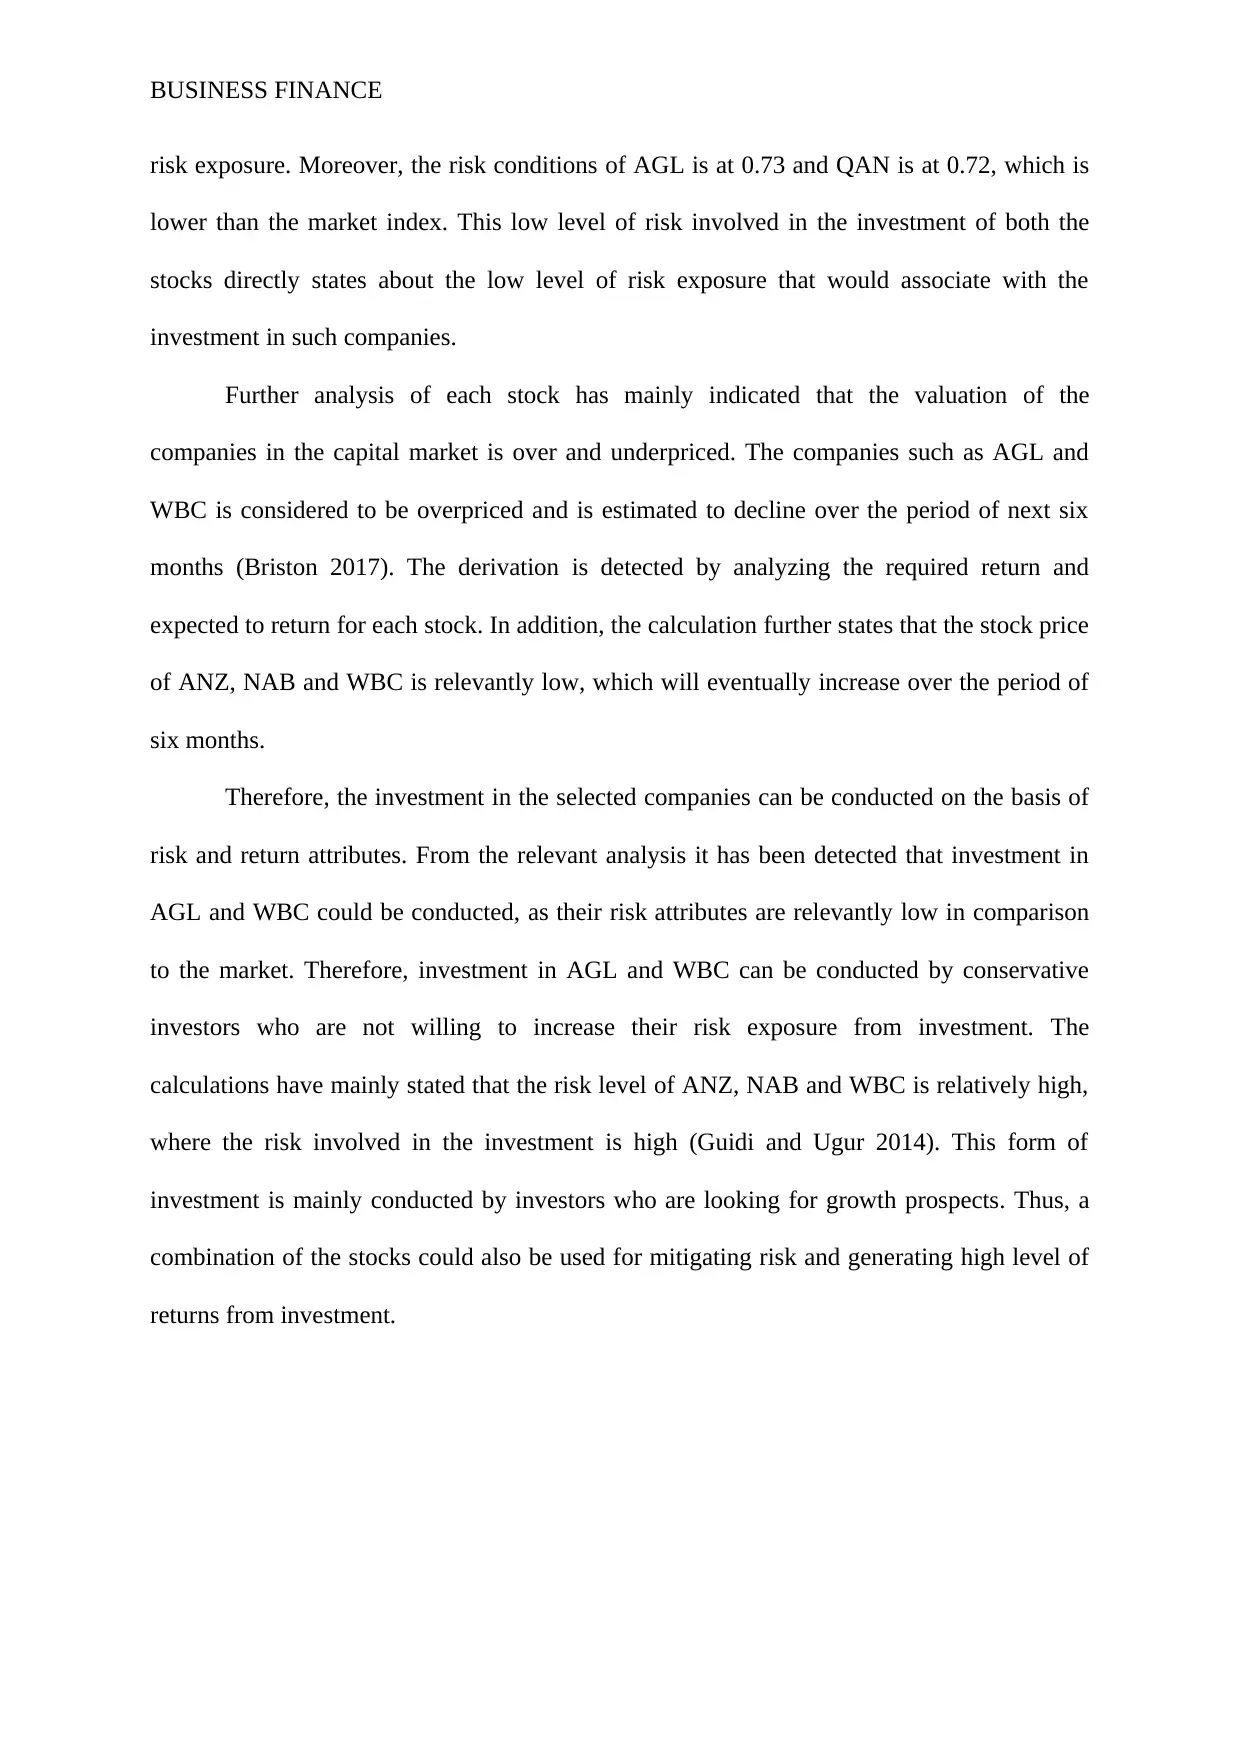
AI Summary
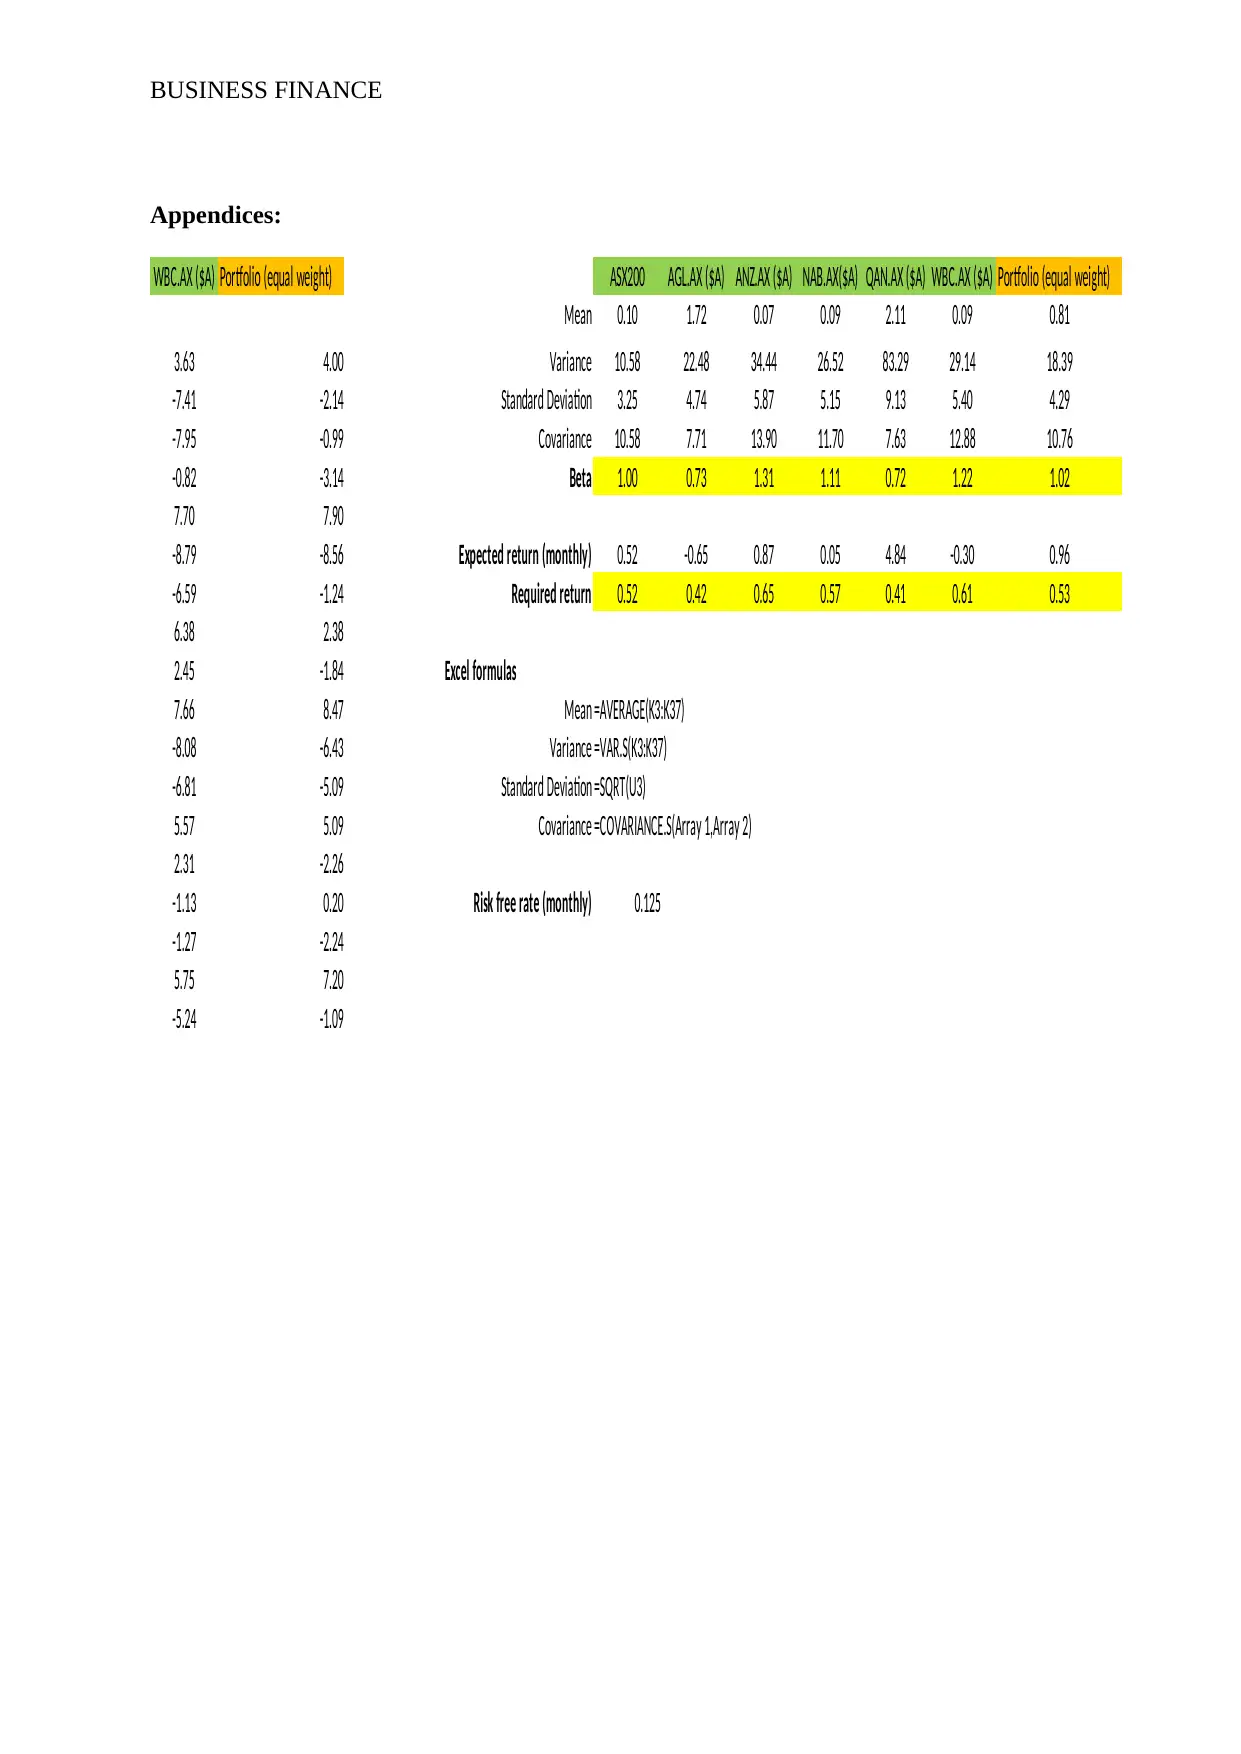
This business finance assignment analyzes the performance of various stocks and an index (ASX200) over three years, evaluating returns, volatility, and risk. The assignment includes calculations of average returns, standard deviations, and beta values for individual stocks and an equally weighted portfolio. The analysis compares the risk and return profiles of different investments, identifying potential overvalued and undervalued stocks. Key findings include the lower volatility of the ASX index compared to individual stocks and the benefits of portfolio diversification in reducing risk. The student concludes with investment recommendations based on risk tolerance, suggesting investments in AGL and WBC for conservative investors and highlighting the potential for growth in ANZ, NAB, and WBC for those seeking higher returns, while also advising on the use of a combined portfolio to mitigate risk. The assignment utilizes financial metrics to assess investment viability and provide strategic insights.


1 out of 11
Related Documents


Your All-in-One AI-Powered Toolkit for Academic Success.
+13062052269
info@desklib.com
Available 24*7 on WhatsApp / Email
![[object Object]](/_next/static/media/star-bottom.7253800d.svg)
Copyright © 2020–2026 A2Z Services. All Rights Reserved. Developed and managed by ZUCOL.