Portfolio Management Project: Stock Performance and Risk Analysis
VerifiedAdded on 2020/10/22
|10
|1439
|188
Project
AI Summary
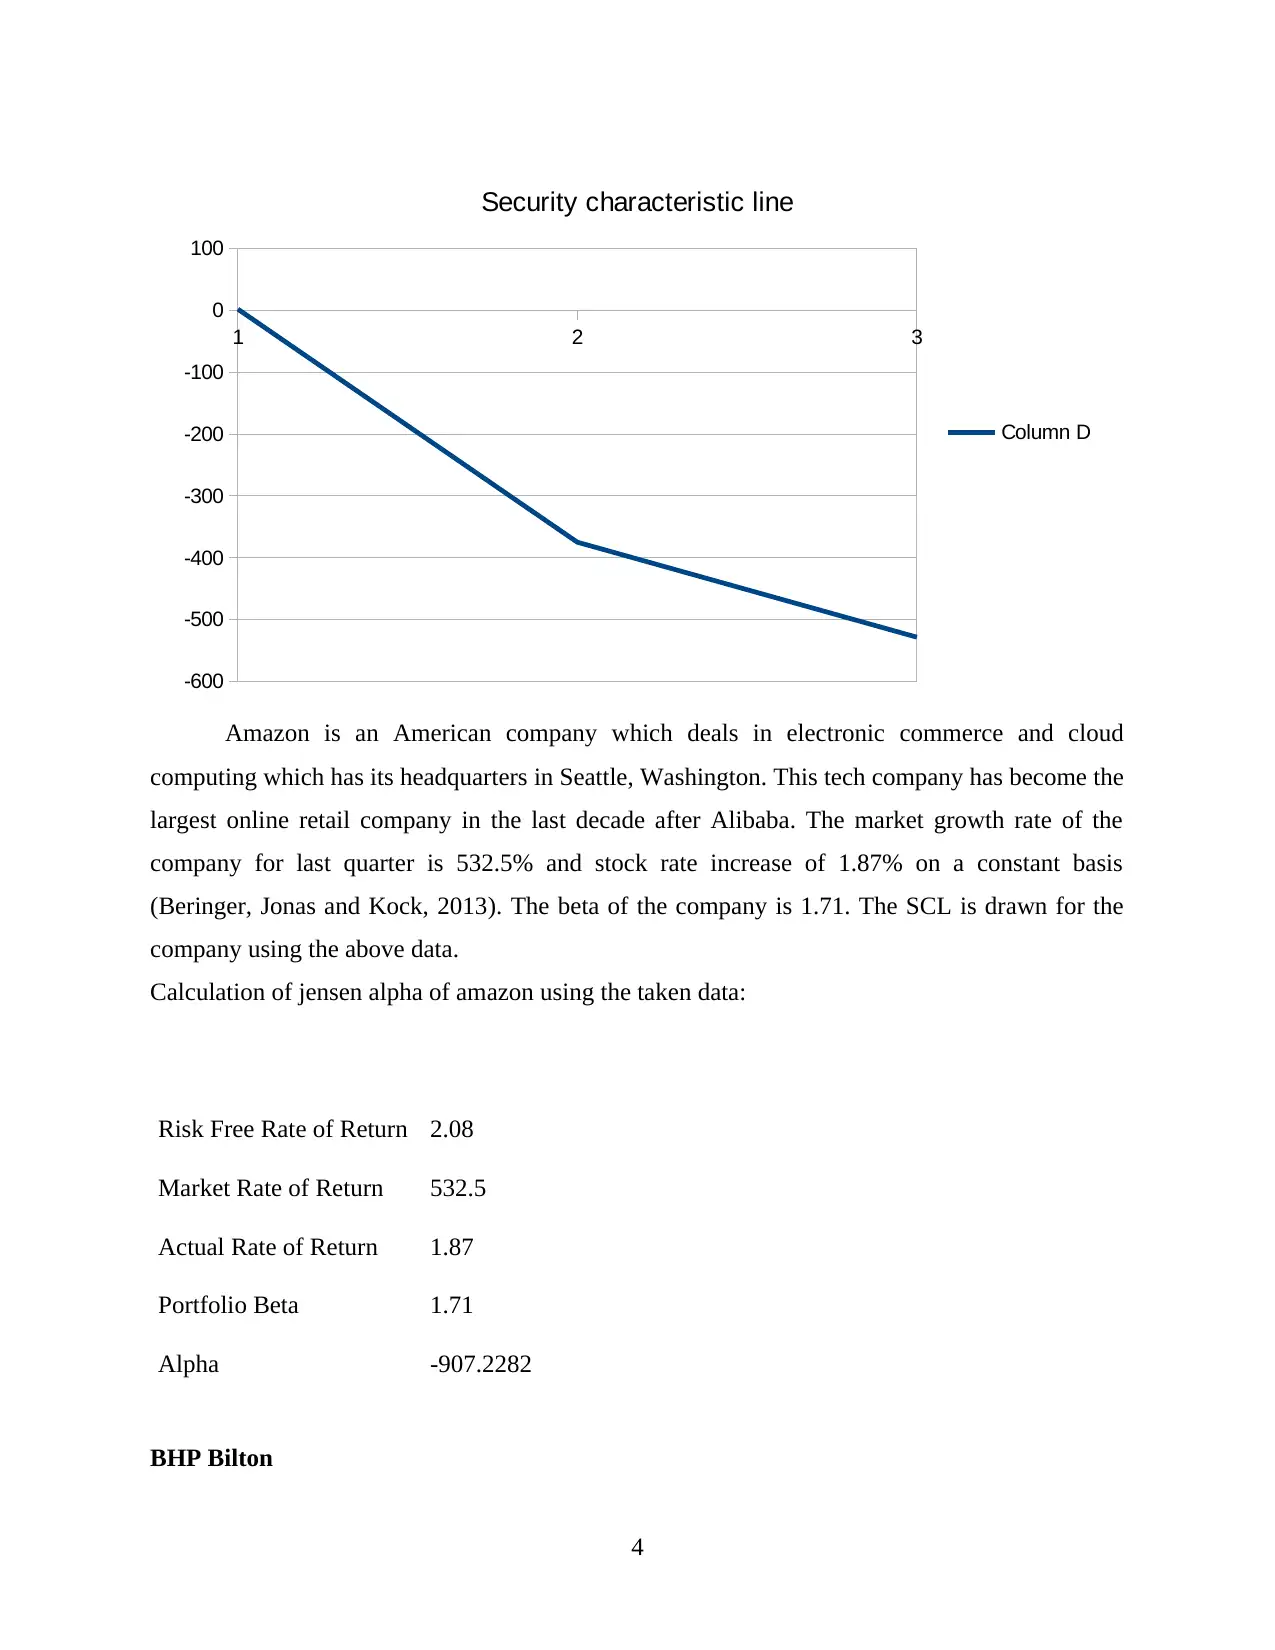
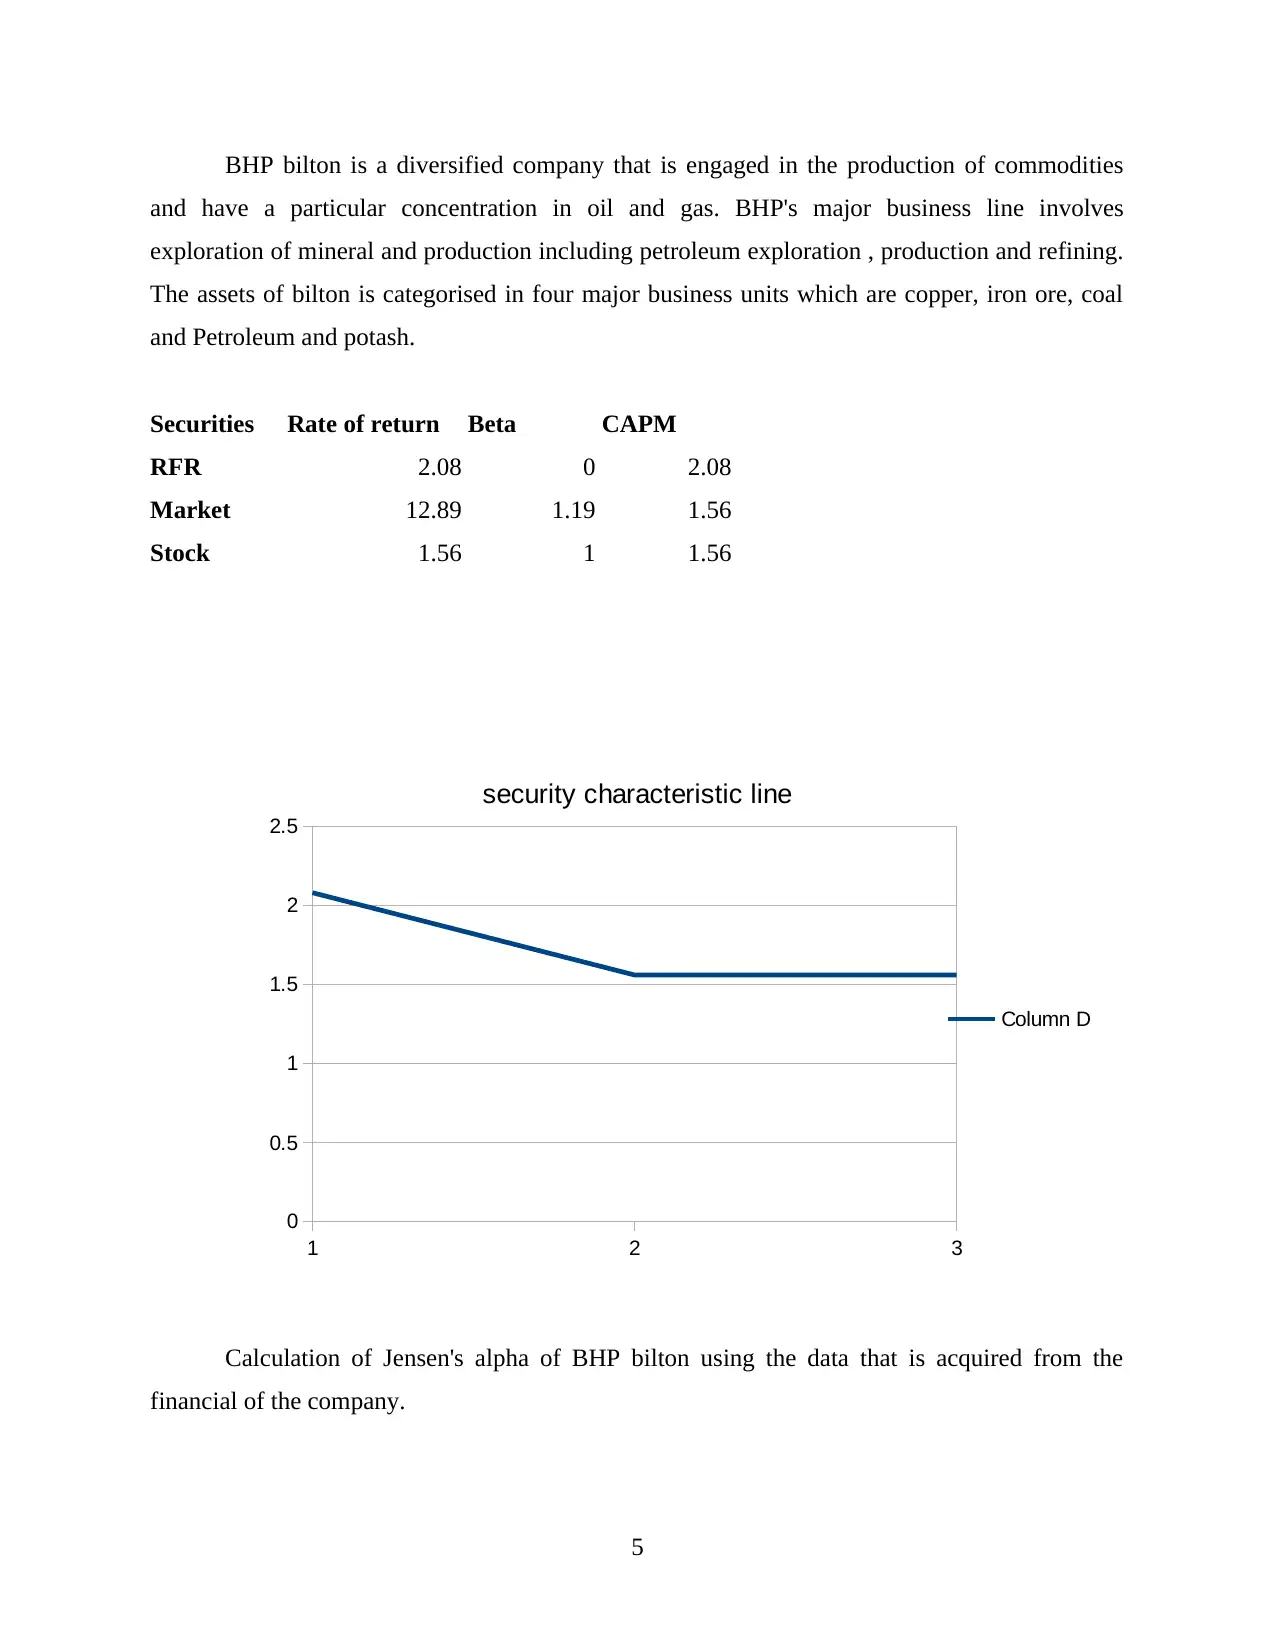
This project is a comprehensive analysis of portfolio management, focusing on the performance of stocks from Bank of America, Amazon, and BHP Bilton. The project begins with an introduction to portfolio management, outlining the process of decision-making, investment planning, and asset allocation. It proceeds to calculate the weekly treasury bill rate, used as a proxy for the risk-free rate, and estimates the security characteristic line (SCL) for each company, using regression analysis in Excel. The project then calculates the beta and Jensen's alpha for each stock, providing insights into their risk and return profiles. Furthermore, it delves into the calculation of total risk, distinguishing between systematic and unsystematic risks. The project comments on each stock's performance based on the calculated data, including market and actual returns. The conclusion summarizes the key findings, emphasizing the use of SCL and Jensen's alpha in assessing stock performance and risk. The project references various financial journals and books to support its analysis, providing a solid foundation for understanding portfolio management principles and their application to real-world stocks.

Portfolio Management
Paraphrase This Document
Need a fresh take? Get an instant paraphrase of this document with our AI Paraphraser

Table of Contents
INTRODUCTION...........................................................................................................................1
PART 3............................................................................................................................................1
A) Extraction of weekly treasury bill rate and using it as proxy for risk free rate......................1
B) Estimation of security characteristic line for each company stock.......................................1
Amazon............................................................................................................................................3
C) Calculation of total risk using systematic and unsystematic risk...........................................5
D) Commenting on the stock and portfolio's performance using above data.............................6
CONCLUSION................................................................................................................................6
REFERENCES................................................................................................................................7

INTRODUCTION
Portfolio management is process of decision making about the policies and investment
mix, formulating investment plans that is suitable to the objectives of the investors, allocating
different assets as per the risk bearing capacity and the earnings of the individuals and
institutions. Managing the portfolios mainly deals with identifying the strengths, weaknesses,
threats and opportunities in creating balance between Debt and equity, international vs domestic ,
safety stocks vs growth stocks. Here , this project discusses about stock prices three companies
namely bank of America, amazon and BHP Bilton. It will discuss about the security
characteristic line for each stock and based on market model and computation of beta and
Jensen's alpha for each portfolio. Calculation of variance , systematic and unsystematic risk of
every portfolio (Alexander and Baptista, 2010).
PART 3
A) Extraction of weekly treasury bill rate and using it as proxy for risk free rate
The yield of 26 week treasury bill rate as taken from the U.S. Department of the treasury
is 2.08 for the average of 26 weeks. This amount is already the average of the 26 weeks yields
which will then be used as a proxy for risk free rate in the calculation of beta and Jensen's alpha.
B) Estimation of security characteristic line for each company stock
Bank of America is an multinational financial services firm that is operating in united
states of America. It is ranked as the top second bank of America, as of 2016 the bank of
America is 26th largest company in terms of revenue. According to the data the bank of America
is providing a market rate of return of 30.64% and a return on stock of 29.12%. the beta of the
company is 1.39 and the calculated CAPM is 41.7784 (Arouri, Jouini and Nguyen, 2011). The
security characteristic line is drawn using regression function of excel and defines the data
through this line.
1
⊘ This is a preview!⊘
Do you want full access?
Subscribe today to unlock all pages.

Trusted by 1+ million students worldwide

Data of bank of America
Securities Rate of return Beta CAPM
Risk-free 2.08 0 2.08
Market 30.64 1.39 41.7784
Stock 29.12 1 29.12
Jensen alpha:
The calculation of Jensen's alpha is calculated as follow:
Risk Free Rate of Return 2.08
Market Rate of Return 30.64
Actual Rate of Return 29.12
Portfolio Beta 1.39
Alpha -12.6584
2
Securities Rate of return Beta CAPM
Risk-free 2.08 0 2.08
Market 30.64 1.39 41.7784
Stock 29.12 1 29.12
Jensen alpha:
The calculation of Jensen's alpha is calculated as follow:
Risk Free Rate of Return 2.08
Market Rate of Return 30.64
Actual Rate of Return 29.12
Portfolio Beta 1.39
Alpha -12.6584
2
Paraphrase This Document
Need a fresh take? Get an instant paraphrase of this document with our AI Paraphraser

Amazon
Securities Rate of return Beta CAPM
RFR 2.08 0 2.08
Market 532.5 1.71 -374.8773
Stock 1.87 1 -528.55
3
1 2 3
0
5
10
15
20
25
30
35
40
45
Security characteristic line
Column D
Securities Rate of return Beta CAPM
RFR 2.08 0 2.08
Market 532.5 1.71 -374.8773
Stock 1.87 1 -528.55
3
1 2 3
0
5
10
15
20
25
30
35
40
45
Security characteristic line
Column D

Amazon is an American company which deals in electronic commerce and cloud
computing which has its headquarters in Seattle, Washington. This tech company has become the
largest online retail company in the last decade after Alibaba. The market growth rate of the
company for last quarter is 532.5% and stock rate increase of 1.87% on a constant basis
(Beringer, Jonas and Kock, 2013). The beta of the company is 1.71. The SCL is drawn for the
company using the above data.
Calculation of jensen alpha of amazon using the taken data:
Risk Free Rate of Return 2.08
Market Rate of Return 532.5
Actual Rate of Return 1.87
Portfolio Beta 1.71
Alpha -907.2282
BHP Bilton
4
1 2 3
-600
-500
-400
-300
-200
-100
0
100
Security characteristic line
Column D
⊘ This is a preview!⊘
Do you want full access?
Subscribe today to unlock all pages.

Trusted by 1+ million students worldwide

BHP bilton is a diversified company that is engaged in the production of commodities
and have a particular concentration in oil and gas. BHP's major business line involves
exploration of mineral and production including petroleum exploration , production and refining.
The assets of bilton is categorised in four major business units which are copper, iron ore, coal
and Petroleum and potash.
Securities Rate of return Beta CAPM
RFR 2.08 0 2.08
Market 12.89 1.19 1.56
Stock 1.56 1 1.56
Calculation of Jensen's alpha of BHP bilton using the data that is acquired from the
financial of the company.
5
1 2 3
0
0.5
1
1.5
2
2.5
security characteristic line
Column D
Paraphrase This Document
Need a fresh take? Get an instant paraphrase of this document with our AI Paraphraser

Risk Free Rate of Return 2.08
Market Rate of Return 12.89
Actual Rate of Return 1.56
Portfolio Beta 1.19
Alpha -13.3839
C) Calculation of total risk using systematic and unsystematic risk
Unsystematic risk is that risk of the companies which can be diversified , it is also called
as residual risk. This is the risk related with the companies and industries that you invest in. the
unsystematic risk of the securities can be reduced through diversification of other securities that
are in the individuals portfolio (Chandra, 2017).
Systematic risk is known as market risk , it is the risk that is applicable to all the
industries , this risk is not related to specific company or industry. The systematic risk cannot be
diversified by other securities, the measure of systematic risk is known as beta. The market beta
is always 1. GDP growth , recessions are example of systematic risk that affects the shares of
company.
Total variance is calculated as follows:
Total variance = systematic variance + unsystematic variance
systematic variance is calculated as follows:
Systematic Risk=β⋅σ market⇒Systematic Variance=(Systematic Risk)2
then you can rearrange the identity above to get:
Unsystematic Variance=Total Variance−Systematic Variance
Or if you want the number as "risk" (i.e. standard deviation), then:
Unsystematic Risk= √(Total Variance−Systematic Variance)
D) Commenting on the stock and portfolio's performance using above data
By looking on the data in B and C section it can be commented that the performance of
bank of America is quite effective for the last two quarters. The market return of stock is 30.64
and the actual return on the stock of bank of America is 29.12. Similarly the data of amazon and
6

BHP bilton analyse that market return of both companies are 532.5 and 12.89% respectively.
The actual return on the companies has been evaluated as 1.87 and 1.56 respectively. The
graphical presentation by SCL and using Jensen's formula is also done. Finally , the total
variance calculation is described as systematic risk plus unsystematic risk (LaBrosse, 2010).
CONCLUSION
It has been concluded from the above report that by using the US treasury bill yield of 26
weeks as the risk free rate we will make an estimate by drawing security characteristic line which
will be based on market model. Computation of beta and Jensen's alpha is also shown and
described in brief in the project report. Also the calculation systematic and unsystematic risk of
markets is done in the above project. Finally the comments are highlighted regarding the
performances of the company.
7
⊘ This is a preview!⊘
Do you want full access?
Subscribe today to unlock all pages.

Trusted by 1+ million students worldwide

REFERENCES
Books and Journals
Alexander, G. J. and Baptista, A.M., 2010. Active portfolio management with benchmarking: A
frontier based on alpha. Journal of Banking & Finance. 34(9). pp.2185-2197.
Arouri, M. E. H. , Jouini, J. and Nguyen, D. K. , 2011. Volatility spillovers between oil prices
and stock sector returns: implications for portfolio management. Journal of International
money and finance. 30(7). pp.1387-1405.
Beringer, C. , Jonas, D. and Kock, A., 2013. Behavior of internal stakeholders in project
portfolio management and its impact on success. International Journal of Project
Management. 31(6). pp.830-846.
Chandra, P. , 2017. Investment analysis and portfolio management. McGraw-Hill Education.
LaBrosse, M. , 2010. Project‐portfolio management. Employment relations today. 37(2). pp.75-
79.
8
1 out of 10
Related Documents
Your All-in-One AI-Powered Toolkit for Academic Success.
+13062052269
info@desklib.com
Available 24*7 on WhatsApp / Email
Unlock your academic potential
Copyright © 2020–2025 A2Z Services. All Rights Reserved. Developed and managed by ZUCOL.


