Portfolio Performance Analysis: NZX Investment Strategy and Results

Verified

Added on  2019/10/18

|6
|1410
|166
Project
AI Summary
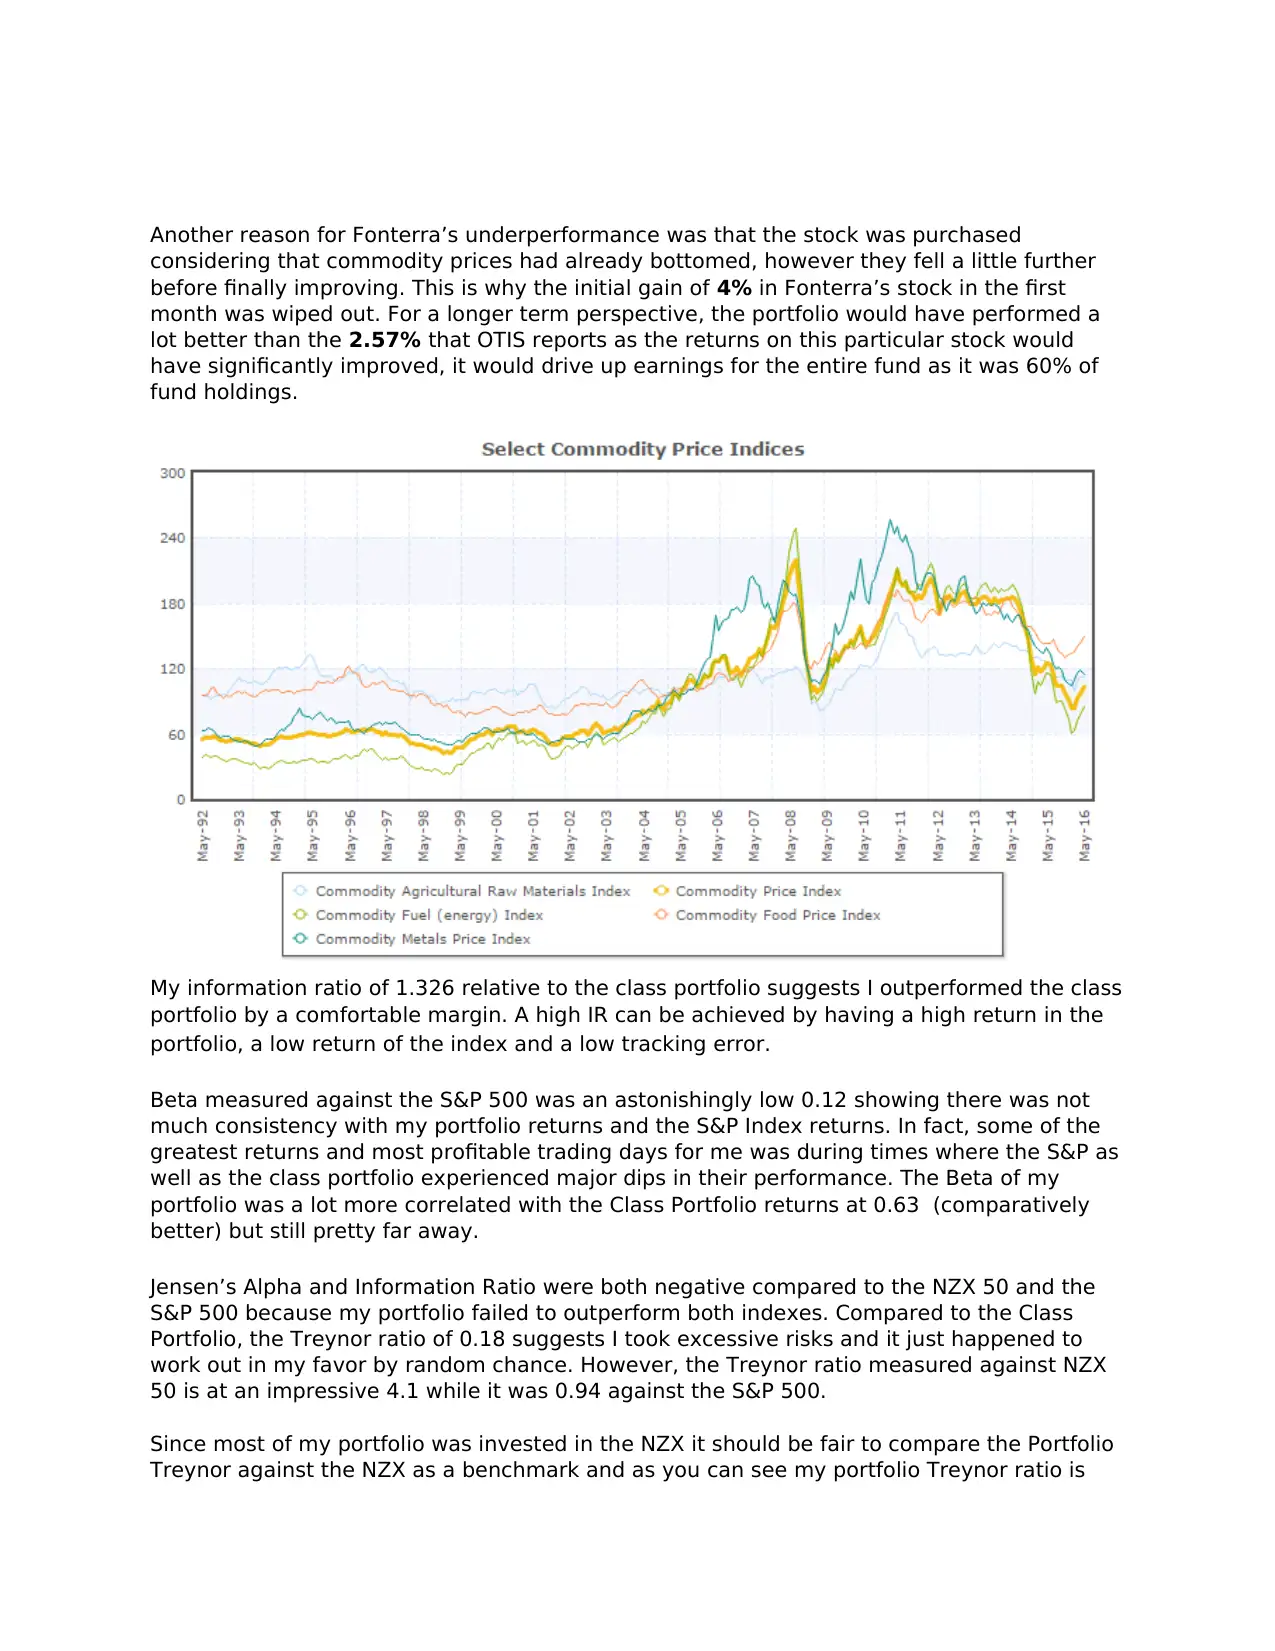
This project analyzes a student's portfolio performance, investment strategy, and market dynamics. The student implemented a 'buy and hold' strategy, primarily investing in NZX-listed stocks, with a focus on companies expected to benefit from the TPP agreement. The portfolio's performance is evaluated against the class portfolio and various benchmarks like the S&P 500, considering factors such as exchange rate fluctuations, commodity prices, and political risks. The analysis includes key metrics like information ratio, beta, Jensen's Alpha, and Treynor ratio to assess the portfolio's risk-adjusted returns and the effectiveness of the investment decisions. The student reflects on the strategy, identifies areas for improvement, and discusses potential alternative investment approaches to optimize returns and manage risks more effectively. The student's strategy, which included investments in Fonterra, Ports of New Zealand, and property businesses, resulted in a net profit of $25,000, despite negative returns from Fonterra, and outperformed the class portfolio.
Document Page
tabler-icon-diamond-filled.svg

Paraphrase This Document

Need a fresh take? Get an instant paraphrase of this document with our AI Paraphraser
Document Page
Portfolio Performance Measurements
Document Page
Original Portfolio Strategy
The original strategy BUY and HOLD was formulated after taking into consideration some underlying assumptions
and expectations on how the global economy would perform in the short run, in the upcoming year. My strategy
evolved overtime as I gained more insights on how the NZX was performing.
To further challenge myself and gain a better understanding about the New Zealand economy post TPP, I decided
80% of my total investment universe would comprise of just stocks listed on the NZX and allowed myself to
diversify 20% of the funds into foreign markets if I wanted to. I was also expecting a global recession and negative
returns from the market as per many investment banking analyst reports.
I focused on the fundamentals and hypothesized that the main companies that would benefit from the TPP were
industries directly involved in trade, which led me to invest heavily (25%) in all stocks that were directly linked to
the ports of New Zealand (Port of Tauranga and Auckland Airport). Another company that would benefit from the
TPP would be Fonterra, and since Food is a relatively recession proof business (inelastic demand for food) I
invested 50% of my total portfolio in Fonterra, assuming this would be a relatively safe investment.
15% of my portfolio was spread out evenly among the various Property businesses in New Zealand. The
expectation here was that if all my other assumptions hold, with increase in trade, would lead to an increase in
immigration and disposable income arising from higher profits and so property would also rise further.
I used the last 10% of my portfolio as a hedge against recession and identified stocks of certain companies that
have potential to do better during a recession than they do in times of an economic boom. This portion of the
portfolio was invested in Mc Donald’s (S&P 500). When disposable income decreases, people try to find cheaper,
low cost alternatives and companies like Mc Donald’s and discount stores report higher profits.
Document Page
Portfolio Performance discussion
Given the fact that Fonterra (which comprised of 60% of the total portfolio towards the end
of the semester) ended up with a slightly negative return (due to bottoming of the
commodities market, lowest since 2008) I am fairly satisfied with the $25,000 net profit my
Portfolio turned over. This profit was made on just 40%-50% of the portfolio value which was
$400,000 (annualized net return of 26%). Fonterra was performing as expected in the first
month but the unexpected announcement had a negative impact on the stock price. In the
grand scheme of things and in the longer term however, Fonterra will bounce back and the
portfolio will make abnormal returns.
The correct benchmark to use in this scenario would be the class portfolio instead of the S&P
500. This is because for the purpose of the simulation, we were limited and could only trade
in equities and bonds, whereas for our benchmark portfolio, fund managers benefitted from
leverage and could make use of short selling among other things. Using the Fun portfolio
and leverage, my portfolio has already returned $100,000 (48 hours) by investing in the
futures market for gold, commodities (agriculture) and liquid milk
Exchange rate fluctuations was also a major reason of my Portfolio returns were more
volatile than they seem to have been. The portfolio on OTIS was being reported in
equivalent USD and the NZD appreciated against the USD by a massive 8% between March
and June (beginning price – closing price) but this gain was not consistent. The exchange
rate was bouncing all over the place (highs and lows) and did the returns on my portfolio as
a direct result of this. The New Zealand market is a lot less liquid and volatile than my
portfolio data suggests. In hindsight, it would have been a good idea to add another
benchmark of NZD relative to the USD which could explain some of the volatility of returns
in my portfolio (tracking error).
tabler-icon-diamond-filled.svg

Paraphrase This Document

Need a fresh take? Get an instant paraphrase of this document with our AI Paraphraser
Document Page
Another reason for Fonterra’s underperformance was that the stock was purchased
considering that commodity prices had already bottomed, however they fell a little further
before finally improving. This is why the initial gain of 4% in Fonterra’s stock in the first
month was wiped out. For a longer term perspective, the portfolio would have performed a
lot better than the 2.57% that OTIS reports as the returns on this particular stock would
have significantly improved, it would drive up earnings for the entire fund as it was 60% of
fund holdings.
My information ratio of 1.326 relative to the class portfolio suggests I outperformed the class
portfolio by a comfortable margin. A high IR can be achieved by having a high return in the
portfolio, a low return of the index and a low tracking error.
Beta measured against the S&P 500 was an astonishingly low 0.12 showing there was not
much consistency with my portfolio returns and the S&P Index returns. In fact, some of the
greatest returns and most profitable trading days for me was during times where the S&P as
well as the class portfolio experienced major dips in their performance. The Beta of my
portfolio was a lot more correlated with the Class Portfolio returns at 0.63 (comparatively
better) but still pretty far away.
Jensen’s Alpha and Information Ratio were both negative compared to the NZX 50 and the
S&P 500 because my portfolio failed to outperform both indexes. Compared to the Class
Portfolio, the Treynor ratio of 0.18 suggests I took excessive risks and it just happened to
work out in my favor by random chance. However, the Treynor ratio measured against NZX
50 is at an impressive 4.1 while it was 0.94 against the S&P 500.
Since most of my portfolio was invested in the NZX it should be fair to compare the Portfolio
Treynor against the NZX as a benchmark and as you can see my portfolio Treynor ratio is
Document Page
very high, directly as a result my the very low beta of 0.028
Optimum portfolio
I was very happy with my overall portfolio strategy and had already put considerable
thought into investing before I made my move. The current portfolio I held, was already very
close to my optimum portfolio in my opinion. Political risk and systemic risk that I faced
could not have been diversified away (I got unlucky) and it was a very good bet for the level
of risk I had taken.
The only change I would have done is invest 20% of my portfolio in very risky assets,
example: Greek Junk Bonds but OTIS did not approve of them to be added to the Simulator.
My immediate reaction then, which unfortunately it was not, should have been to invest 20%
of my funds into small cap value stocks instead to compensate for the risk exposure I was
not able to take.
Another thing I would have done differently if my goal was to maximize total returns in the
classroom, would have been to actively trade on the platform instead of my buy and hold
strategy. I would have also invested in the S&P 500 instead to diversify away exchange rate
risk since investing in currency futures was not one of the options. However, my main goal
was not to beat the S&P 500 but rather to test out my theories and predictions in real life
and see for myself how accurate my forecasts were. The information ratio of 1.326 against
the class ratio says more than I ever could about this matter.
chevron_up_icon
1 out of 6
circle_padding
hide_on_mobile
zoom_out_icon
[object Object]