Poundland Retail Store Analysis: Primary Data and Customer Reviews

Verified

Added on  2023/01/19

|23
|1407
|81
Report
AI Summary
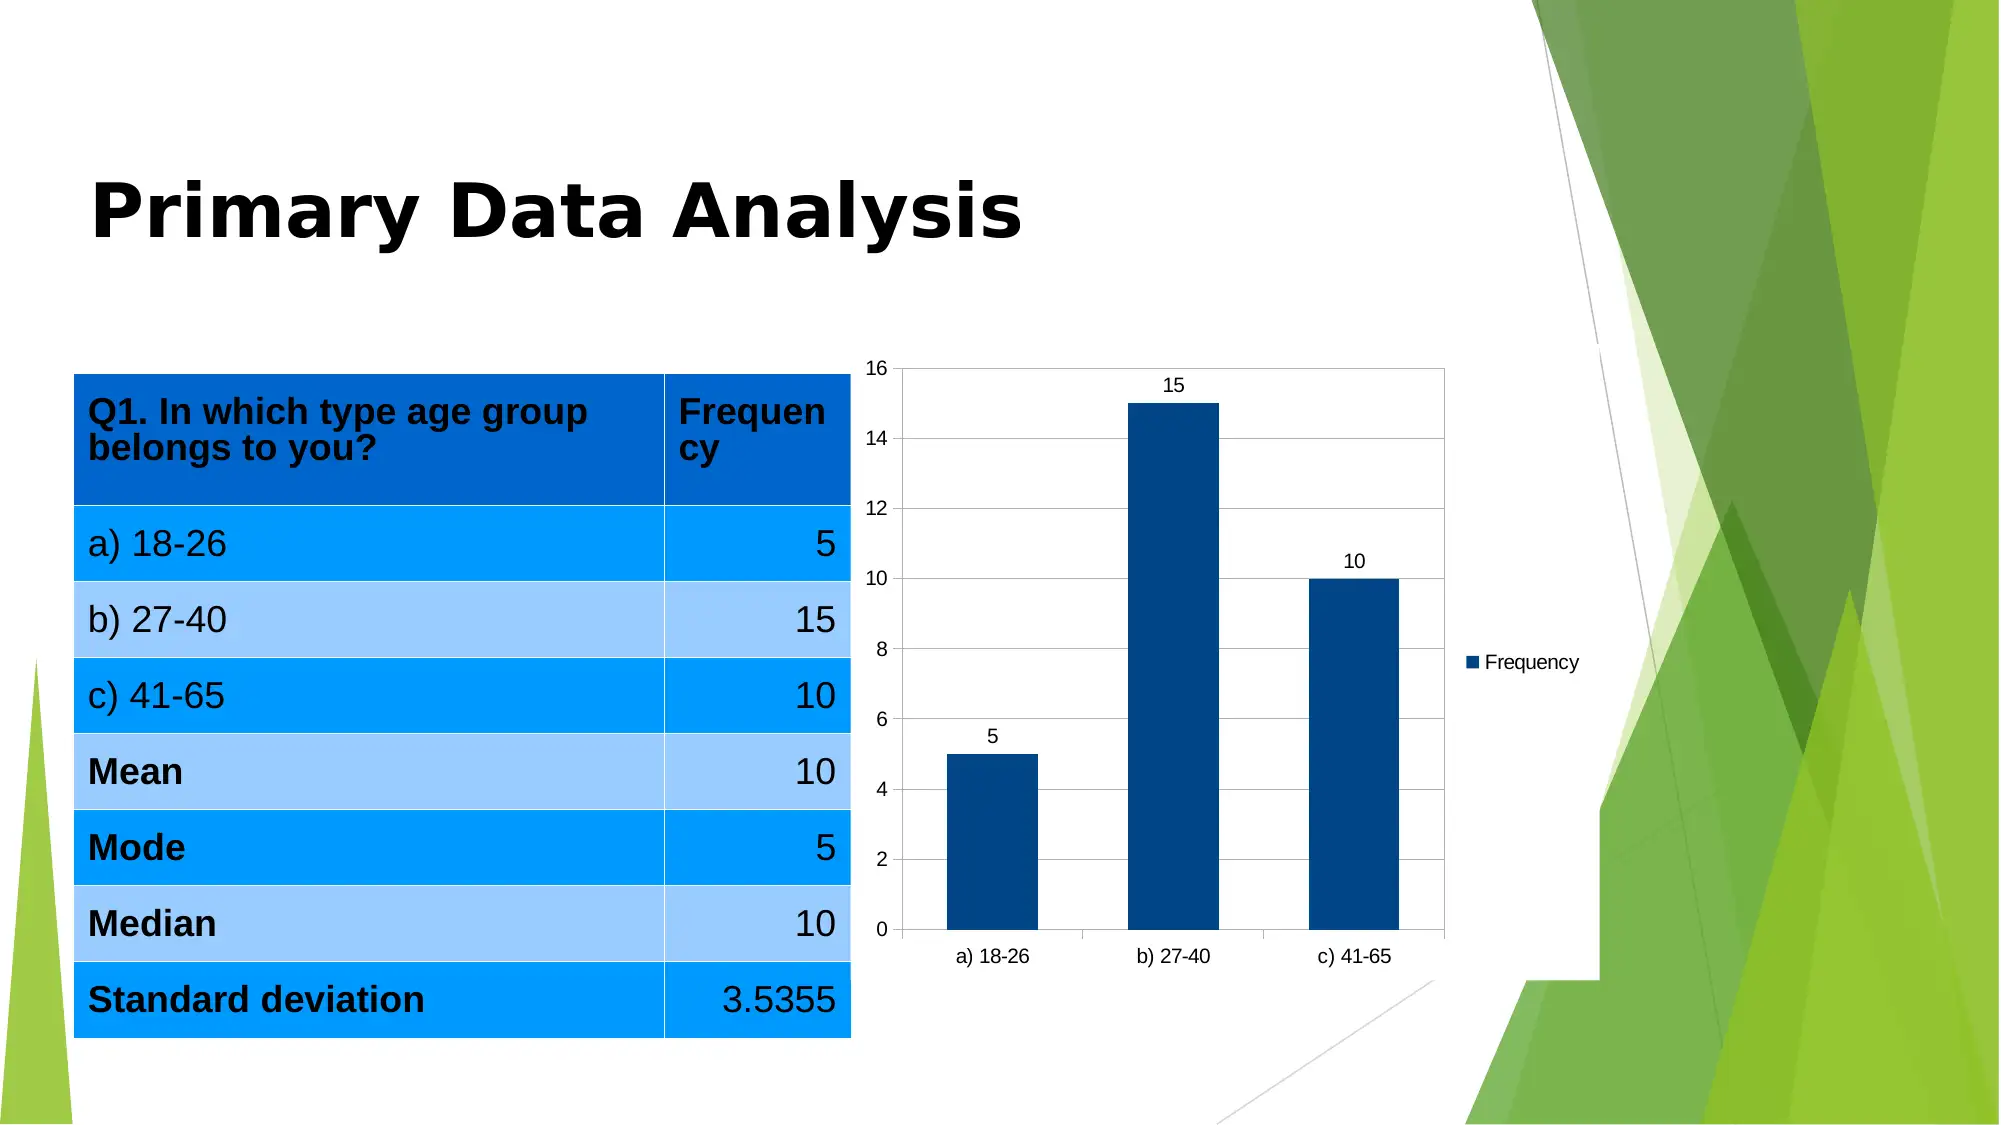
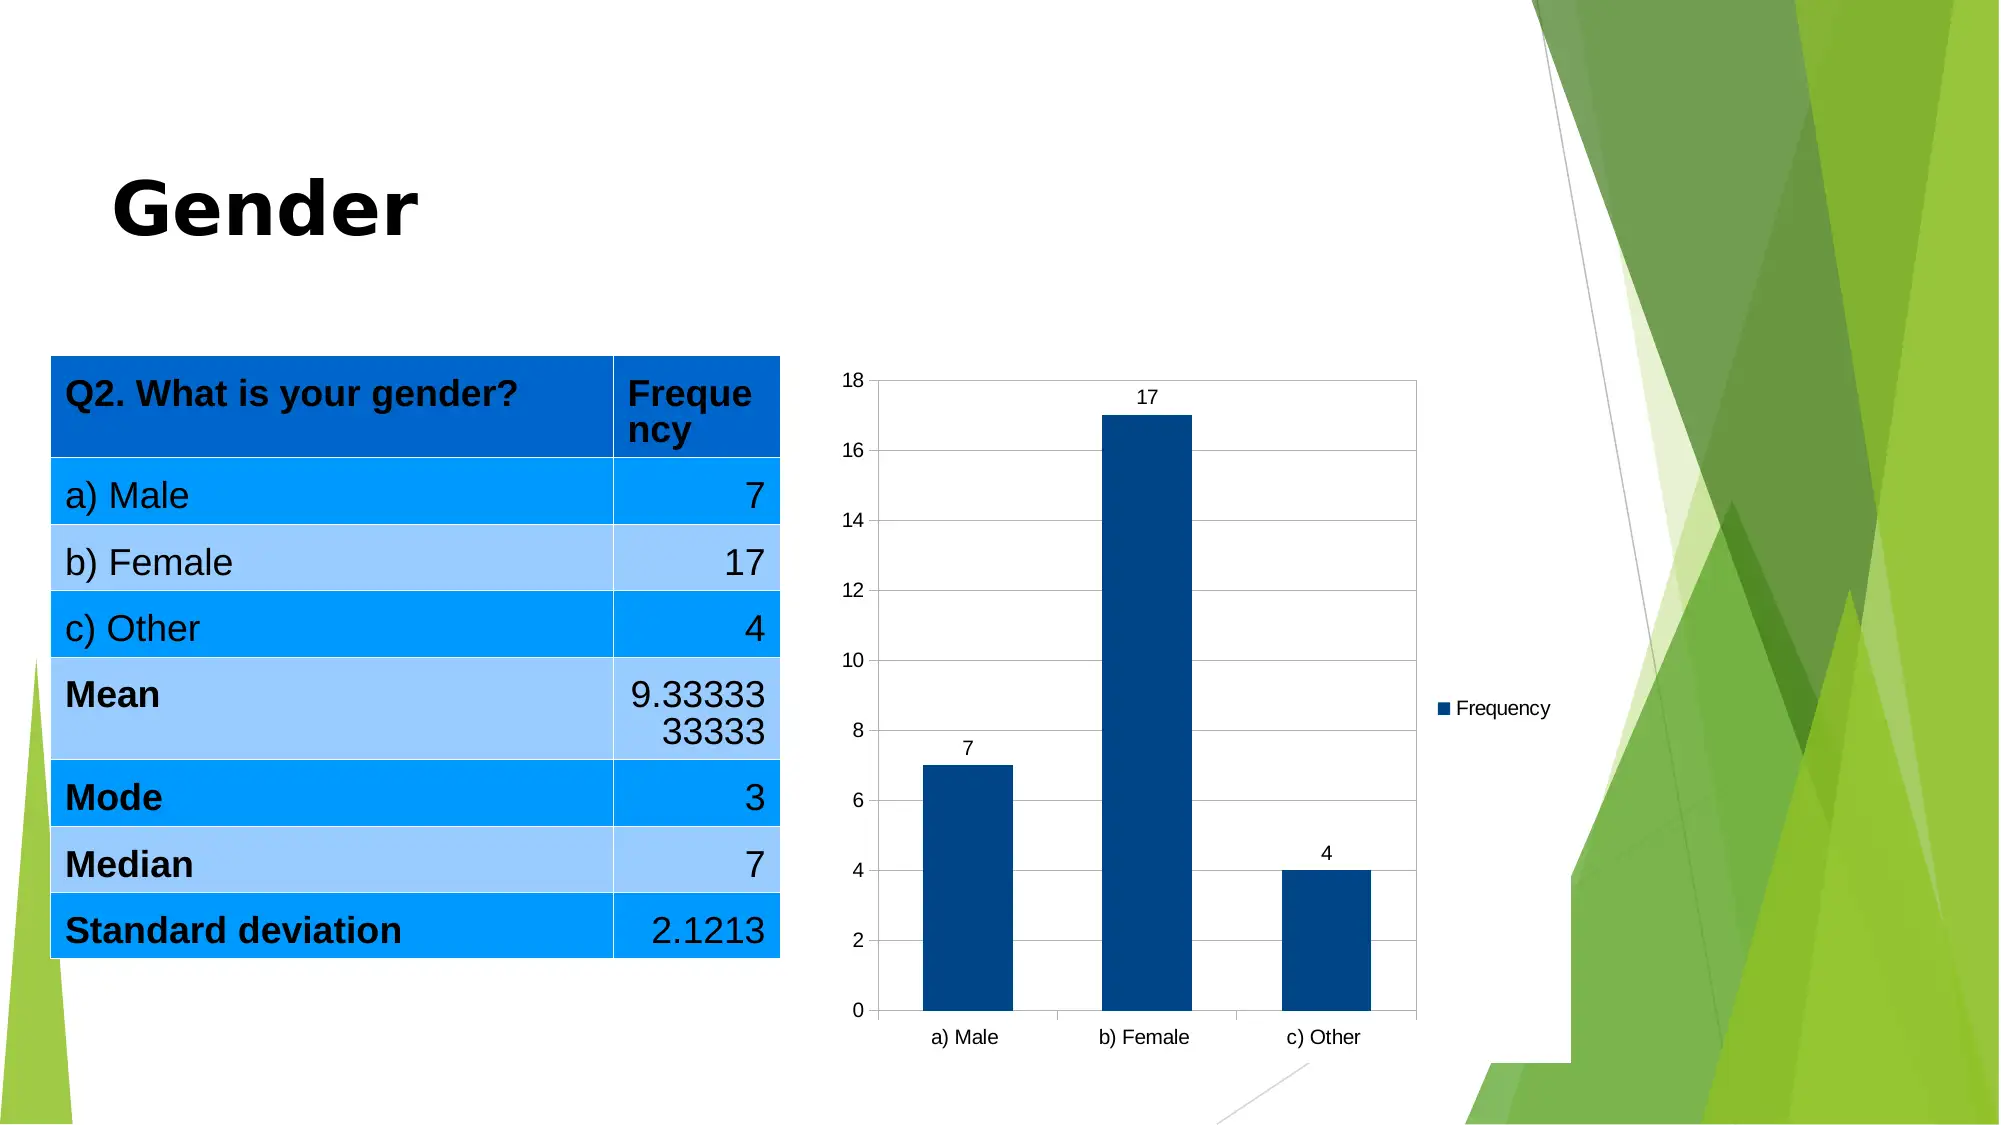
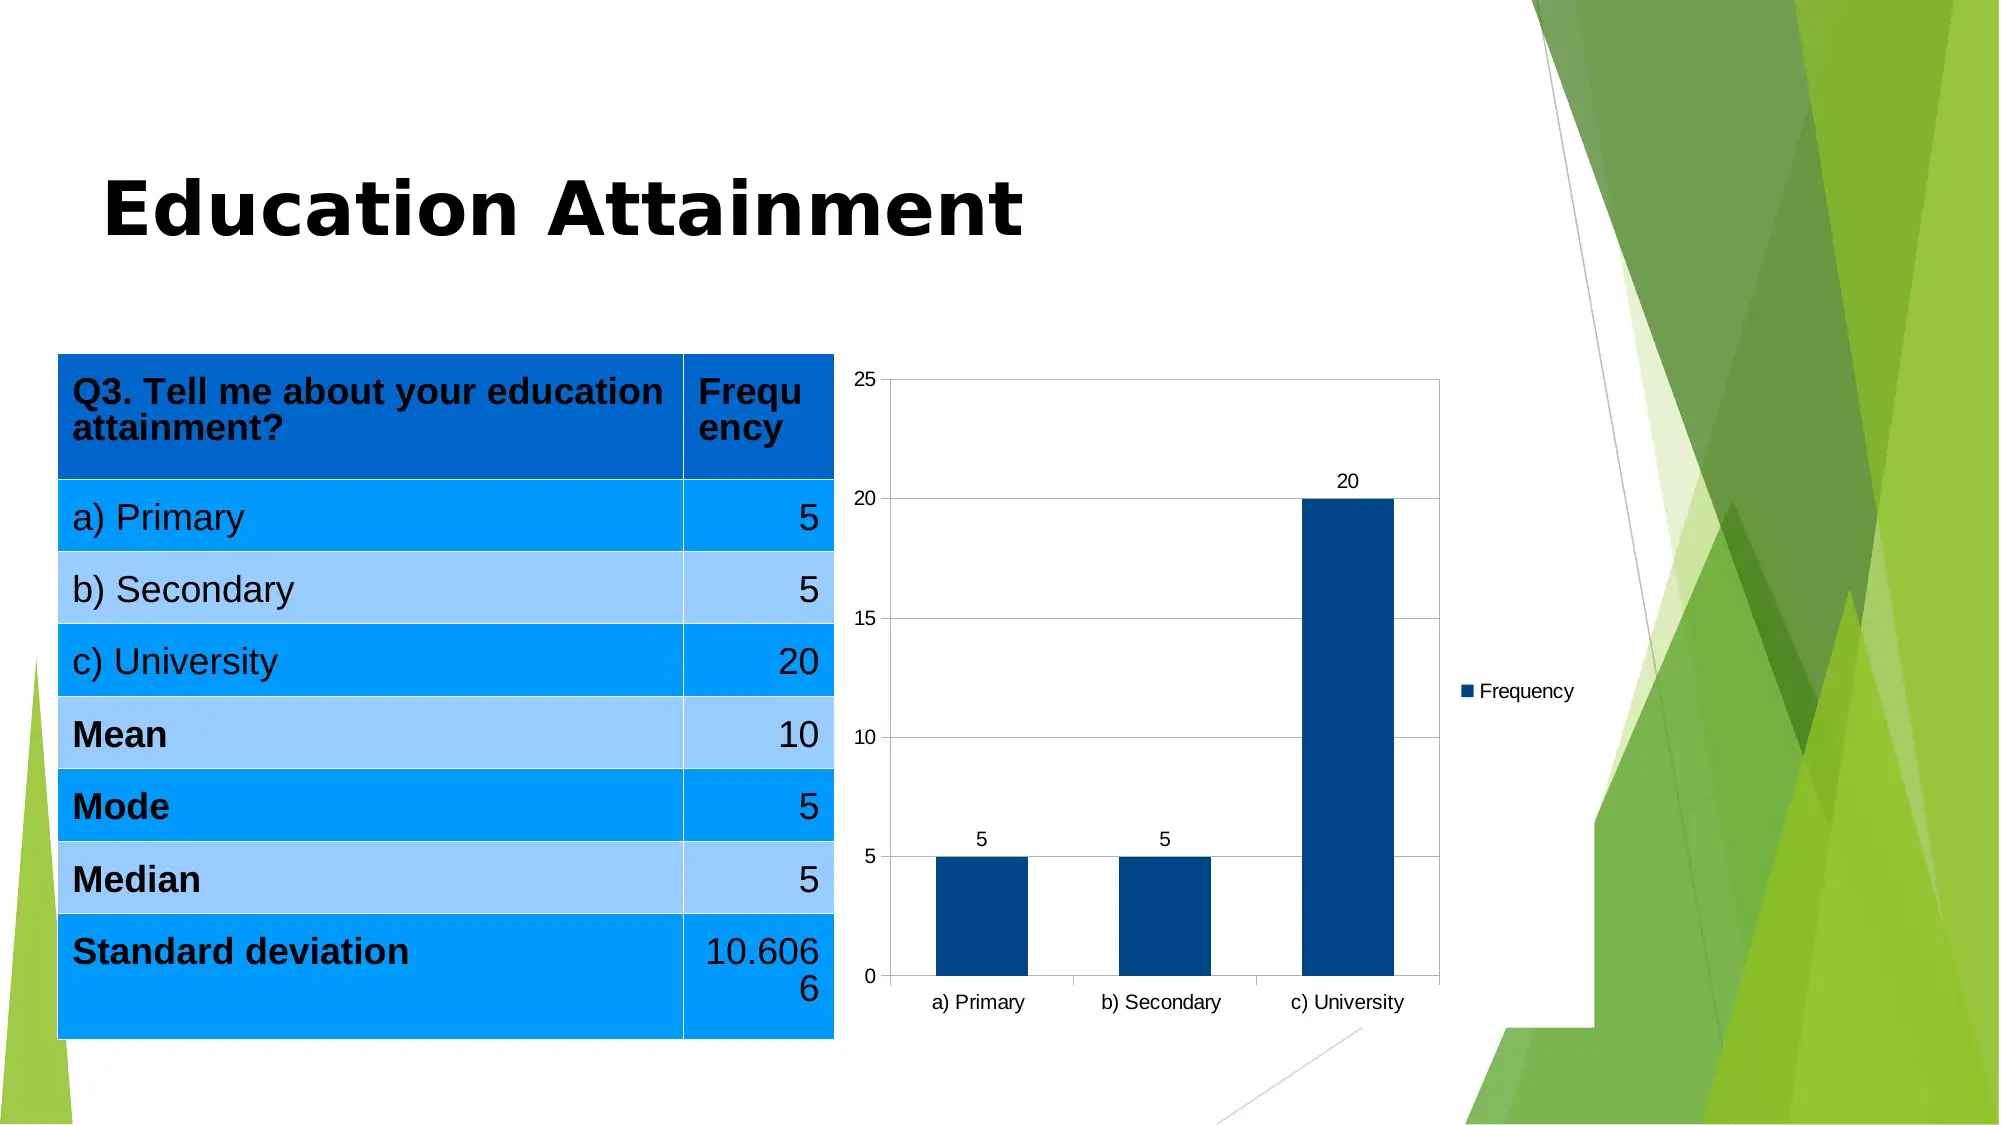
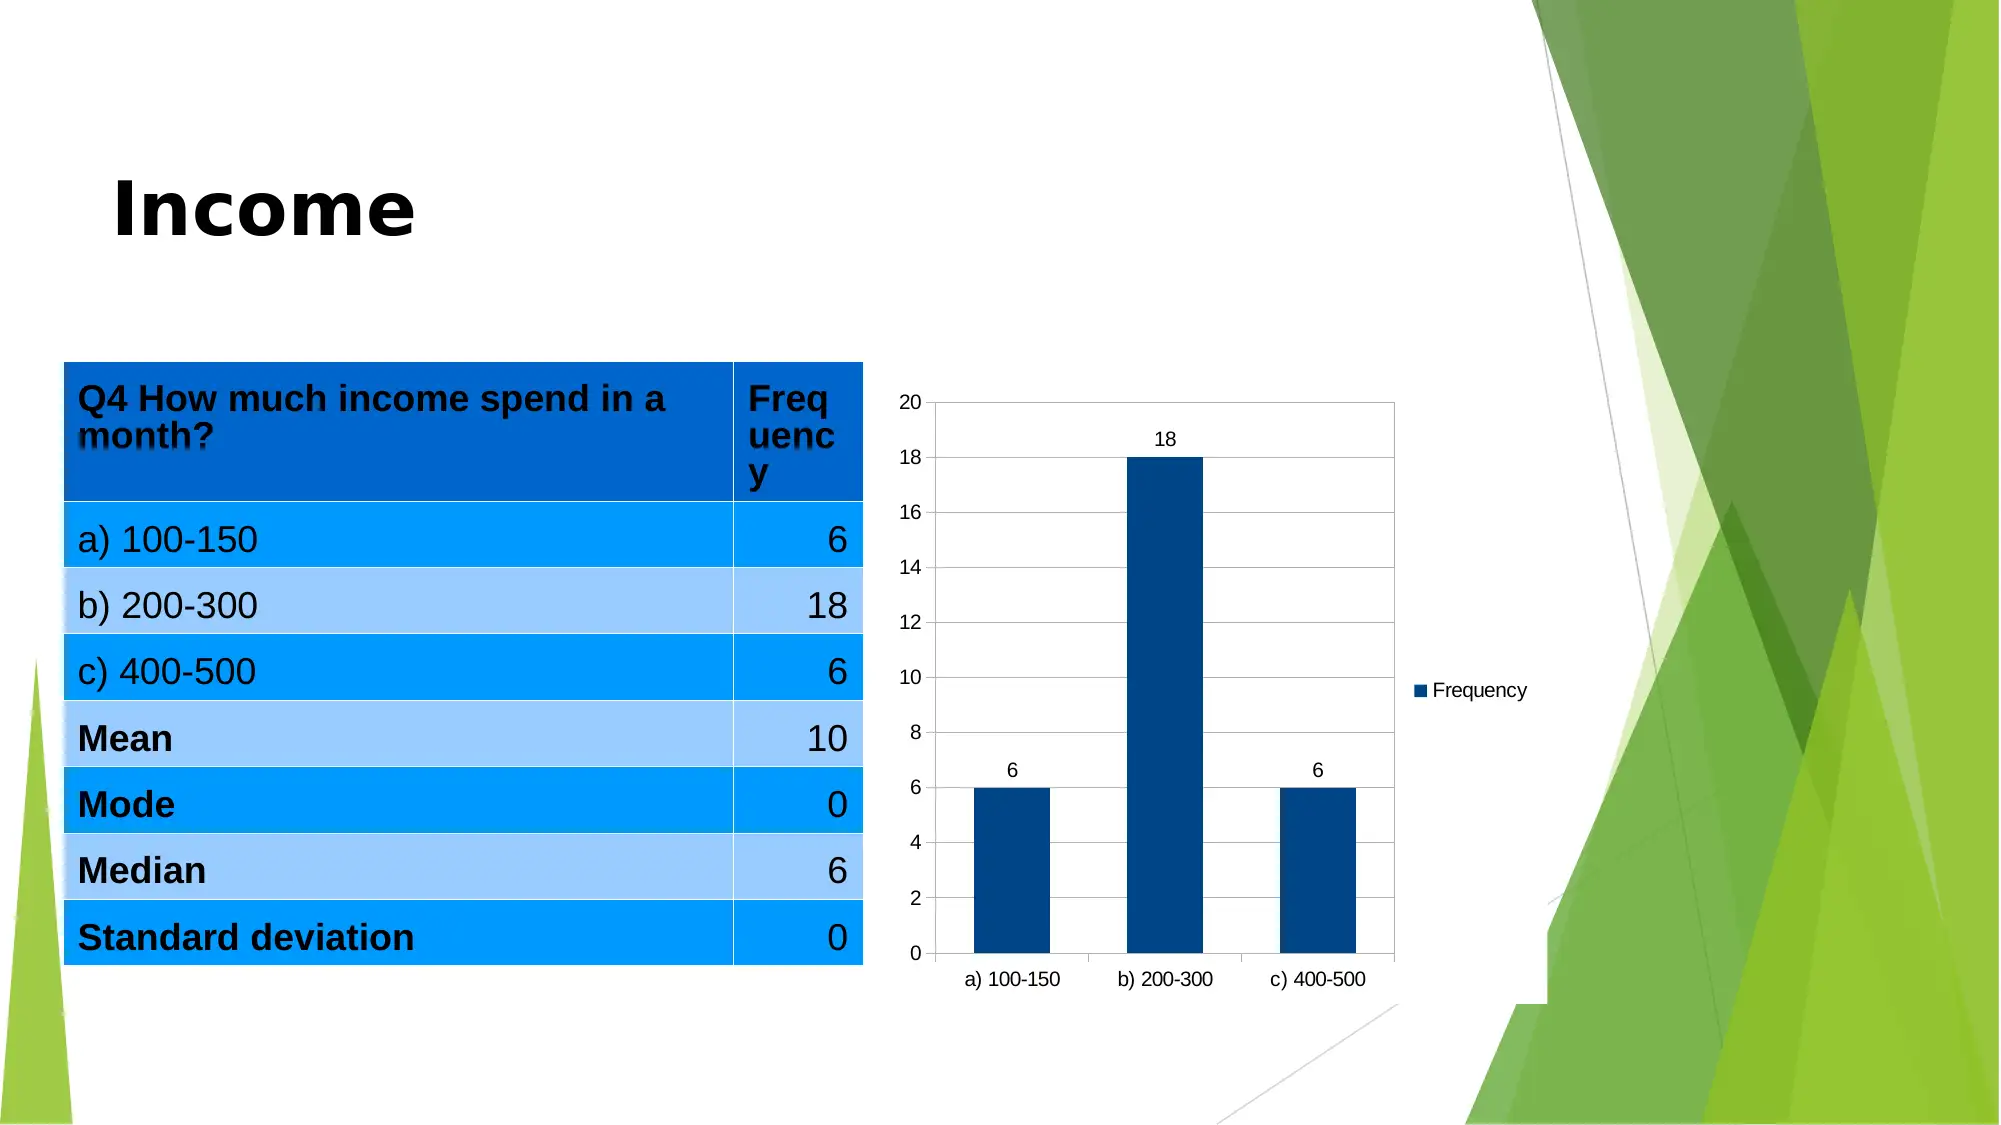
This report presents an analysis of primary data collected through surveys to evaluate various aspects of Poundland, a British variety chain store. The research investigates customer demographics, including age, gender, education, and income, to understand their purchasing behavior. The study explores customer perceptions of key factors such as location, product pricing, discounts, and the store's alignment with current market trends. Furthermore, it examines customer preferences related to product range, variety, online sales, and service changes, along with their opinions on store ambiance, home delivery, and space. The analysis aims to provide insights into customer satisfaction, identify areas for improvement, and assess Poundland's market position relative to competitors like B&M and Home Bargains, ultimately informing business decisions and strategies.
Document Page
Business Decision Making
tabler-icon-diamond-filled.svg

Paraphrase This Document

Need a fresh take? Get an instant paraphrase of this document with our AI Paraphraser
Document Page
Primary Data Analysis
Q1. In which type age group
belongs to you? Frequen
cy
a) 18-26 5
b) 27-40 15
c) 41-65 10
Mean 10
Mode 5
Median 10
Standard deviation 3.5355
a) 18-26 b) 27-40 c) 41-65
0
2
4
6
8
10
12
14
16
5
15
10
Frequency
Document Page
Gender
Q2. What is your gender? Freque
ncy
a) Male 7
b) Female 17
c) Other 4
Mean 9.33333
33333
Mode 3
Median 7
Standard deviation 2.1213
a) Male b) Female c) Other
0
2
4
6
8
10
12
14
16
18
7
17
4
Frequency
Document Page
Education Attainment
Q3. Tell me about your education
attainment? Frequ
ency
a) Primary 5
b) Secondary 5
c) University 20
Mean 10
Mode 5
Median 5
Standard deviation 10.606
6 a) Primary b) Secondary c) University
0
5
10
15
20
25
5 5
20
Frequency
tabler-icon-diamond-filled.svg

Paraphrase This Document

Need a fresh take? Get an instant paraphrase of this document with our AI Paraphraser
Document Page
Income
Q4 How much income spend in a
month? Freq
uenc
y
a) 100-150 6
b) 200-300 18
c) 400-500 6
Mean 10
Mode 0
Median 6
Standard deviation 0 a) 100-150 b) 200-300 c) 400-500
0
2
4
6
8
10
12
14
16
18
20
6
18
6
Frequency
Document Page
Monthly Income
Q5 What is your monthly
income? Freq
uenc
y
a) 700-1000 8
b) 1500-3000 15
c) 4000-5000 7
Mean 10
Mode 1
Median 8
Standard deviation 0.707
1 a) 700-1000 b) 1500-3000 c) 4000-5000
0
2
4
6
8
10
12
14
16
8
15
7 Frequency
Document Page
Location
Q6. According to you, a location
important factor to open new retail
store of Poundland?
Freq
uen
cy
a) Strongly agree 15
b) Agree 8
c) Disagree 7
Mean 10
Mode 1
Median 8
Standard deviation 5.65
68 a) Strongly agree b) Agree c) Disagree
0
2
4
6
8
10
12
14
16 15
8
7 Frequency
tabler-icon-diamond-filled.svg

Paraphrase This Document

Need a fresh take? Get an instant paraphrase of this document with our AI Paraphraser
Document Page
Price of Product
Q7. The price of product keep
satisfactory by Poundland in their
store?
Freq
uenc
y
a) Strongly agree 17
b) Agree 7
c) Disagree 4
Mean 9.333
3333
333
Mode 1
Median 7
Standard deviation 9.192
3
a) Strongly agree b) Agree c) Disagree
0
2
4
6
8
10
12
14
16
18 17
7
4
Frequency
Document Page
Discount
Q8. Is company provide discount on
specific festival ? Freq
uenc
y
a) Strongly agree 10
b) Agree 15
c) Disagree 5
Mean 10
Mode 0
Median 10
Standard deviation 3.53
55 a) Strongly agree b) Agree c) Disagree
0
2
4
6
8
10
12
14
16
10
15
5
Frequency
Document Page
Current Trend
Q9. Is the store follow the style as
per the current market? Freq
uenc
y
a) Strongly agree 8
b) Agree 15
c) Disagree 7
Mean 10
Mode 1
Median 8
Standard deviation 0.70
71 a) Strongly agree b) Agree c) Disagree
0
2
4
6
8
10
12
14
16
8
15
7 Frequency
tabler-icon-diamond-filled.svg

Paraphrase This Document

Need a fresh take? Get an instant paraphrase of this document with our AI Paraphraser
Document Page
Convince
Q10 Pounland store agent
effectively convince to customer
for product purchase?
Freq
uenc
y
a) Strongly agree 6
b) Agree 18
c) Disagree 6
Mean 10
Mode 0
Median 6
Standard deviation 0 a) Strongly agree b) Agree c) Disagree
0
2
4
6
8
10
12
14
16
18
20
6
18
6
Frequency
Document Page
Sales
Q11 Do you think company
increase their sales in 2018
compare than to 2017?
a) Strongly agree 10
b) Agree 17
c) Disagree 4
Mean 10
Mode 1
Median 8
Standard deviation 0.7071 a) Strongly agree b) Agree c) Disagree
0
2
4
6
8
10
12
14
16
18
10
17
4
Series1
chevron_up_icon
1 out of 23
circle_padding
hide_on_mobile
zoom_out_icon
[object Object]