Power BI Assignment: Data Import, Visualizations, and Functions Review

Verified

Added on  2021/08/16

|38
|2190
|118
Practical Assignment
AI Summary
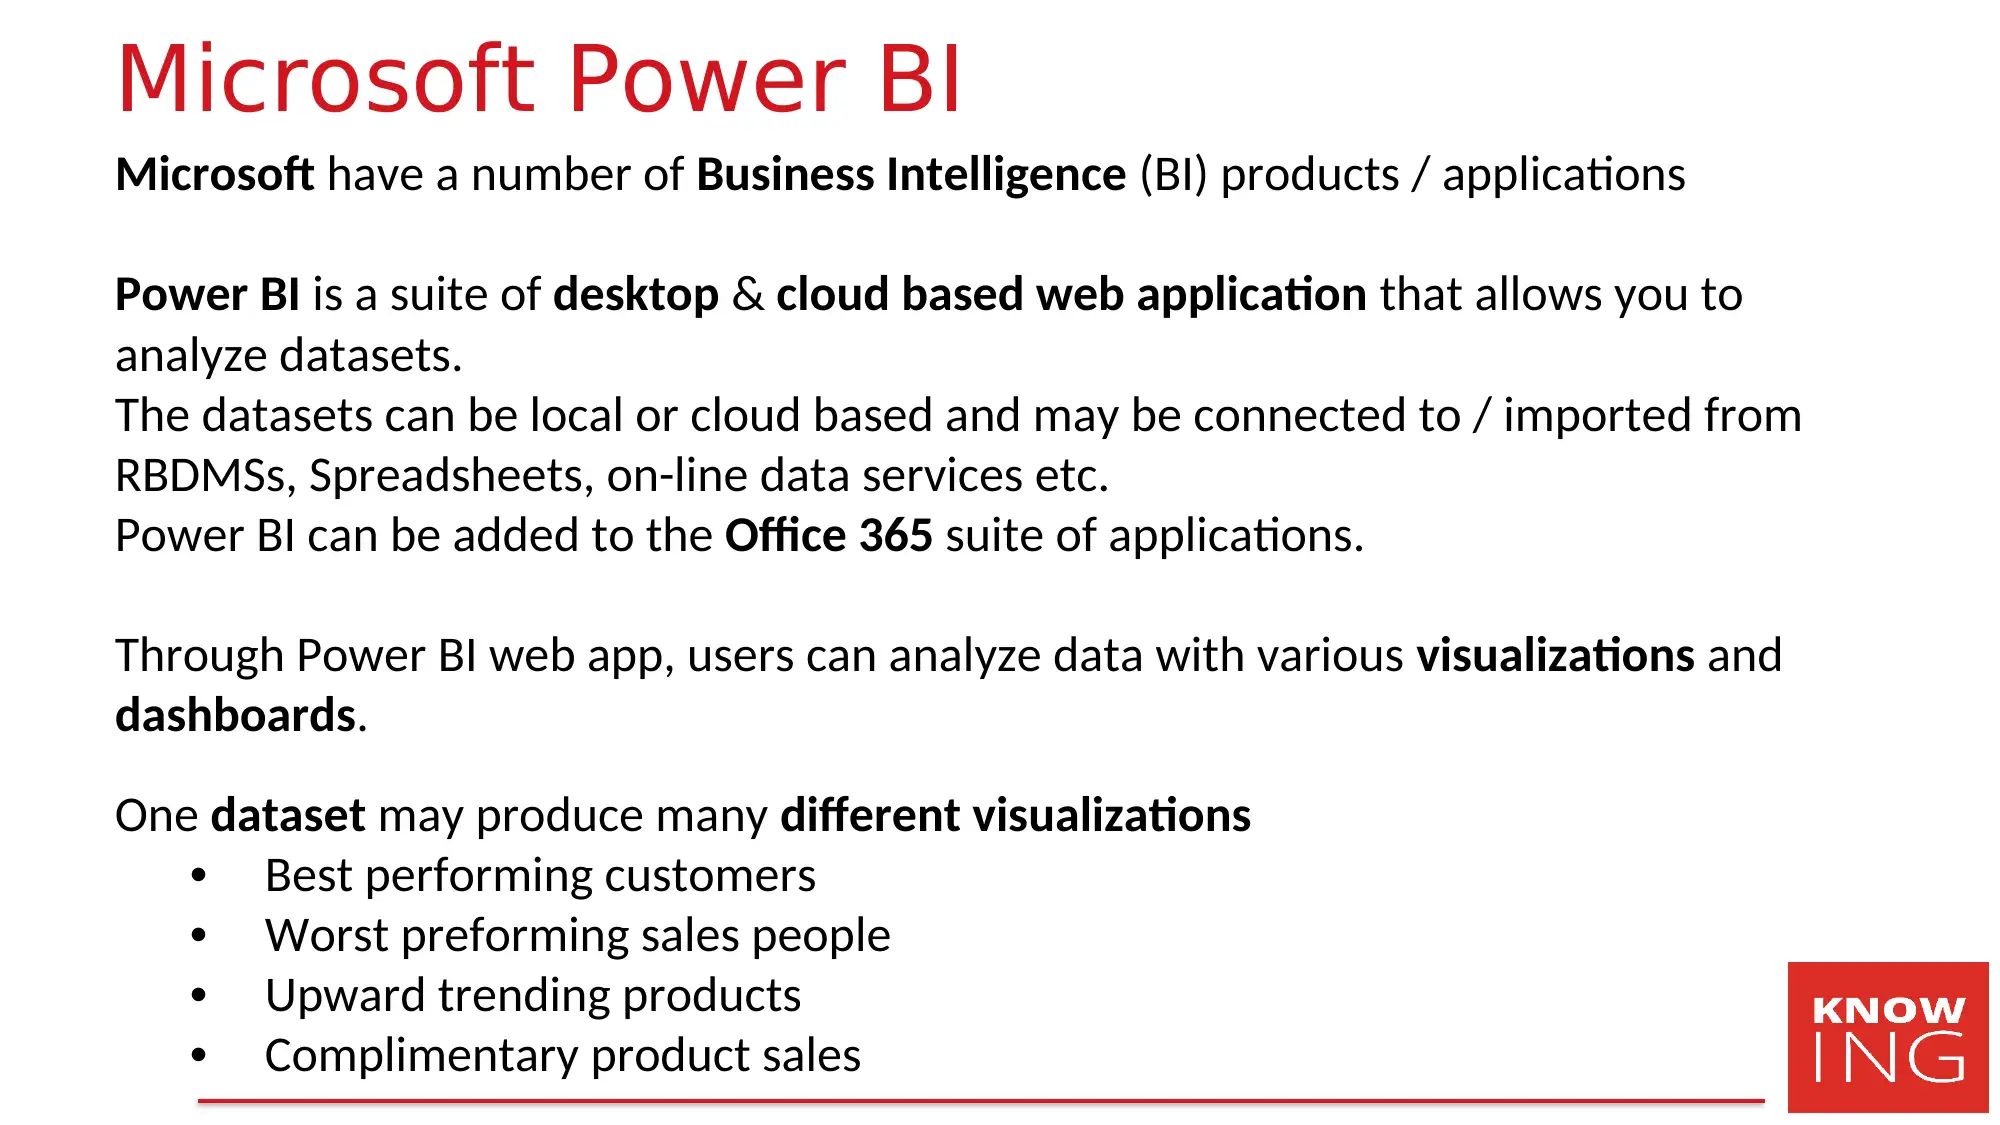
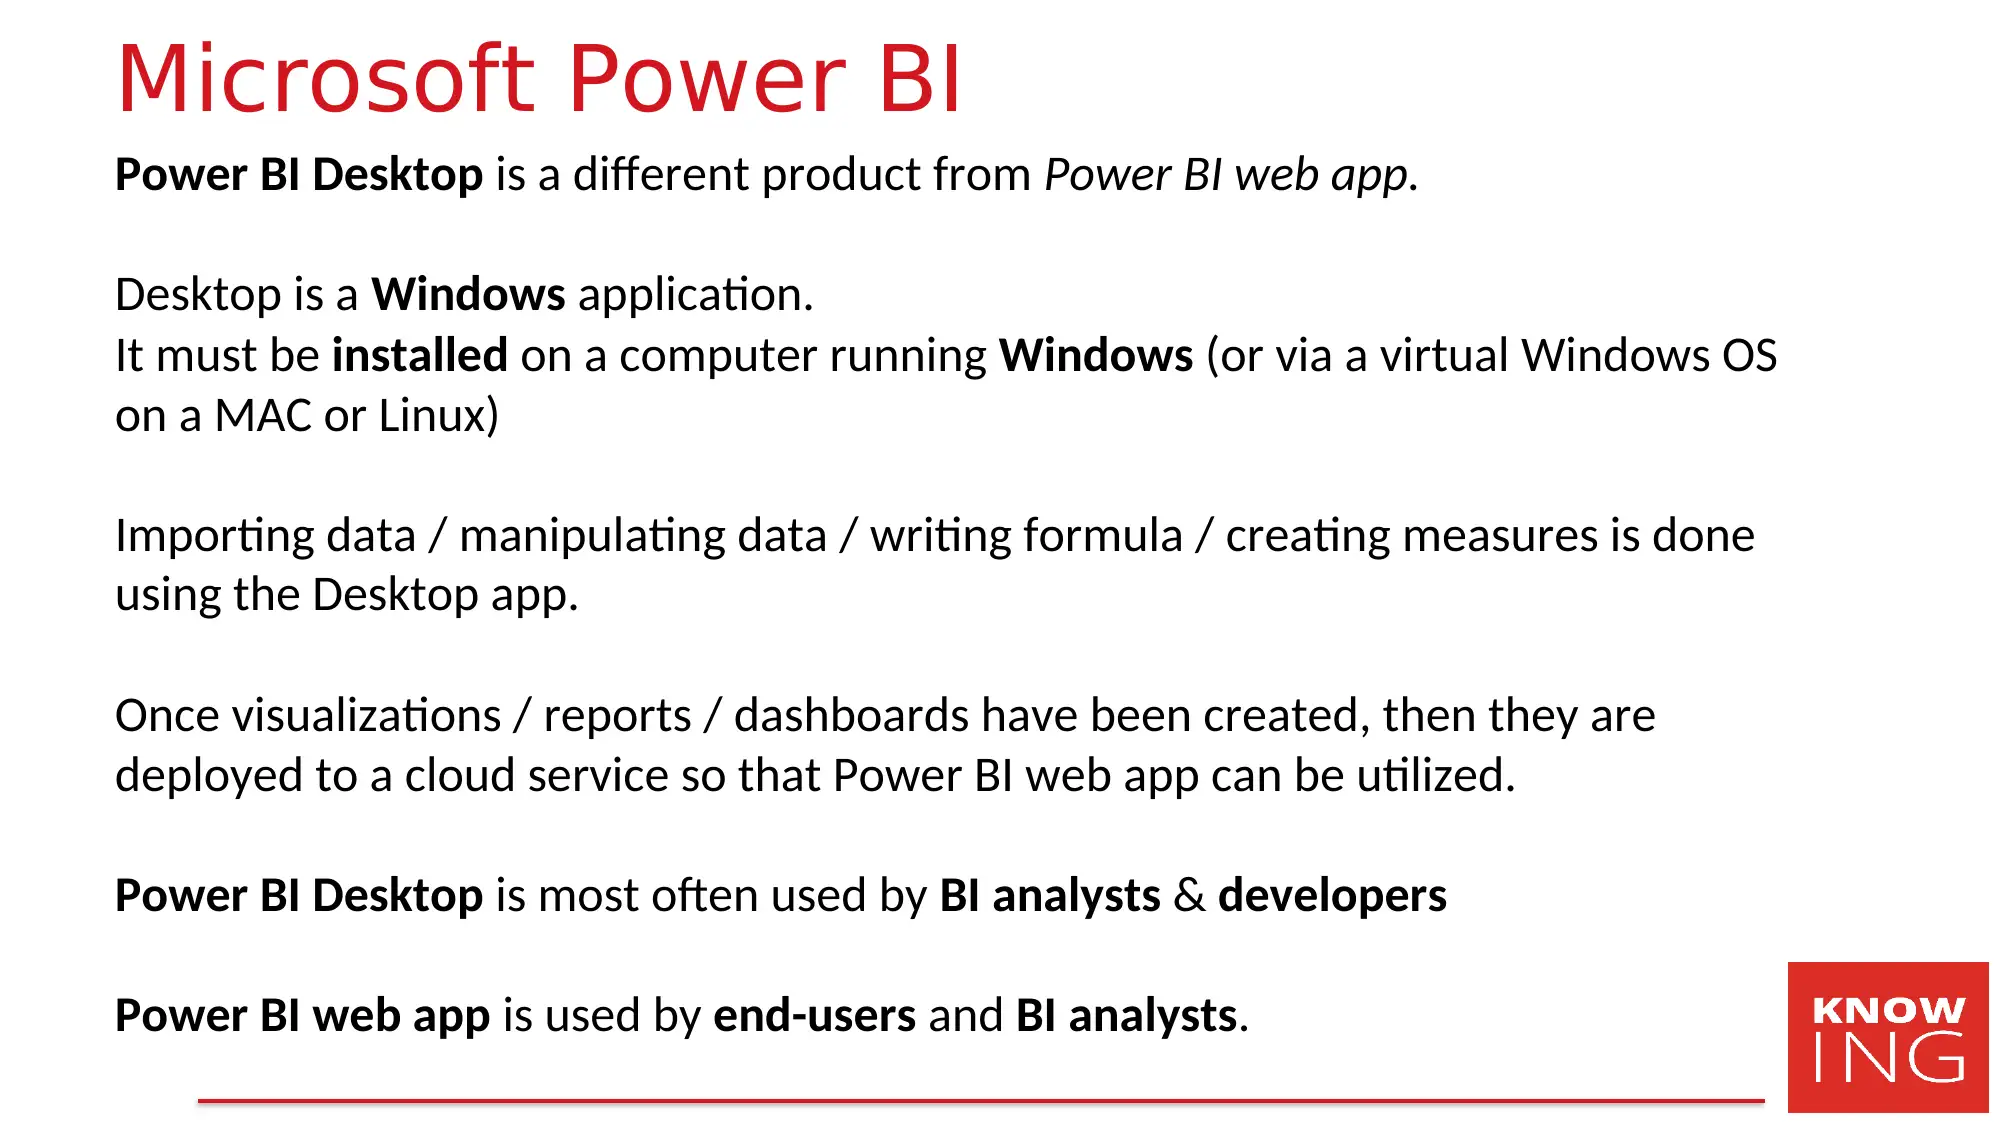
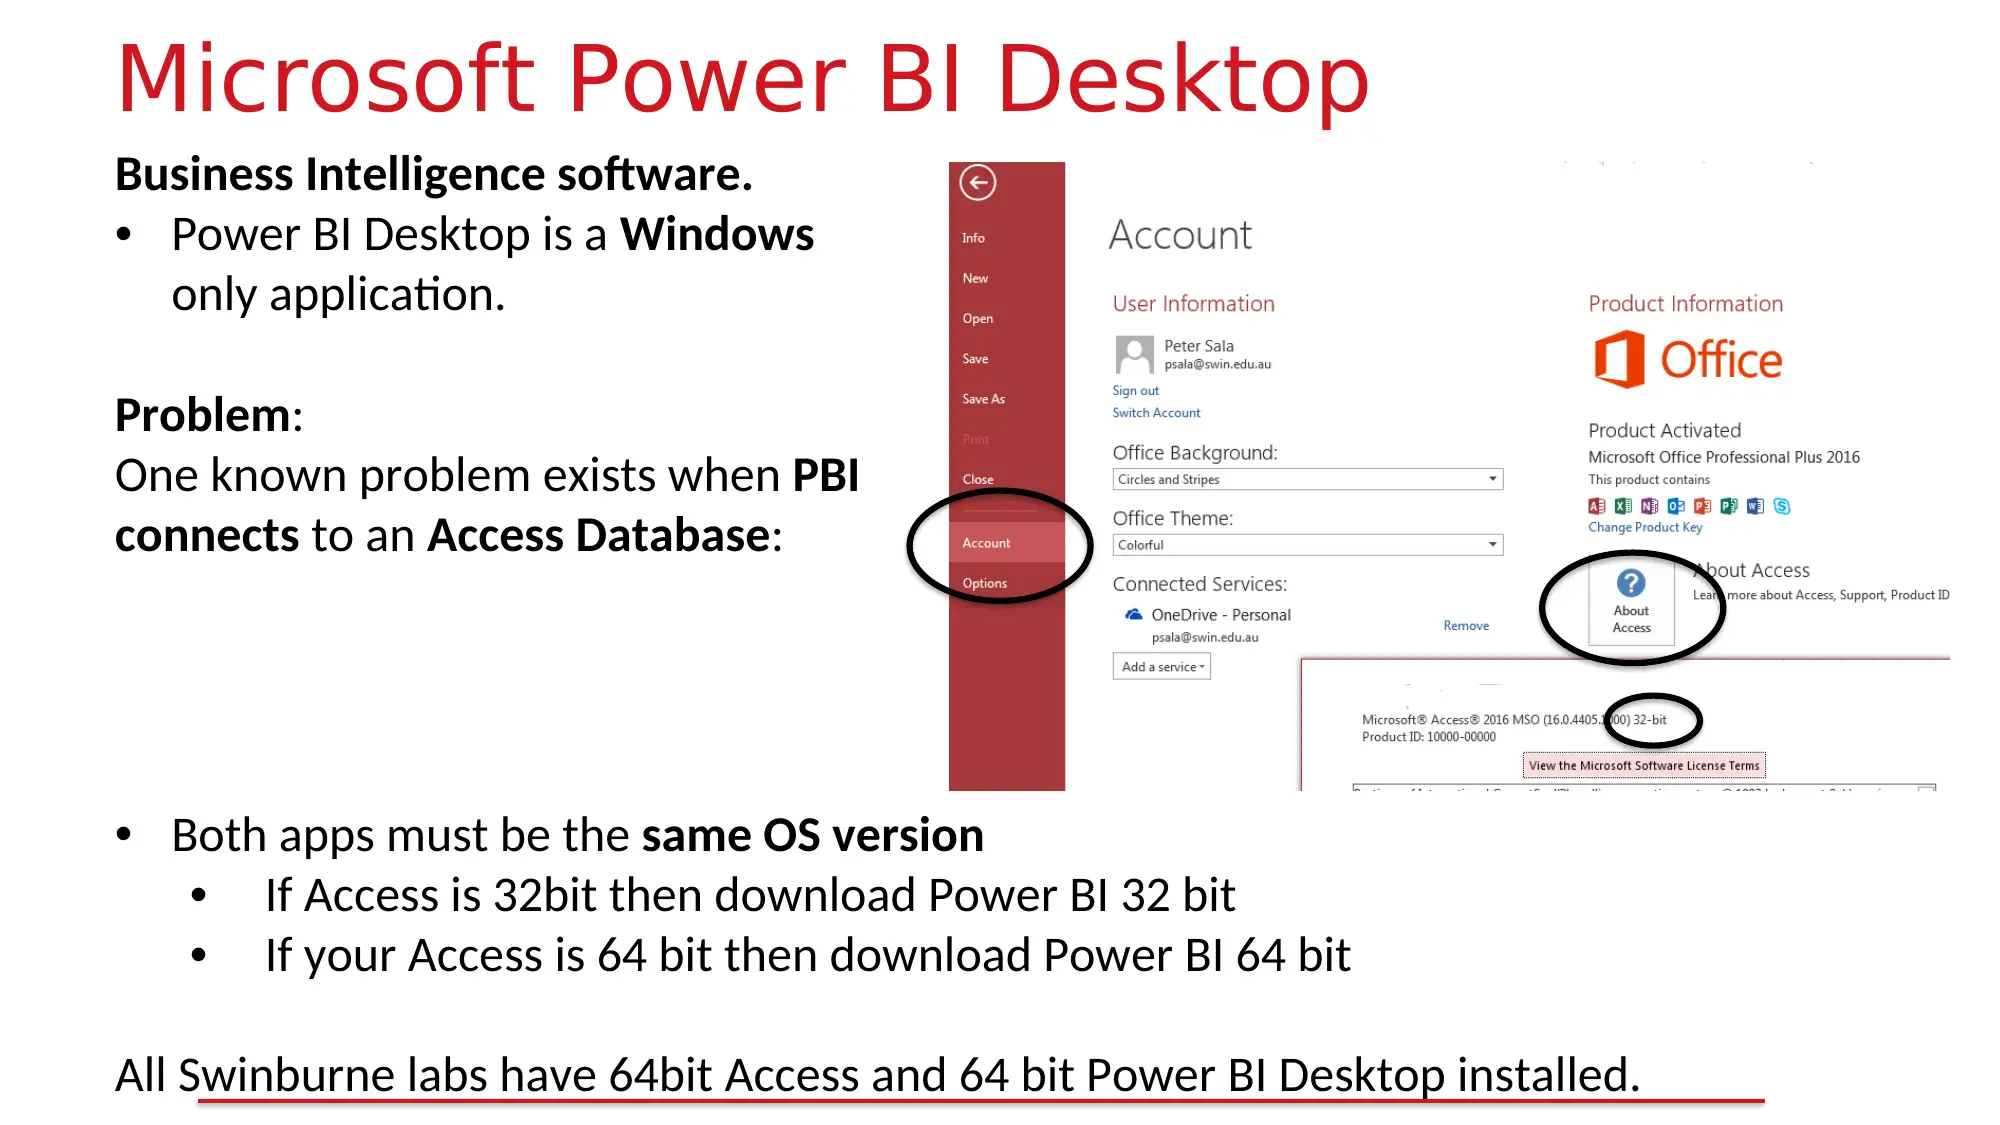
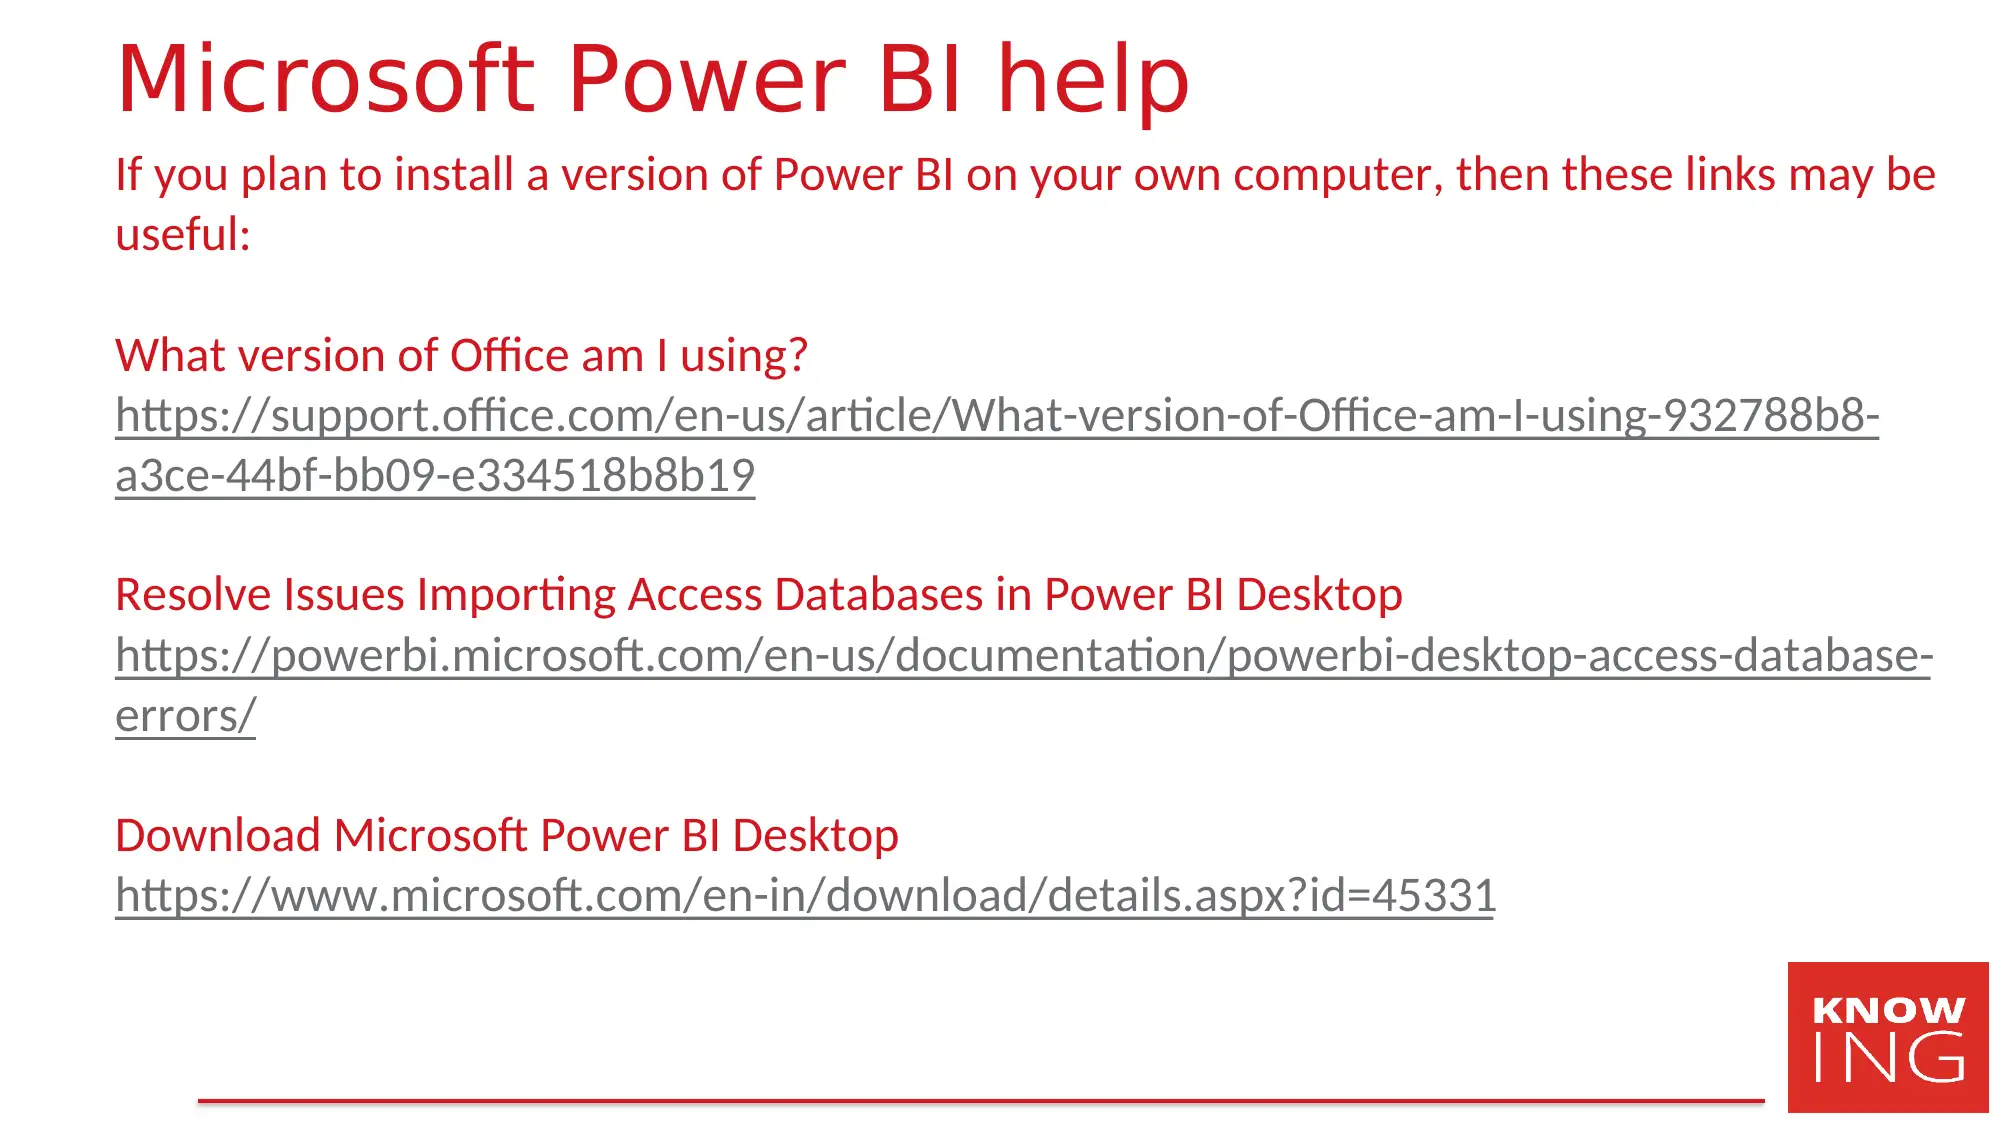
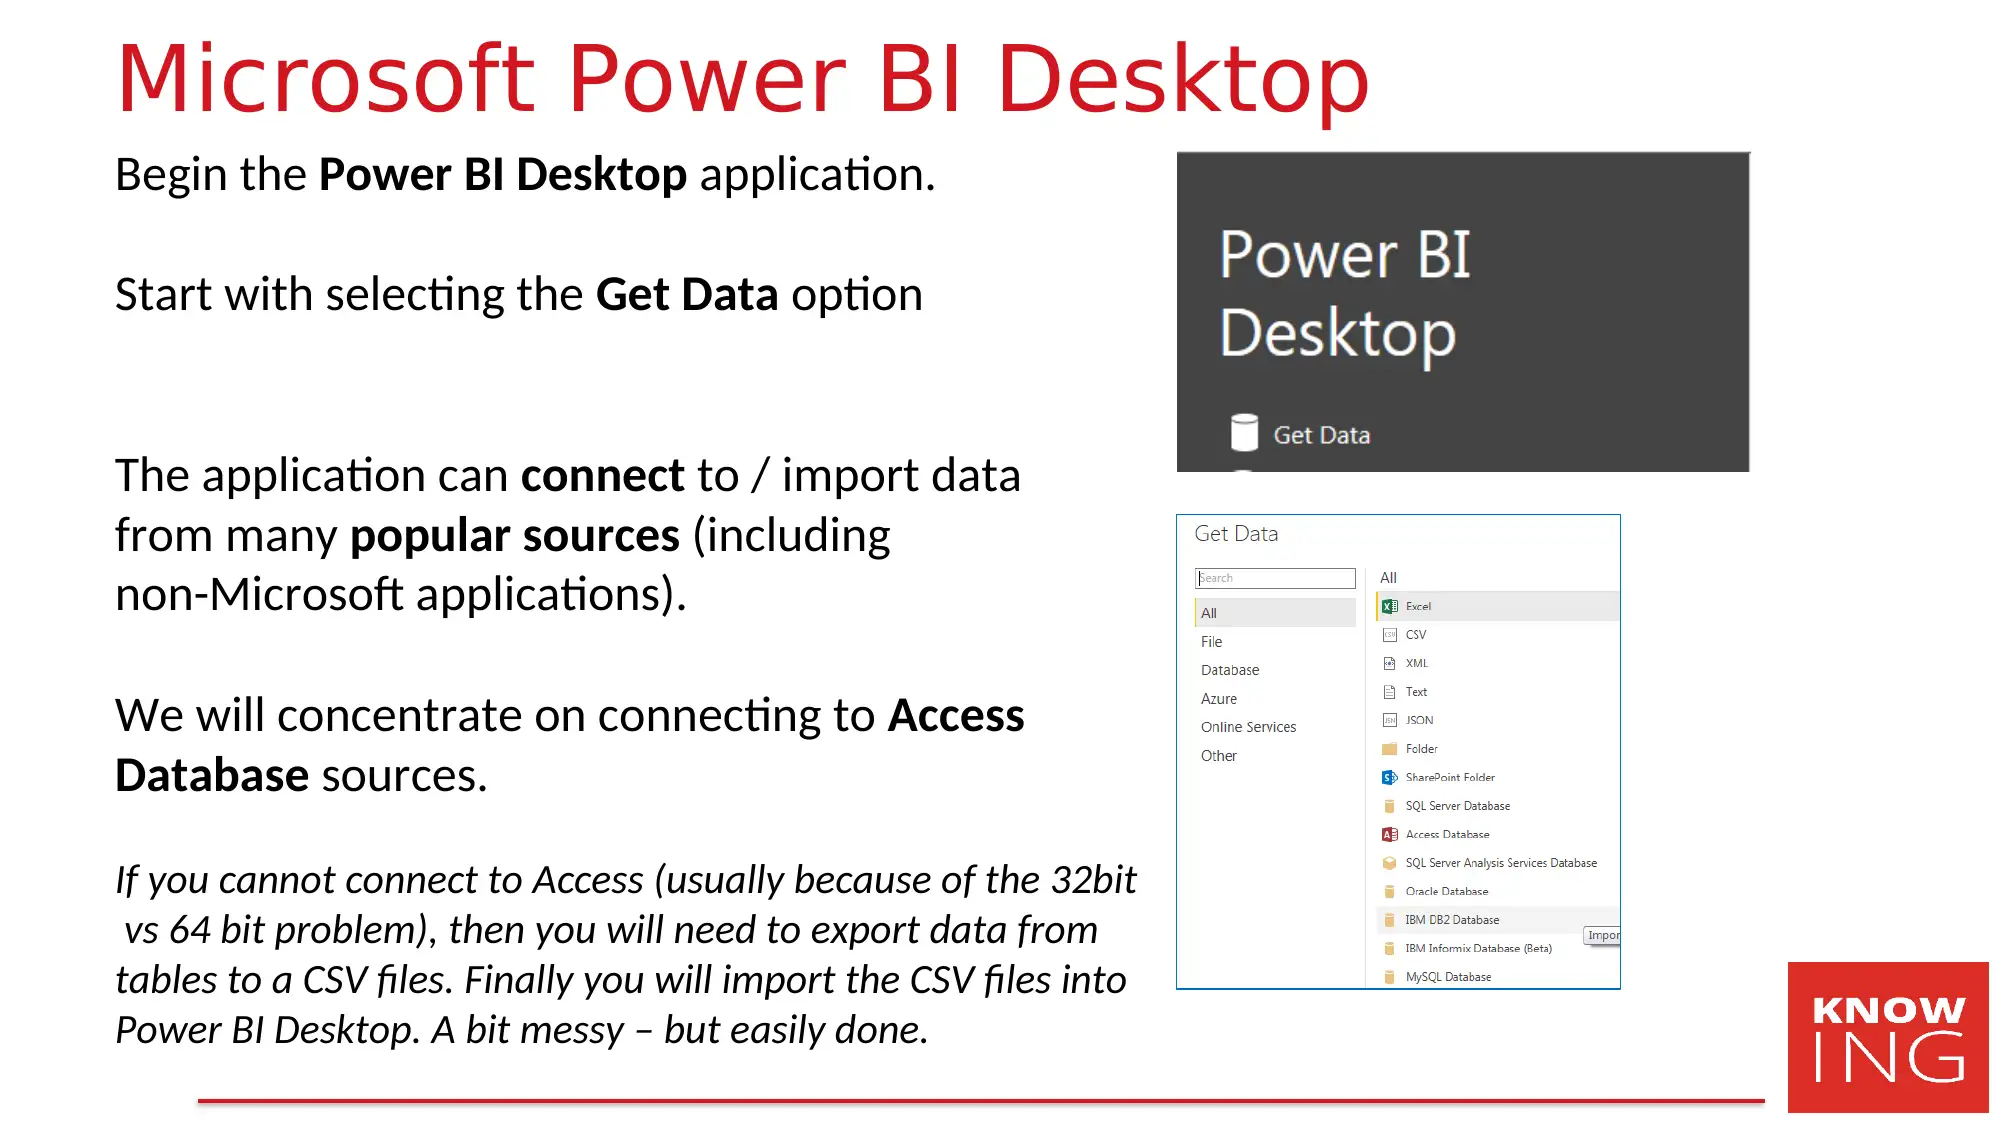
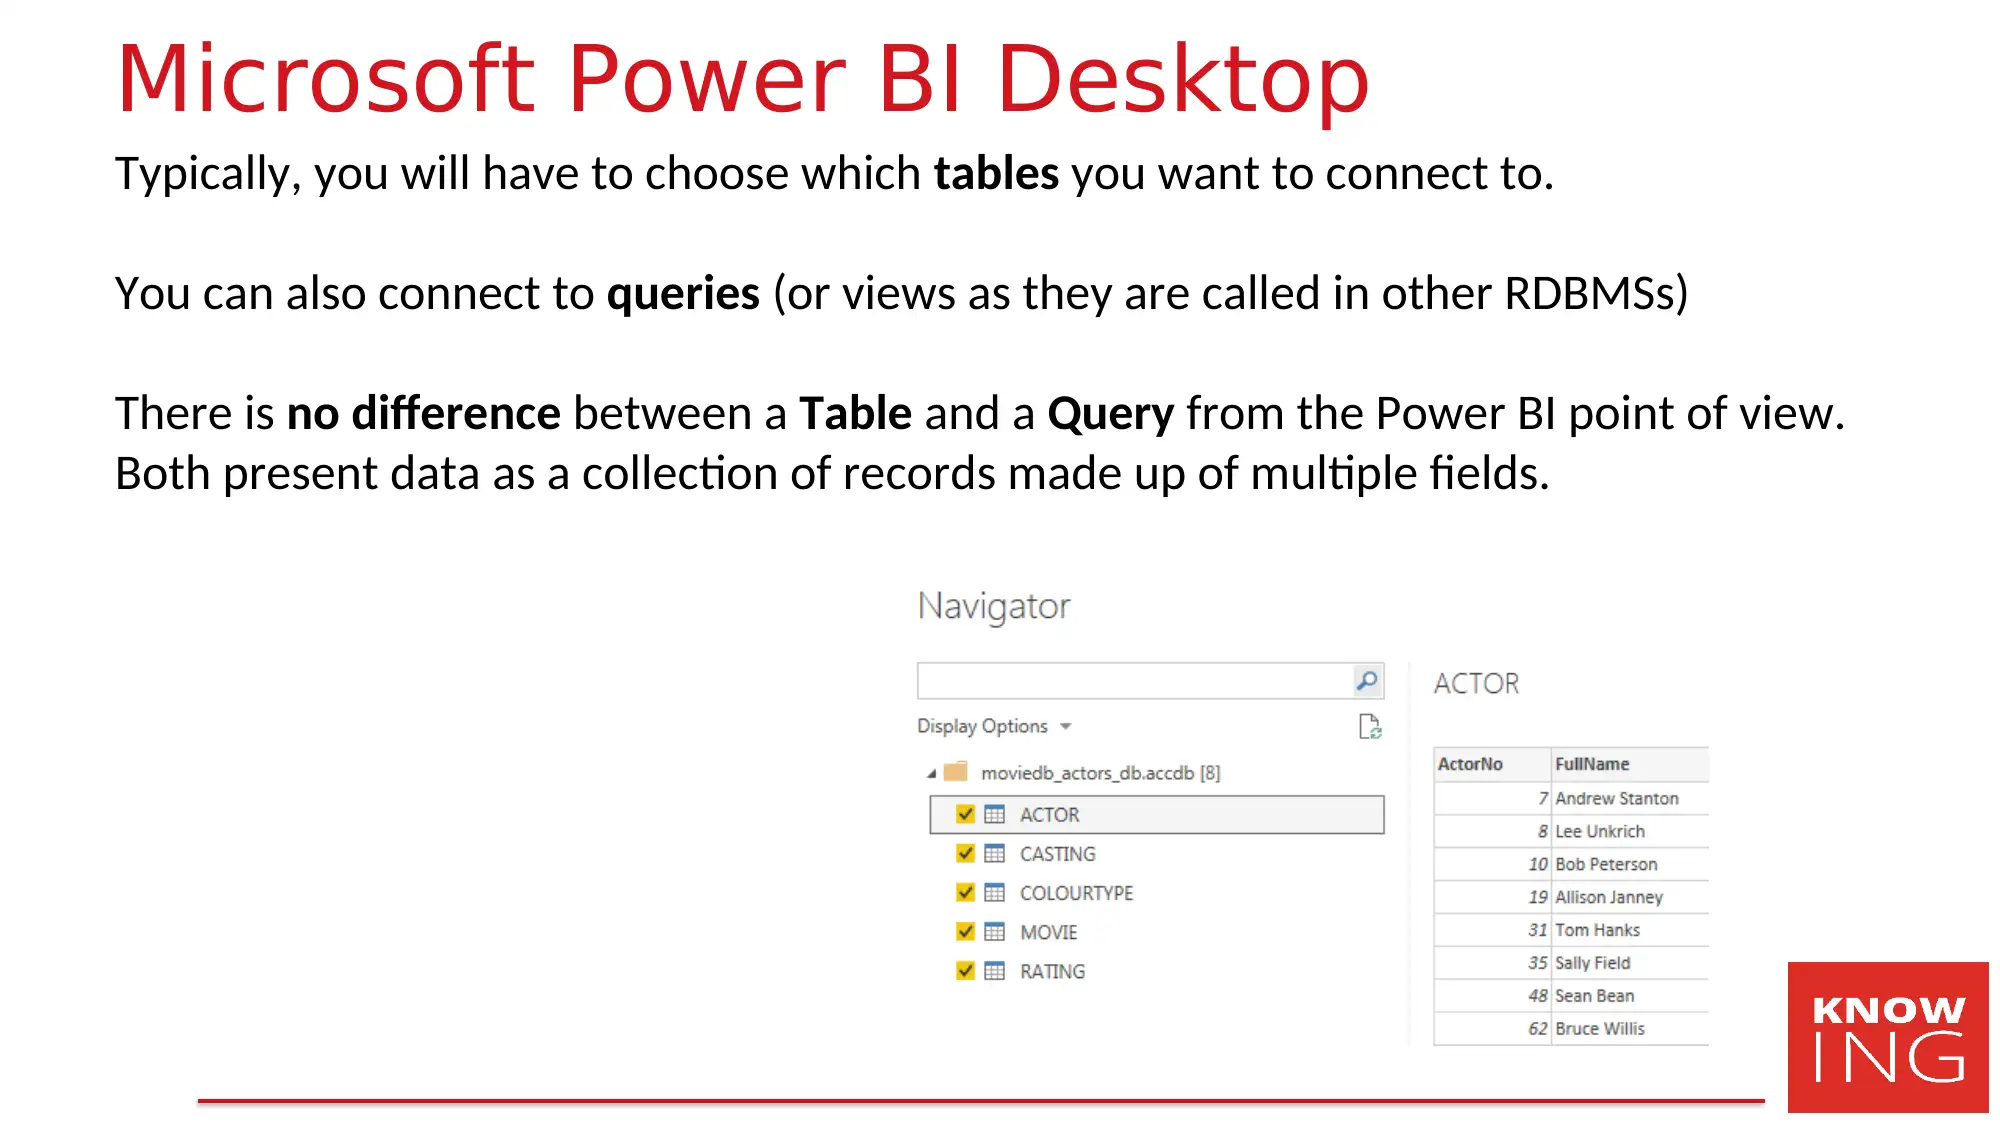
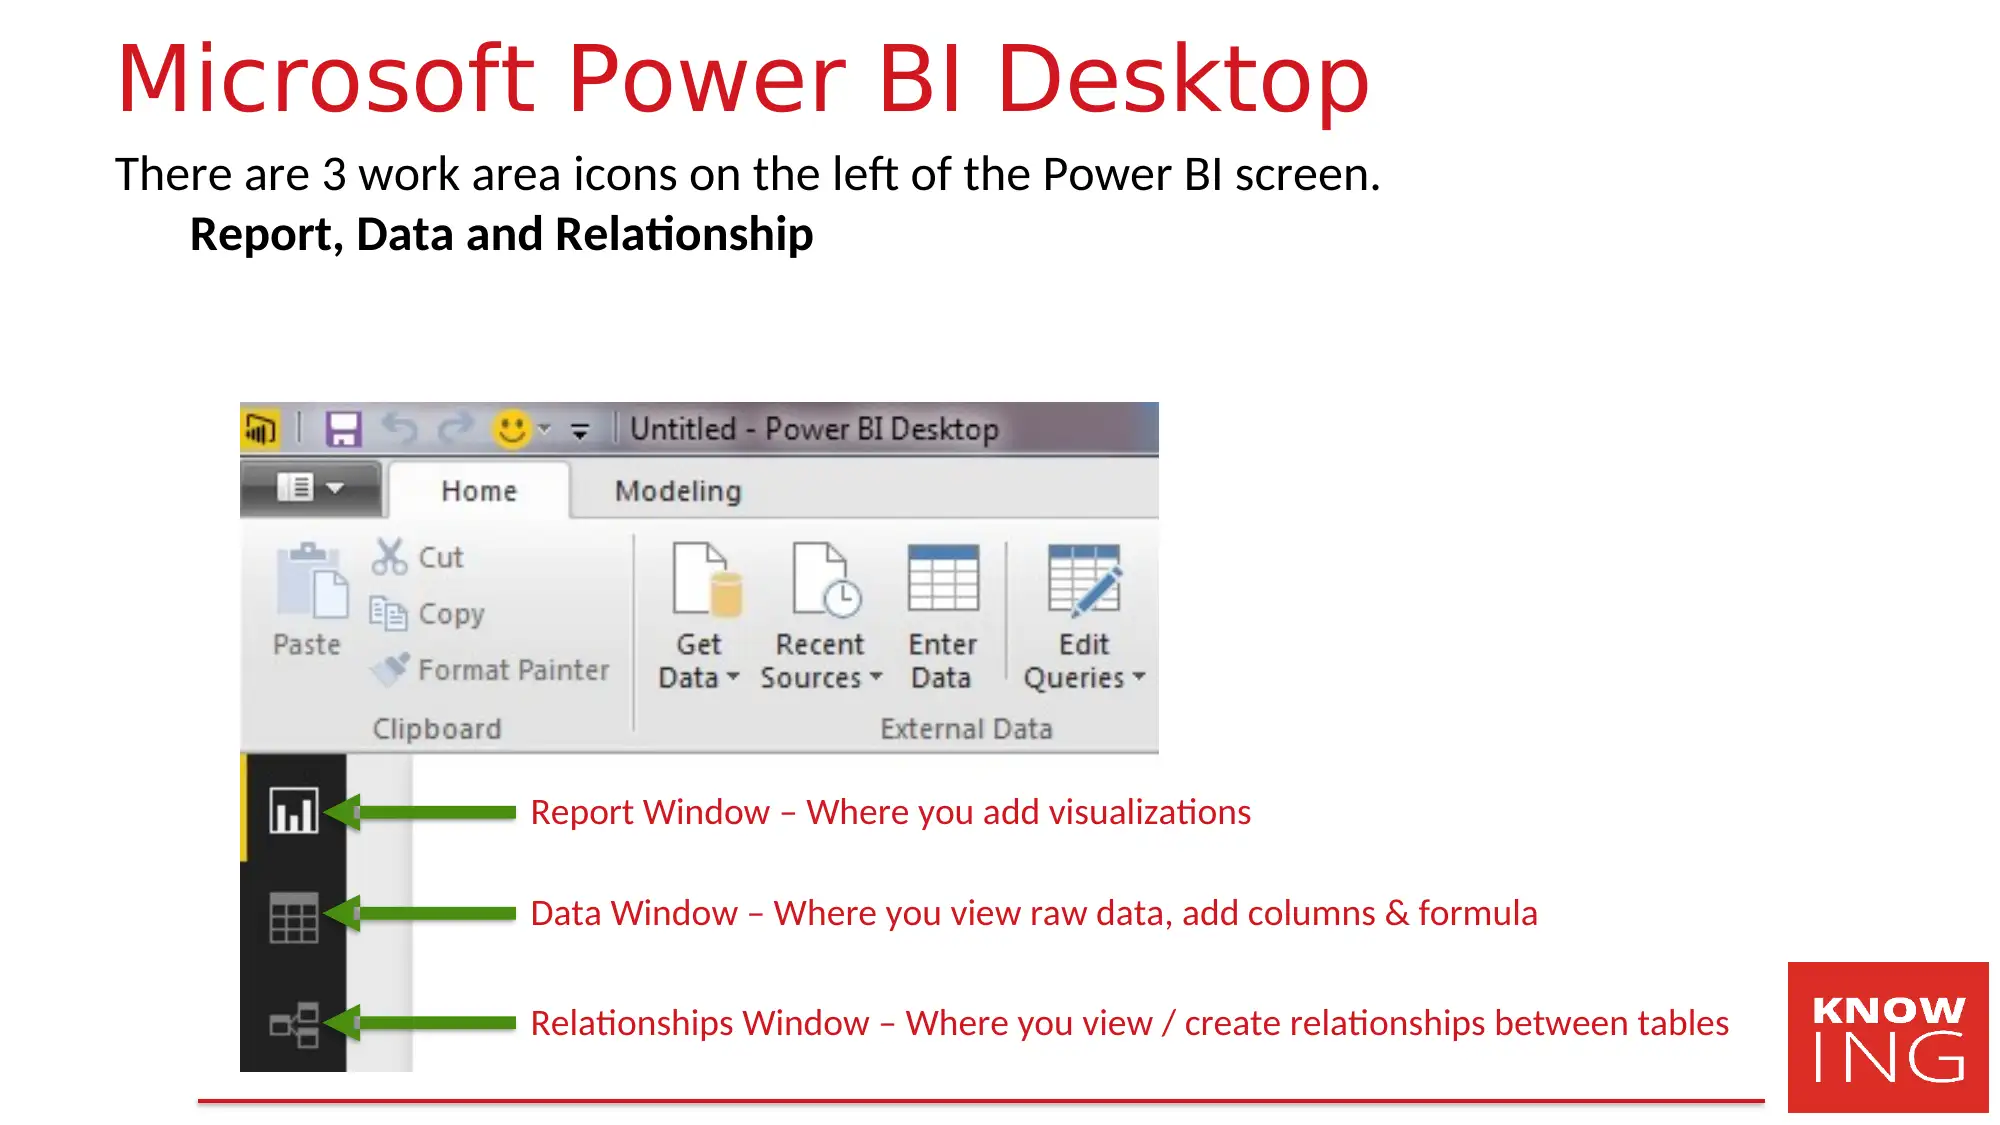
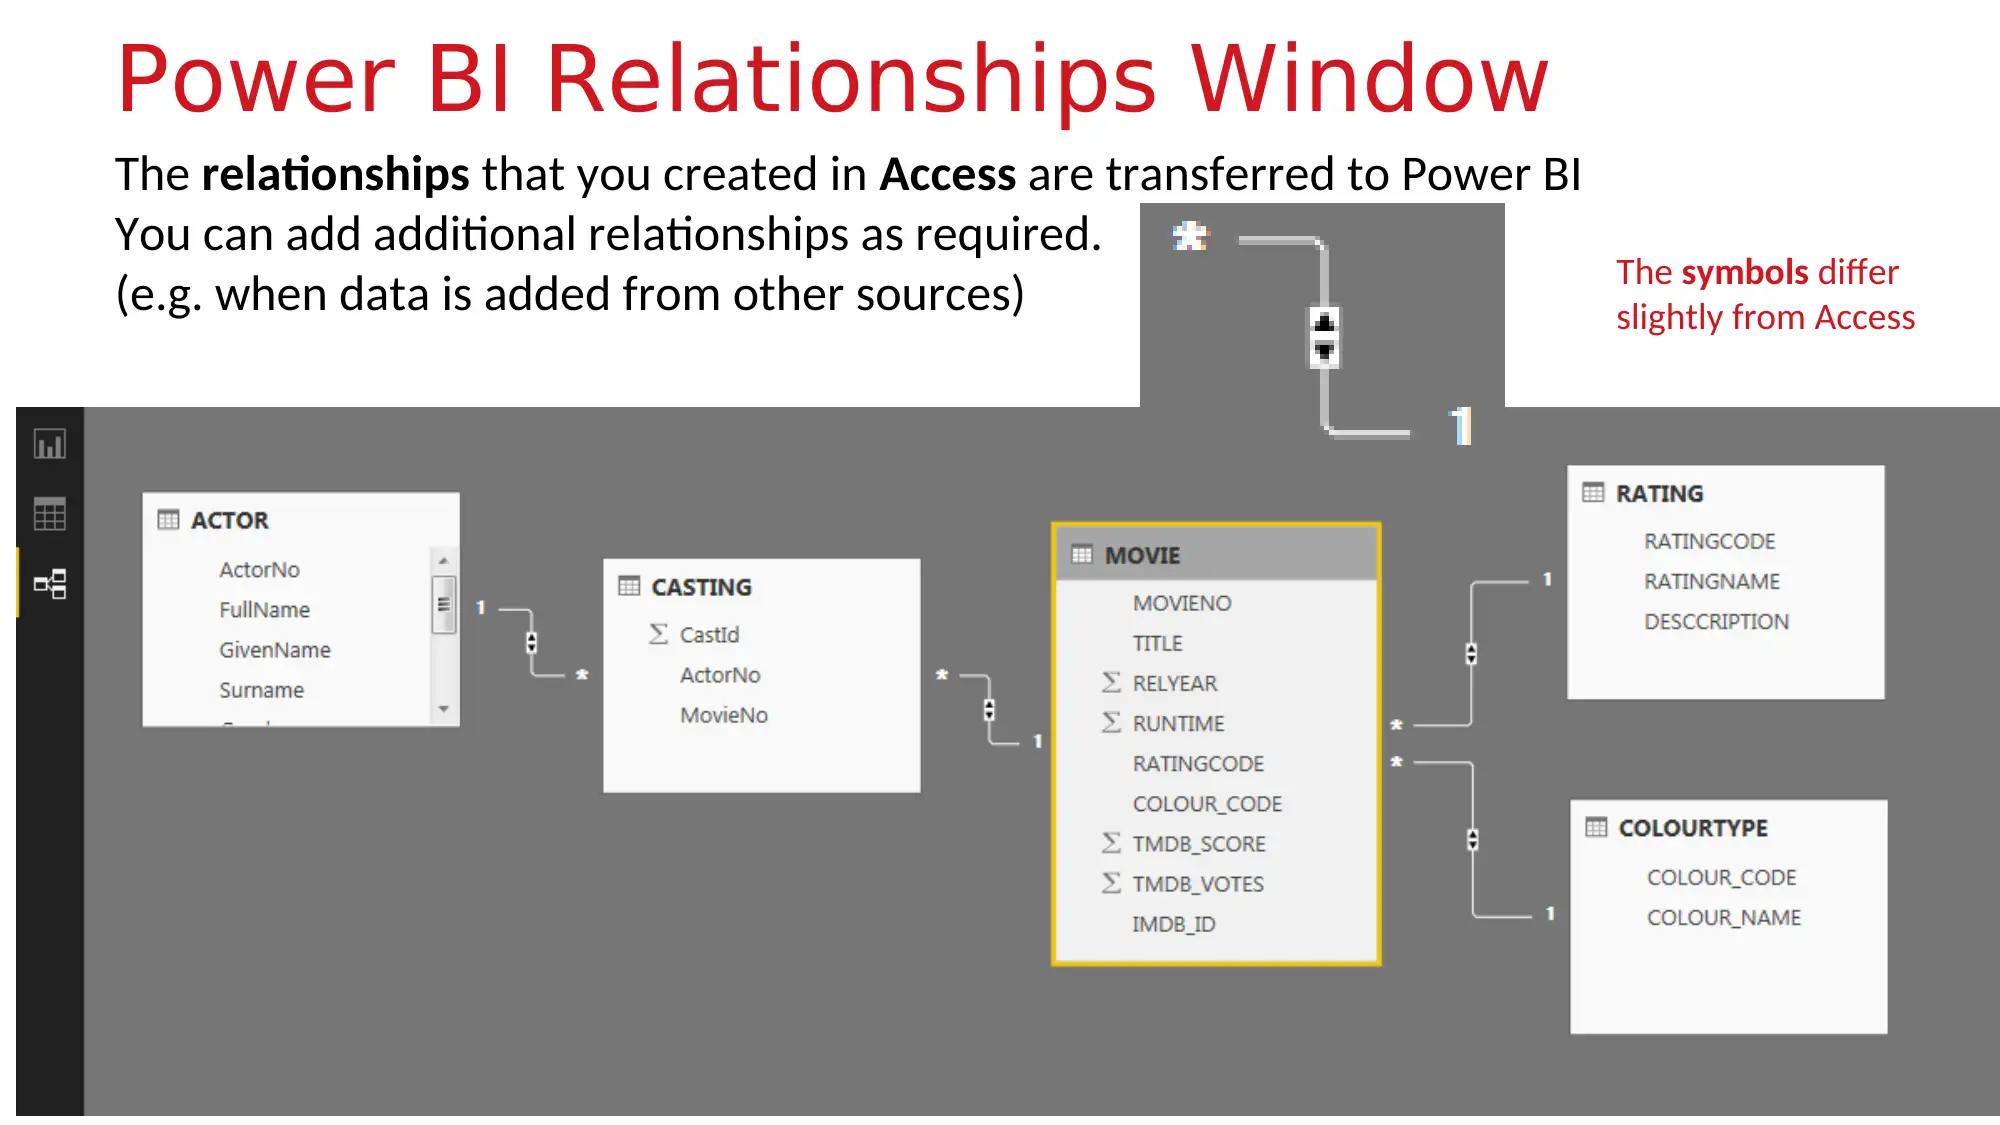
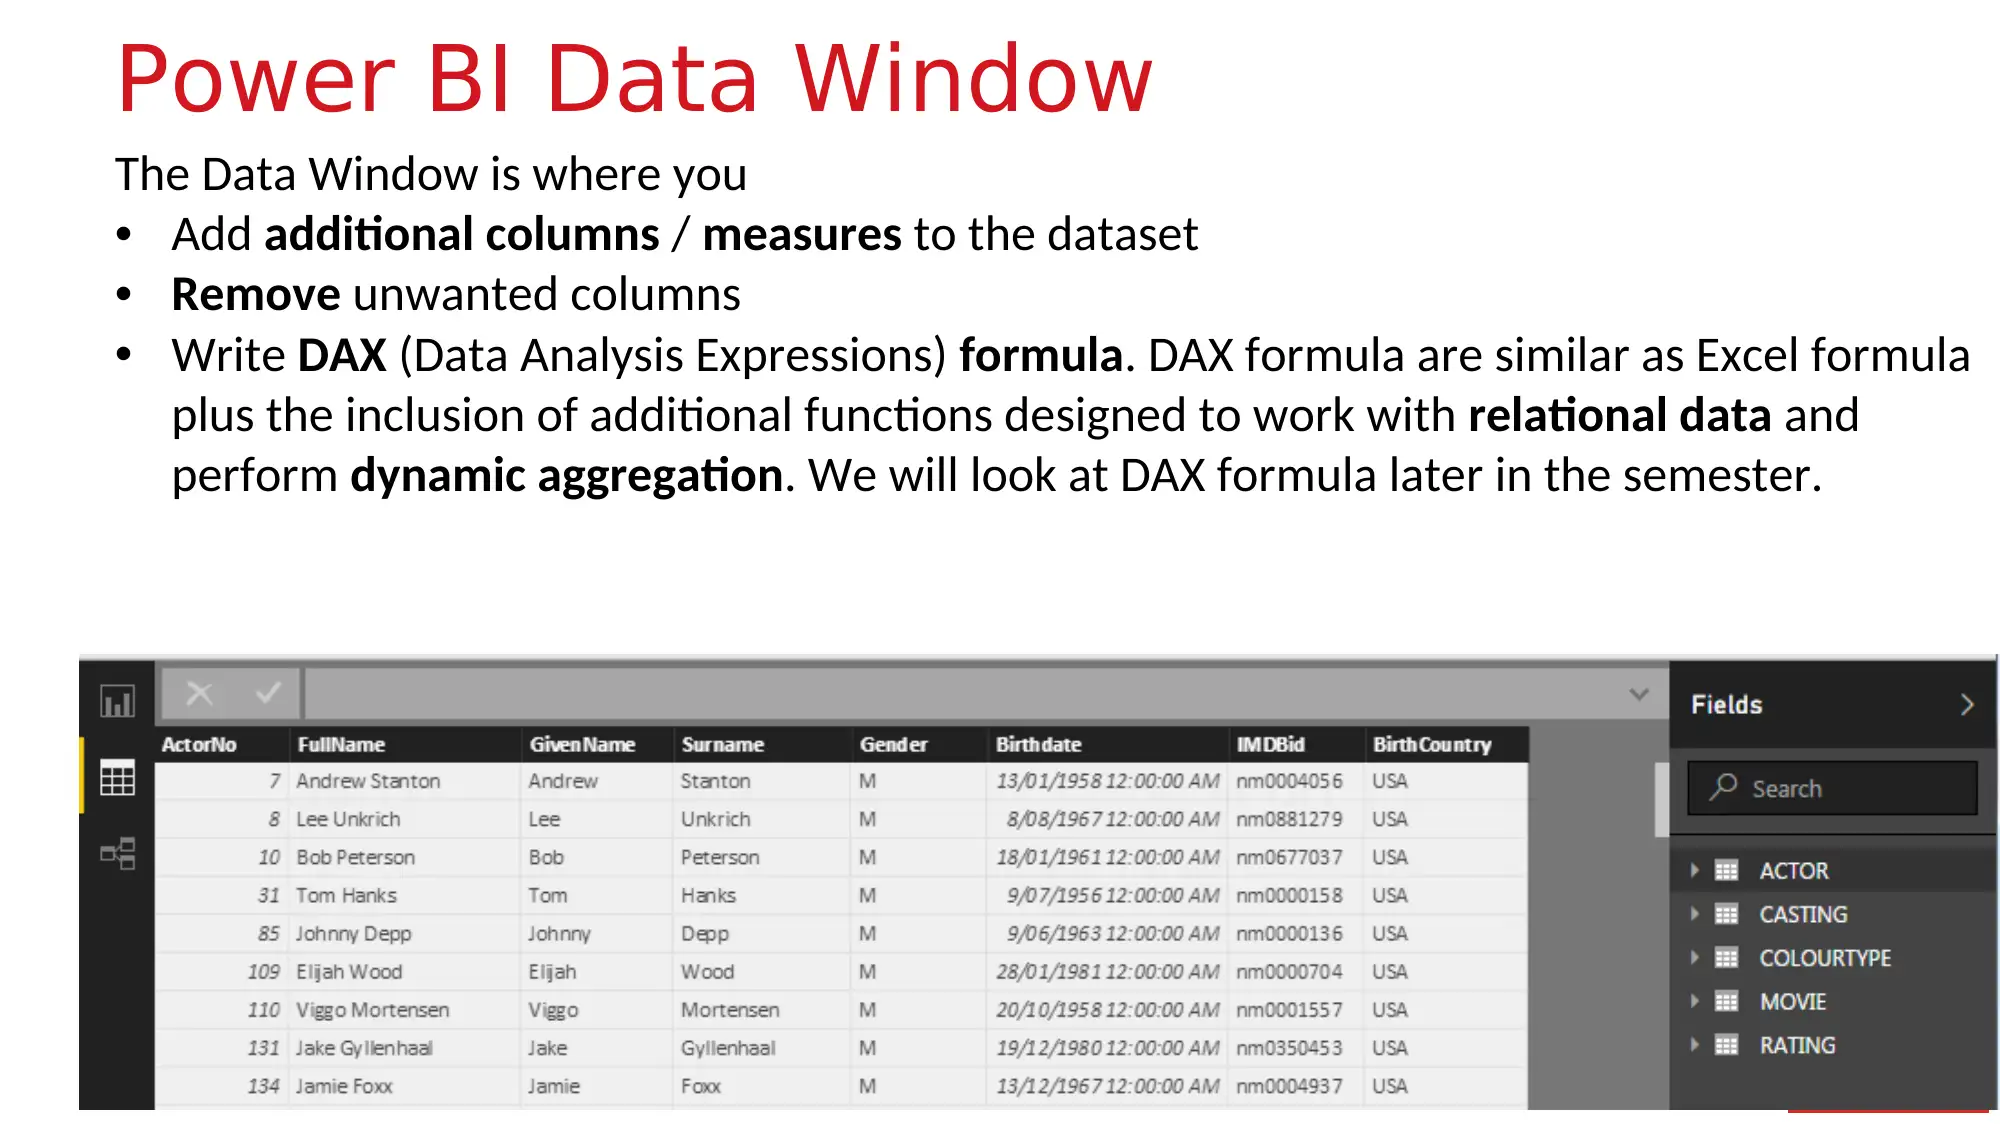
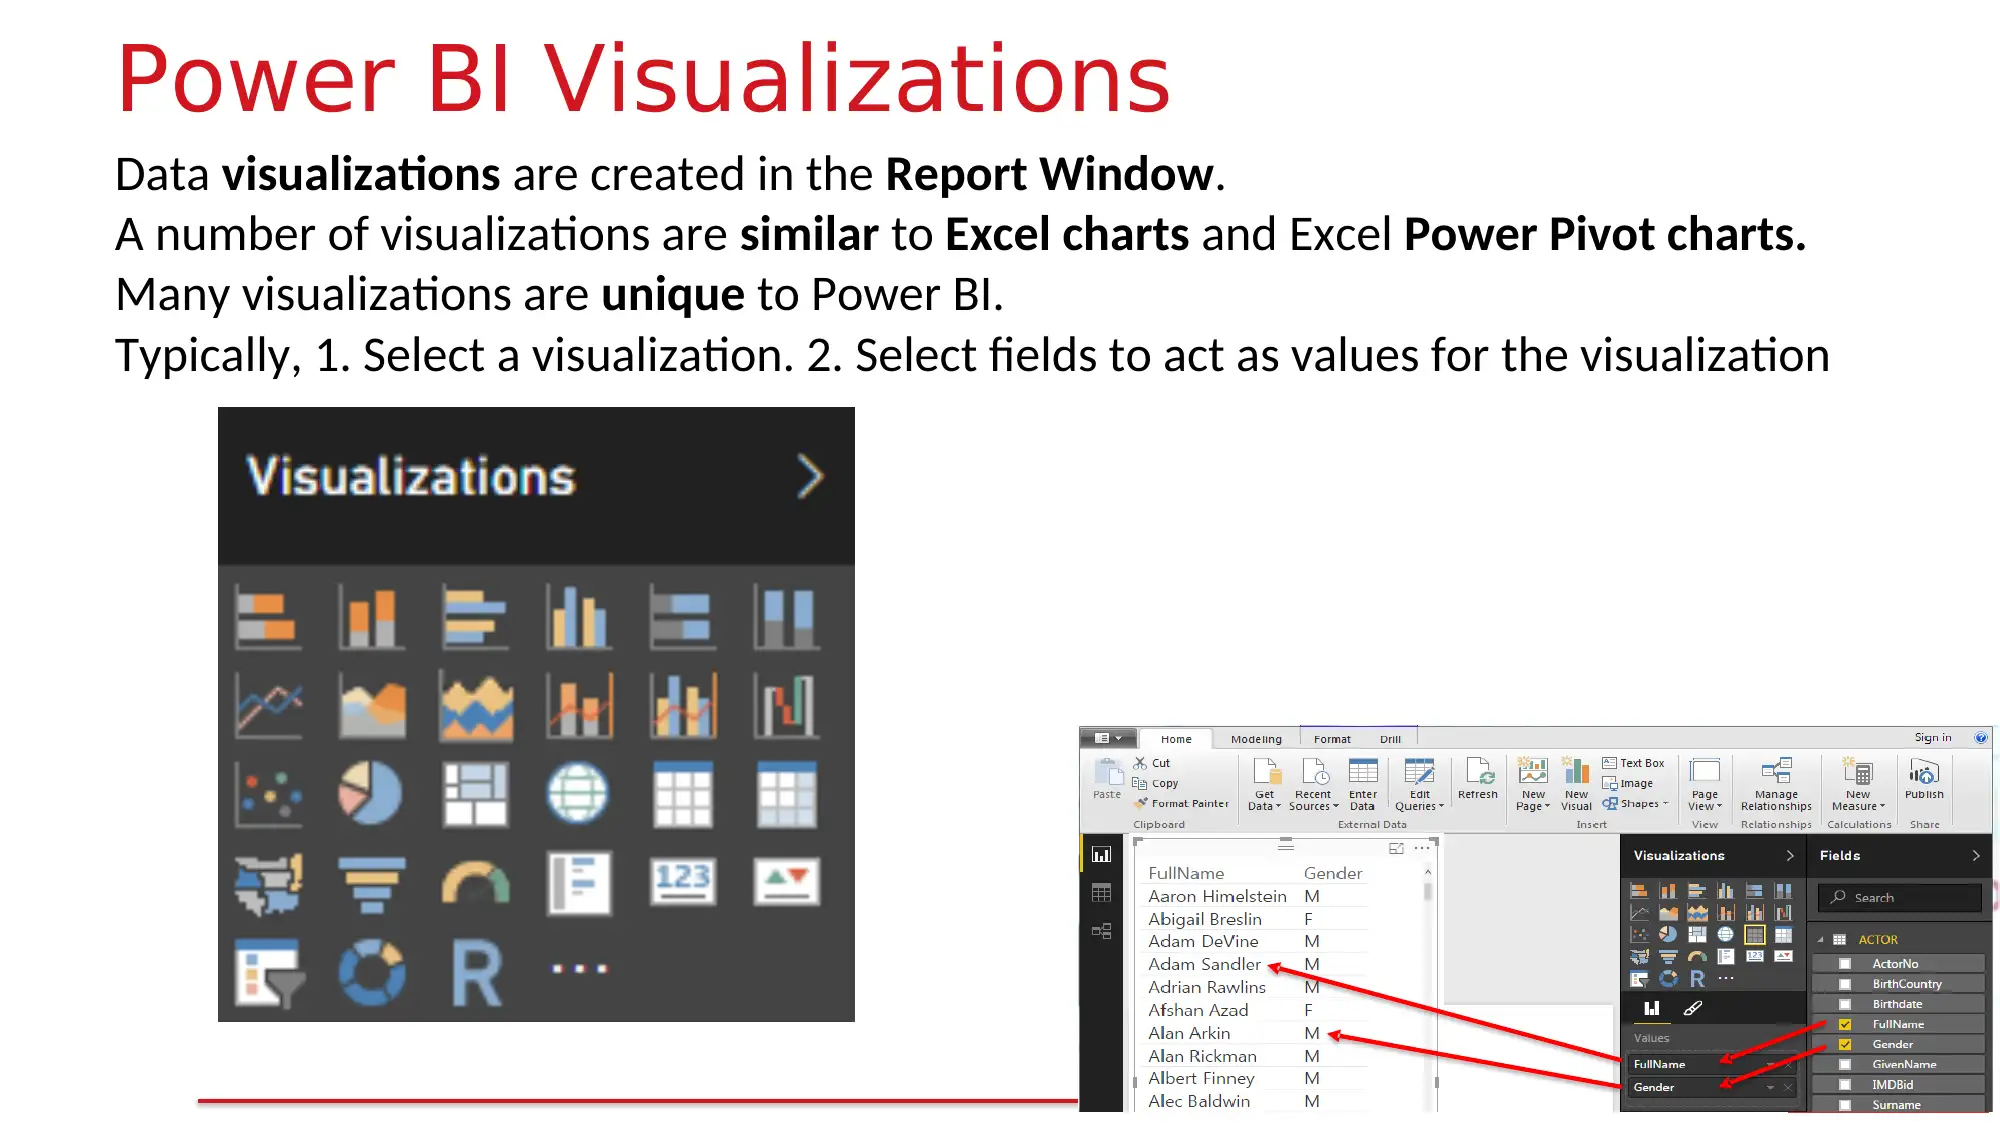
This assignment provides a comprehensive overview of Microsoft Power BI, a powerful business intelligence tool. It covers the basics of Power BI Desktop, including importing data from various sources like Access databases and CSV files. The assignment details the creation of different visualizations such as tables, matrix visualizations (similar to crosstab queries and pivot tables), and map visualizations. It also explores the use of slicers for filtering data and the creation of calculated columns and measures using DAX (Data Analysis Expressions) functions. Furthermore, the assignment discusses the relationships between tables, the customization of visualizations, and the integration of data from multiple sources. Finally, it highlights essential functions available in both Access and Power BI for string manipulation, date handling, and other data transformations, including examples using functions like Left(), Right(), Mid(), upper(), lower(), mod(), Date(), Today(), Now() and DateValue().
Document Page
CRICOS 00111D
TOID 3059
Database Analysis and Design
Week 04
Power BI - Importing Data, Visualizations, and
Access and Power BI functions
tabler-icon-diamond-filled.svg

Paraphrase This Document

Need a fresh take? Get an instant paraphrase of this document with our AI Paraphraser
Document Page
Microsoft Power BI
Microsoft have a number of Business Intelligence (BI) products / applications
Power BI is a suite of desktop & cloud based web application that allows you to
analyze datasets.
The datasets can be local or cloud based and may be connected to / imported from
RBDMSs, Spreadsheets, on-line data services etc.
Power BI can be added to the Office 365 suite of applications.
Through Power BI web app, users can analyze data with various visualizations and
dashboards.
One dataset may produce many different visualizations
Best performing customers
Worst preforming sales people
Upward trending products
Complimentary product sales
Document Page
Microsoft Power BI
Power BI Desktop is a different product from Power BI web app.
Desktop is a Windows application.
It must be installed on a computer running Windows (or via a virtual Windows OS
on a MAC or Linux)
Importing data / manipulating data / writing formula / creating measures is done
using the Desktop app.
Once visualizations / reports / dashboards have been created, then they are
deployed to a cloud service so that Power BI web app can be utilized.
Power BI Desktop is most often used by BI analysts & developers
Power BI web app is used by end-users and BI analysts.
Document Page
Microsoft Power BI Desktop
Business Intelligence software.
Power BI Desktop is a Windows
only application.
Problem:
One known problem exists when PBI
connects to an Access Database:
Both apps must be the same OS version
If Access is 32bit then download Power BI 32 bit
If your Access is 64 bit then download Power BI 64 bit
All Swinburne labs have 64bit Access and 64 bit Power BI Desktop installed.
tabler-icon-diamond-filled.svg

Paraphrase This Document

Need a fresh take? Get an instant paraphrase of this document with our AI Paraphraser
Document Page
Microsoft Power BI help
If you plan to install a version of Power BI on your own computer, then these links may be
useful:
What version of Office am I using?
https://support.office.com/en-us/article/What-version-of-Office-am-I-using-932788b8-
a3ce-44bf-bb09-e334518b8b19
Resolve Issues Importing Access Databases in Power BI Desktop
https://powerbi.microsoft.com/en-us/documentation/powerbi-desktop-access-database-
errors/
Download Microsoft Power BI Desktop
https://www.microsoft.com/en-in/download/details.aspx?id=45331
Document Page
Microsoft Power BI Desktop
In the next week or two, we will concentrate on Power BI Desktop.
We will create datasets, reports, dashboards.
We will not deploy / upload reports & dashboards to a cloud service yet.
Document Page
Microsoft Power BI Desktop
Begin the Power BI Desktop application.
Start with selecting the Get Data option
The application can connect to / import data
from many popular sources (including
non-Microsoft applications).
We will concentrate on connecting to Access
Database sources.
If you cannot connect to Access (usually because of the 32bit
vs 64 bit problem), then you will need to export data from
tables to a CSV files. Finally you will import the CSV files into
Power BI Desktop. A bit messy – but easily done.
tabler-icon-diamond-filled.svg

Paraphrase This Document

Need a fresh take? Get an instant paraphrase of this document with our AI Paraphraser
Document Page
Microsoft Power BI Desktop
Typically, you will have to choose which tables you want to connect to.
You can also connect to queries (or views as they are called in other RDBMSs)
There is no difference between a Table and a Query from the Power BI point of view.
Both present data as a collection of records made up of multiple fields.
Document Page
Microsoft Power BI Desktop
There are 3 work area icons on the left of the Power BI screen.
Report, Data and Relationship
Report Window – Where you add visualizations
Data Window – Where you view raw data, add columns & formula
Relationships Window – Where you view / create relationships between tables
Document Page
Power BI Relationships Window
The relationships that you created in Access are transferred to Power BI
You can add additional relationships as required.
(e.g. when data is added from other sources) The symbols differ
slightly from Access
tabler-icon-diamond-filled.svg

Paraphrase This Document

Need a fresh take? Get an instant paraphrase of this document with our AI Paraphraser
Document Page
Power BI Data Window
The Data Window is where you
Add additional columns / measures to the dataset
Remove unwanted columns
Write DAX (Data Analysis Expressions) formula. DAX formula are similar as Excel formula
plus the inclusion of additional functions designed to work with relational data and
perform dynamic aggregation. We will look at DAX formula later in the semester.
Document Page
Power BI Visualizations
Data visualizations are created in the Report Window.
A number of visualizations are similar to Excel charts and Excel Power Pivot charts.
Many visualizations are unique to Power BI.
Typically, 1. Select a visualization. 2. Select fields to act as values for the visualization
chevron_up_icon
1 out of 38
circle_padding
hide_on_mobile
zoom_out_icon
[object Object]