Power System Analysis & Control Assignment 1: Transmission Line Design
VerifiedAdded on 2022/12/23
|15
|2171
|1
Homework Assignment
AI Summary
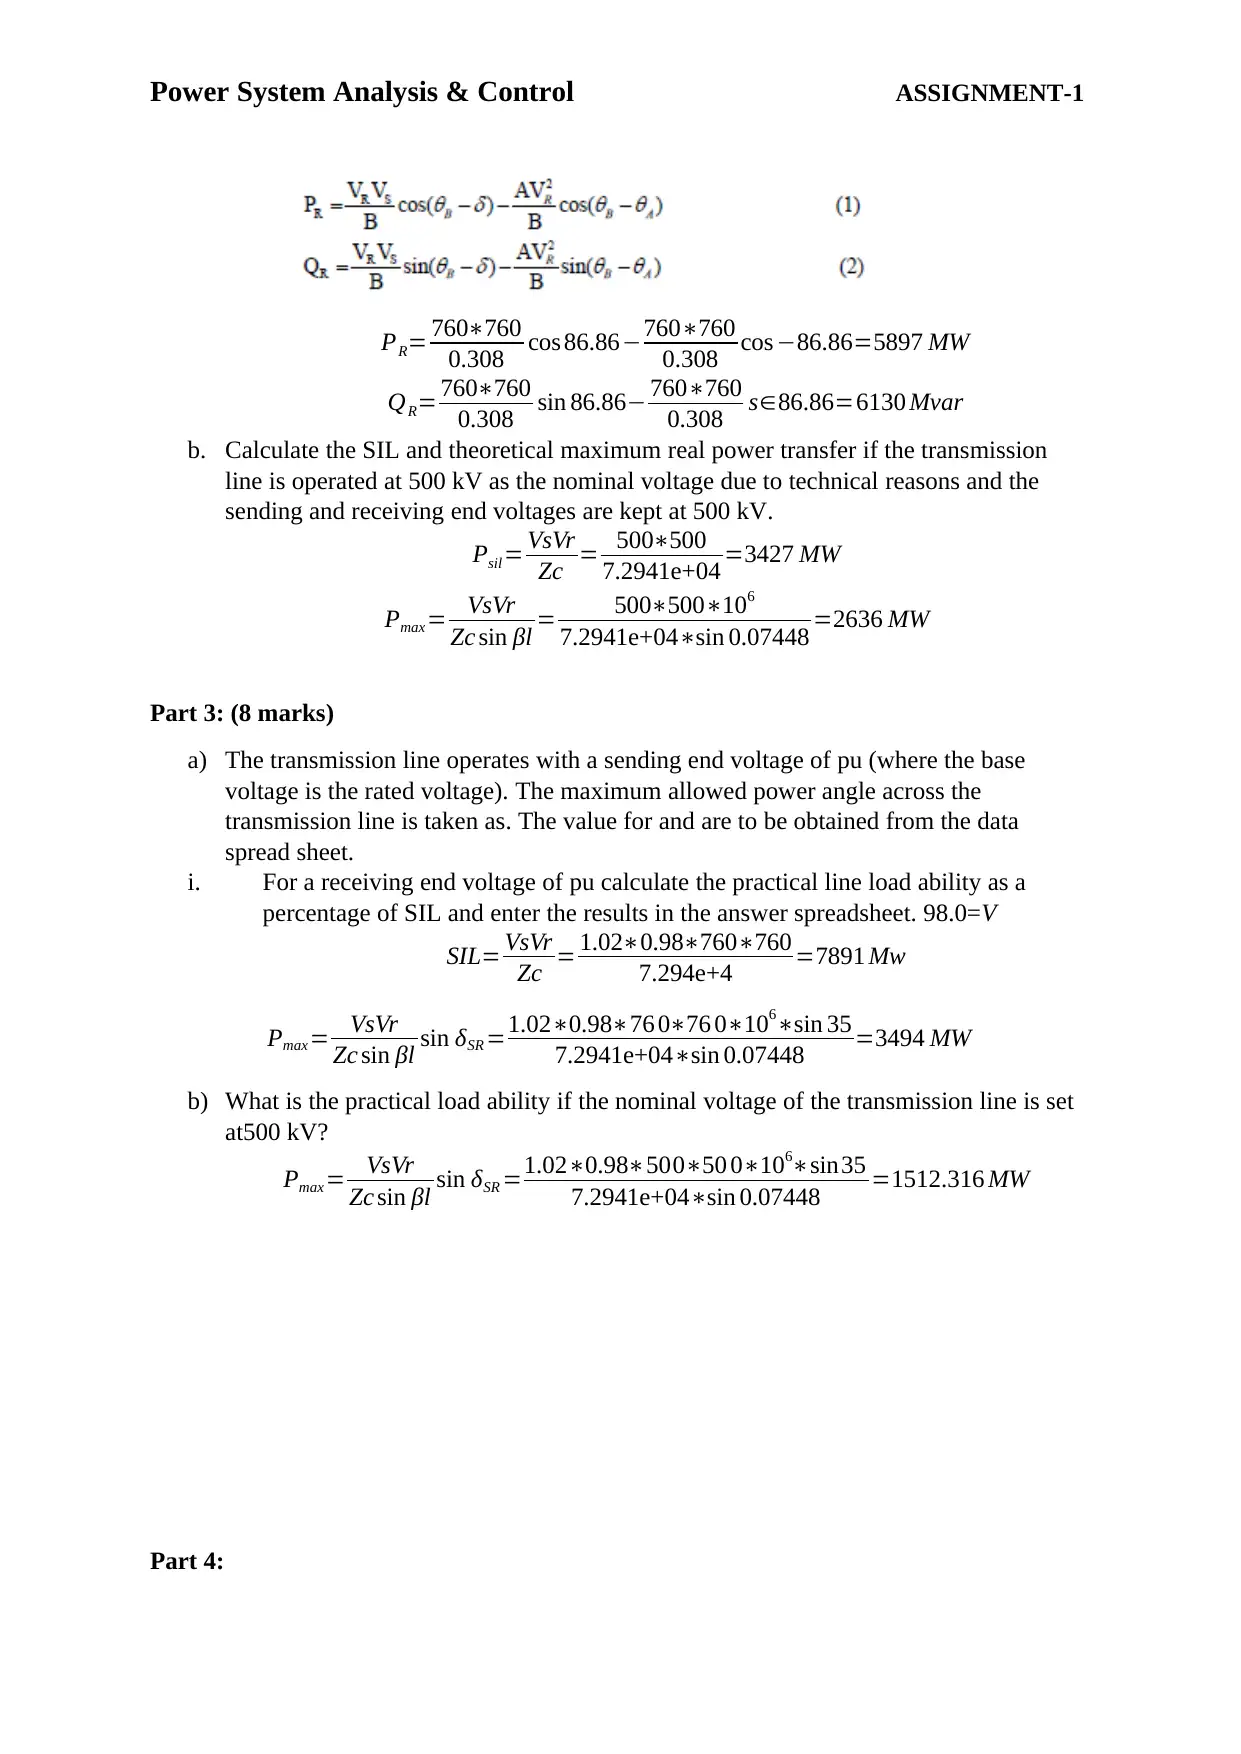
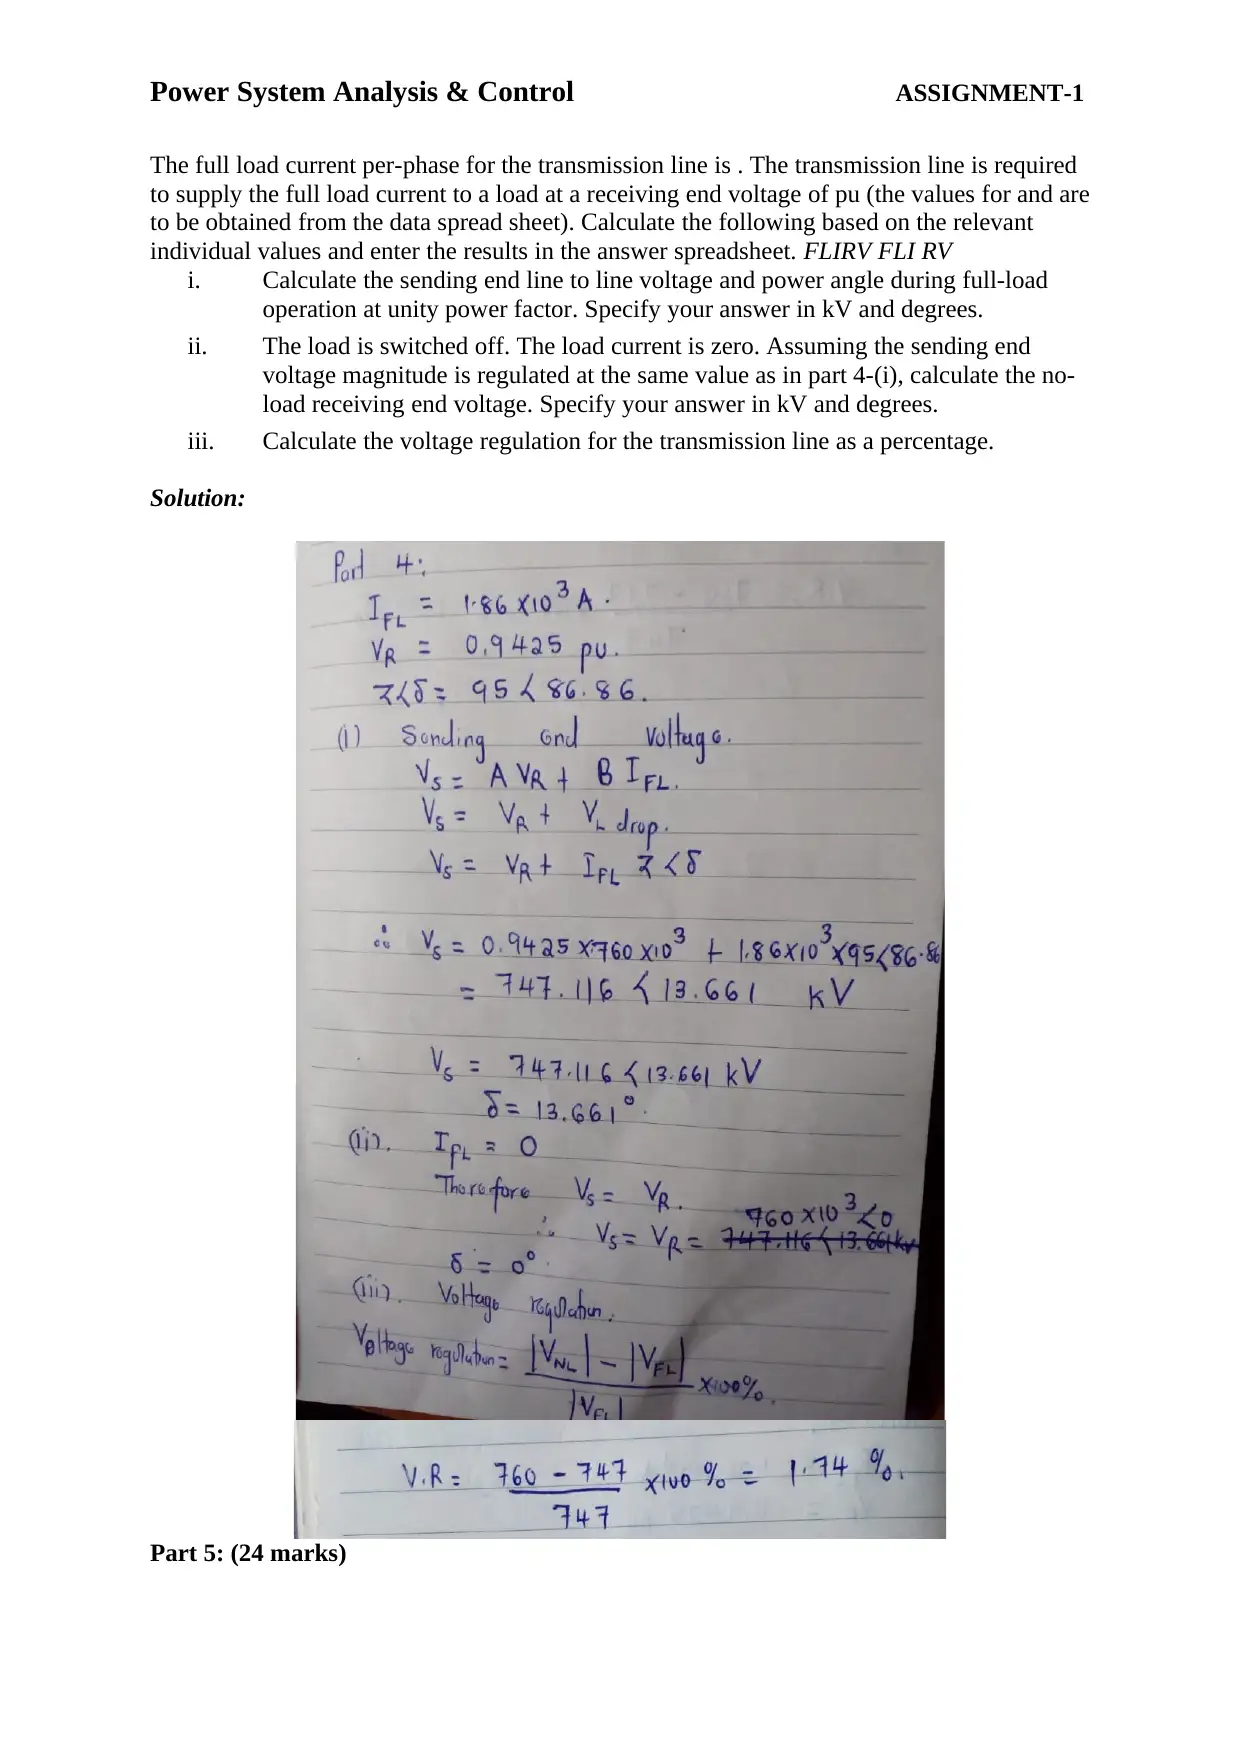
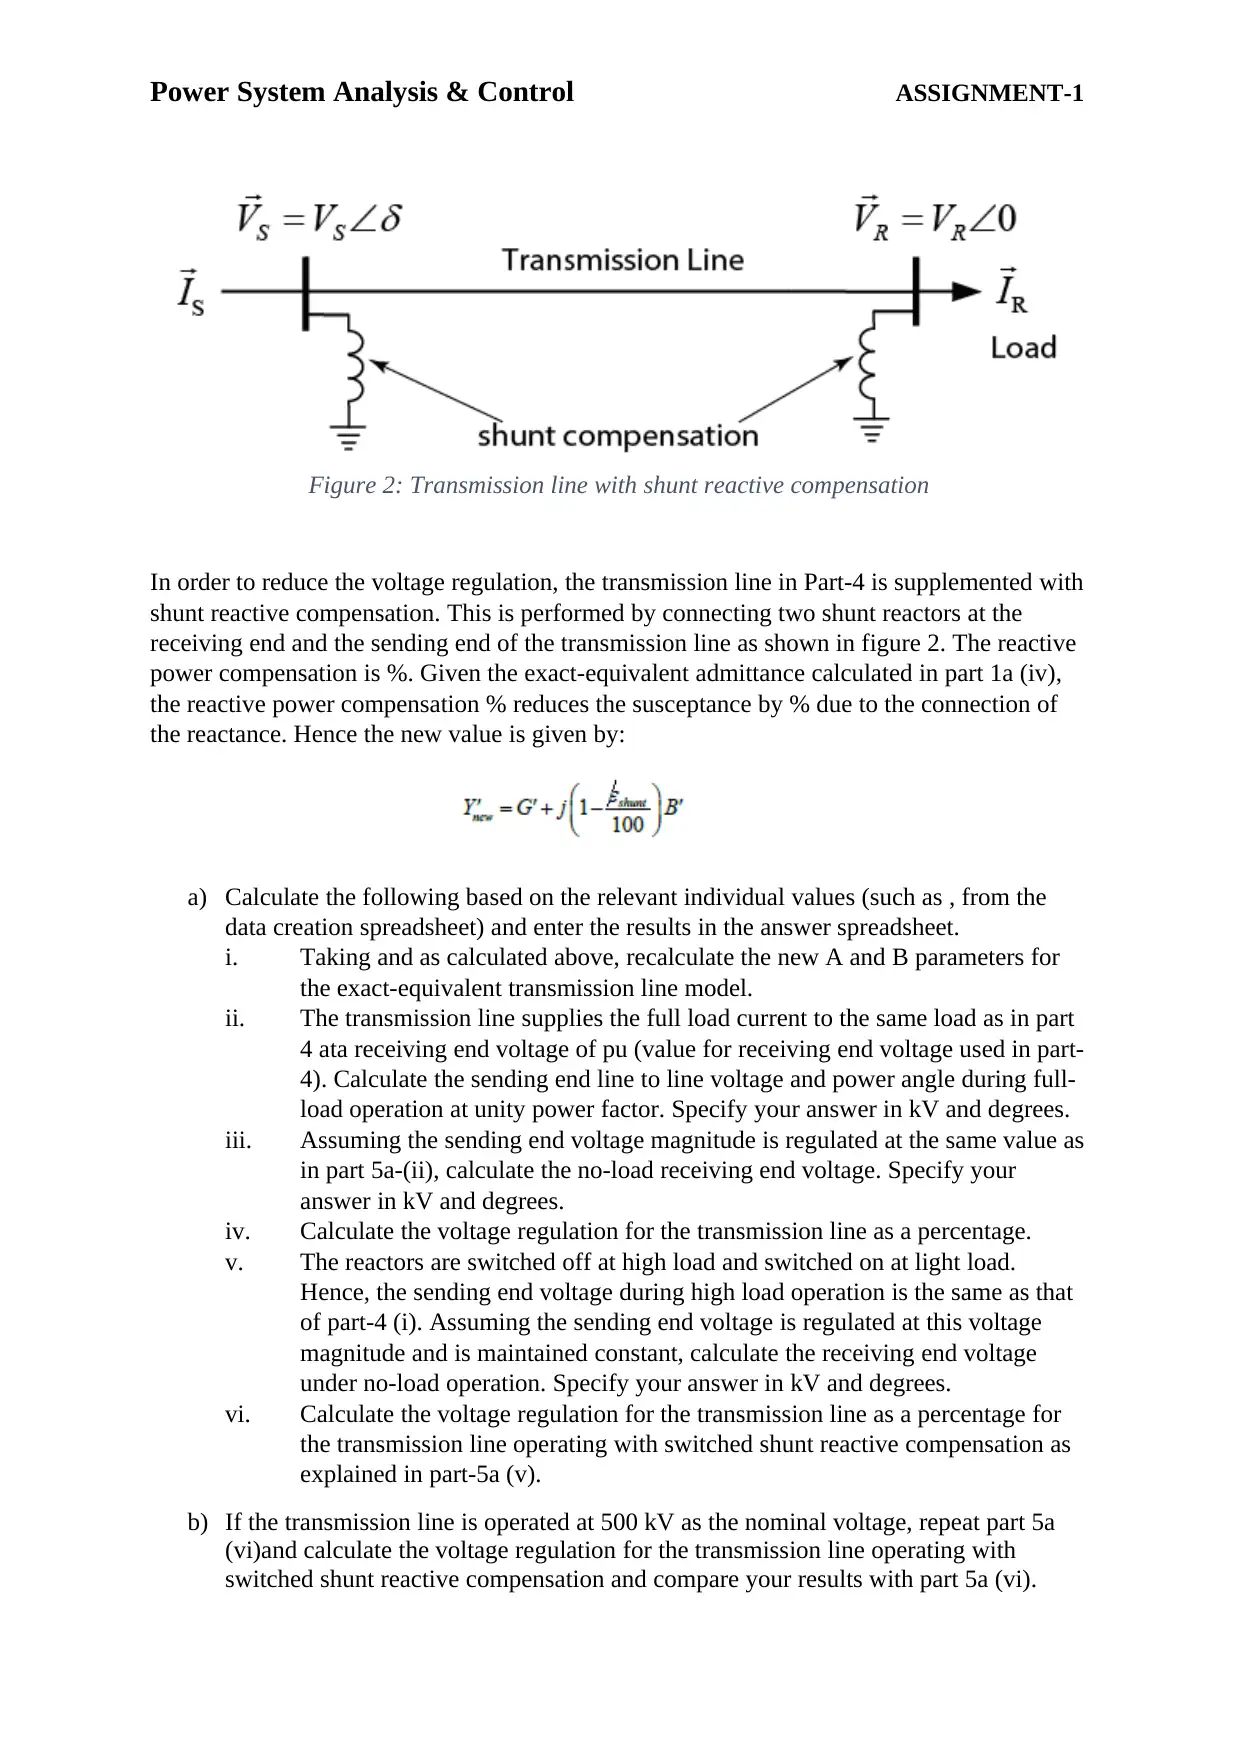
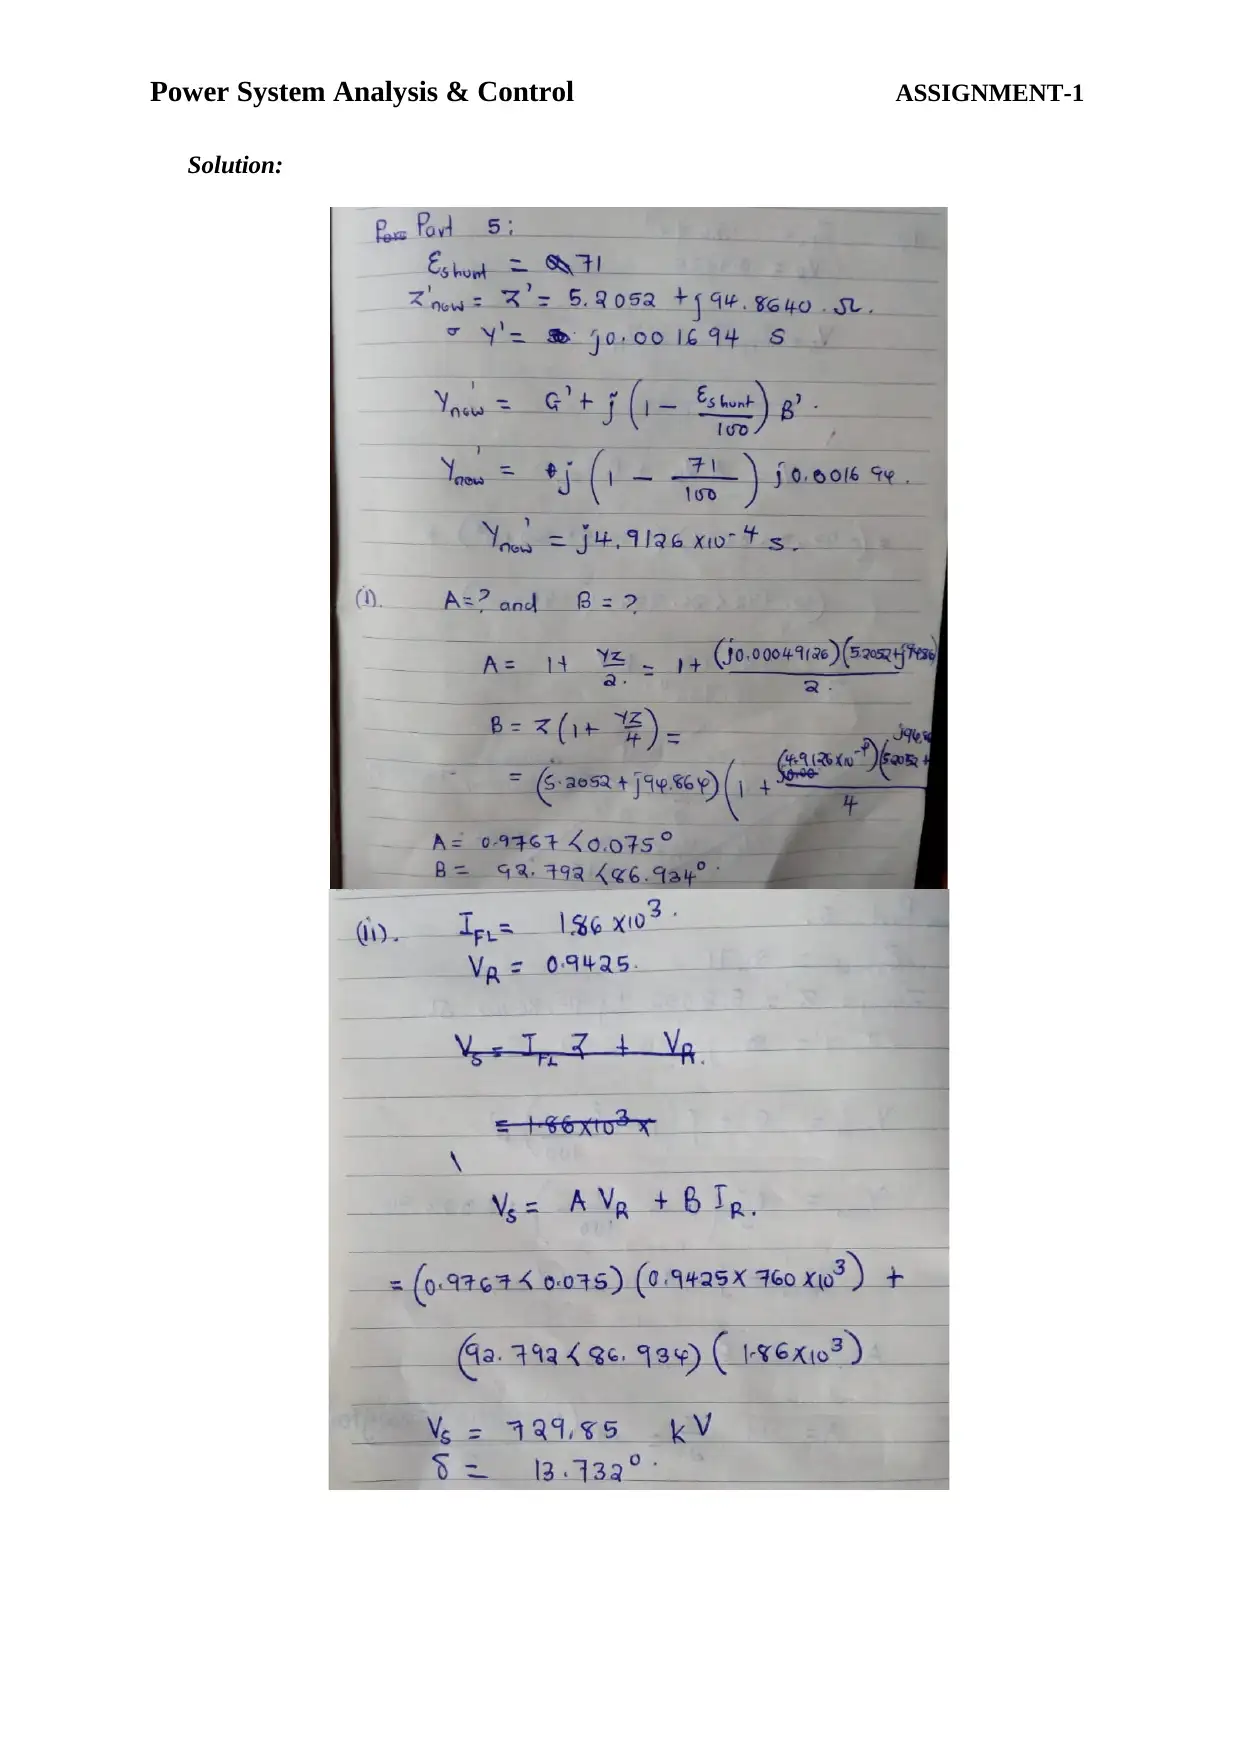
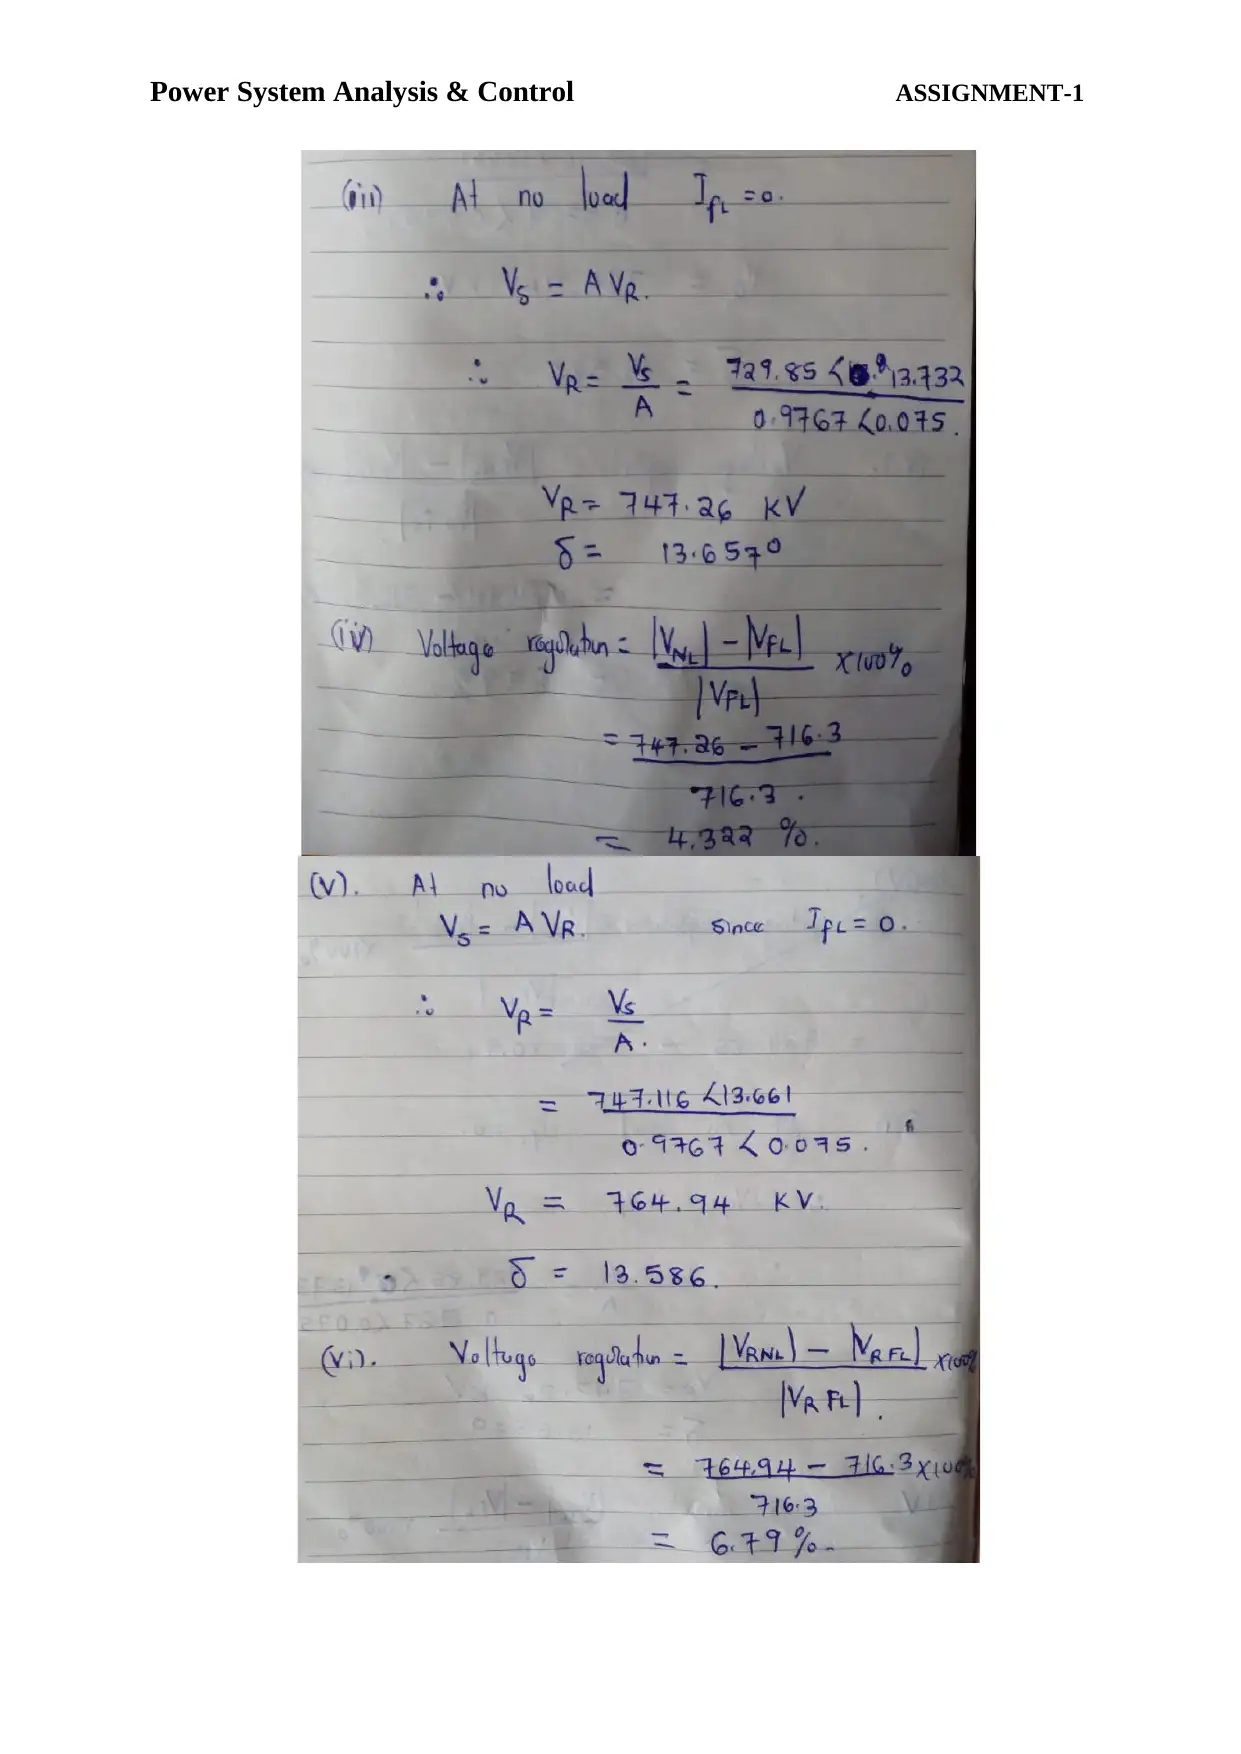
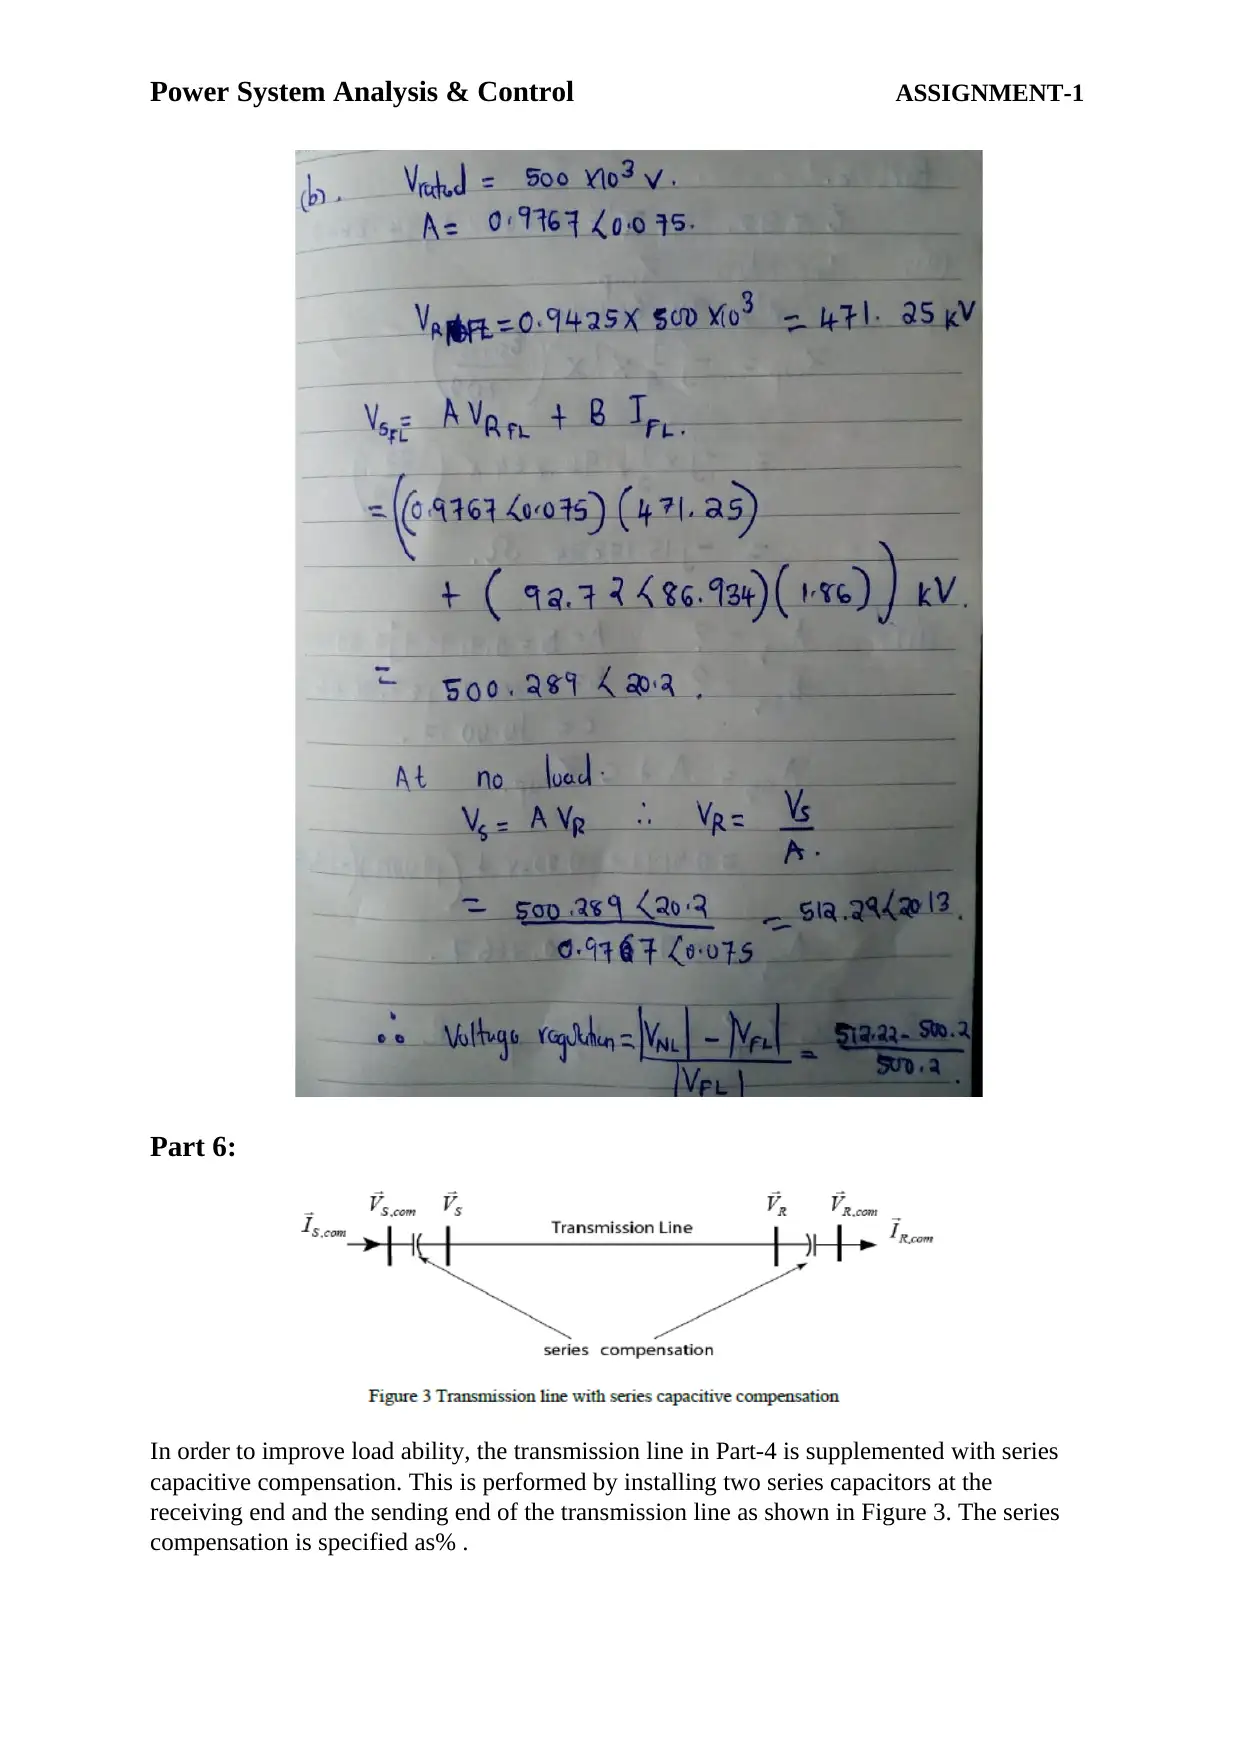
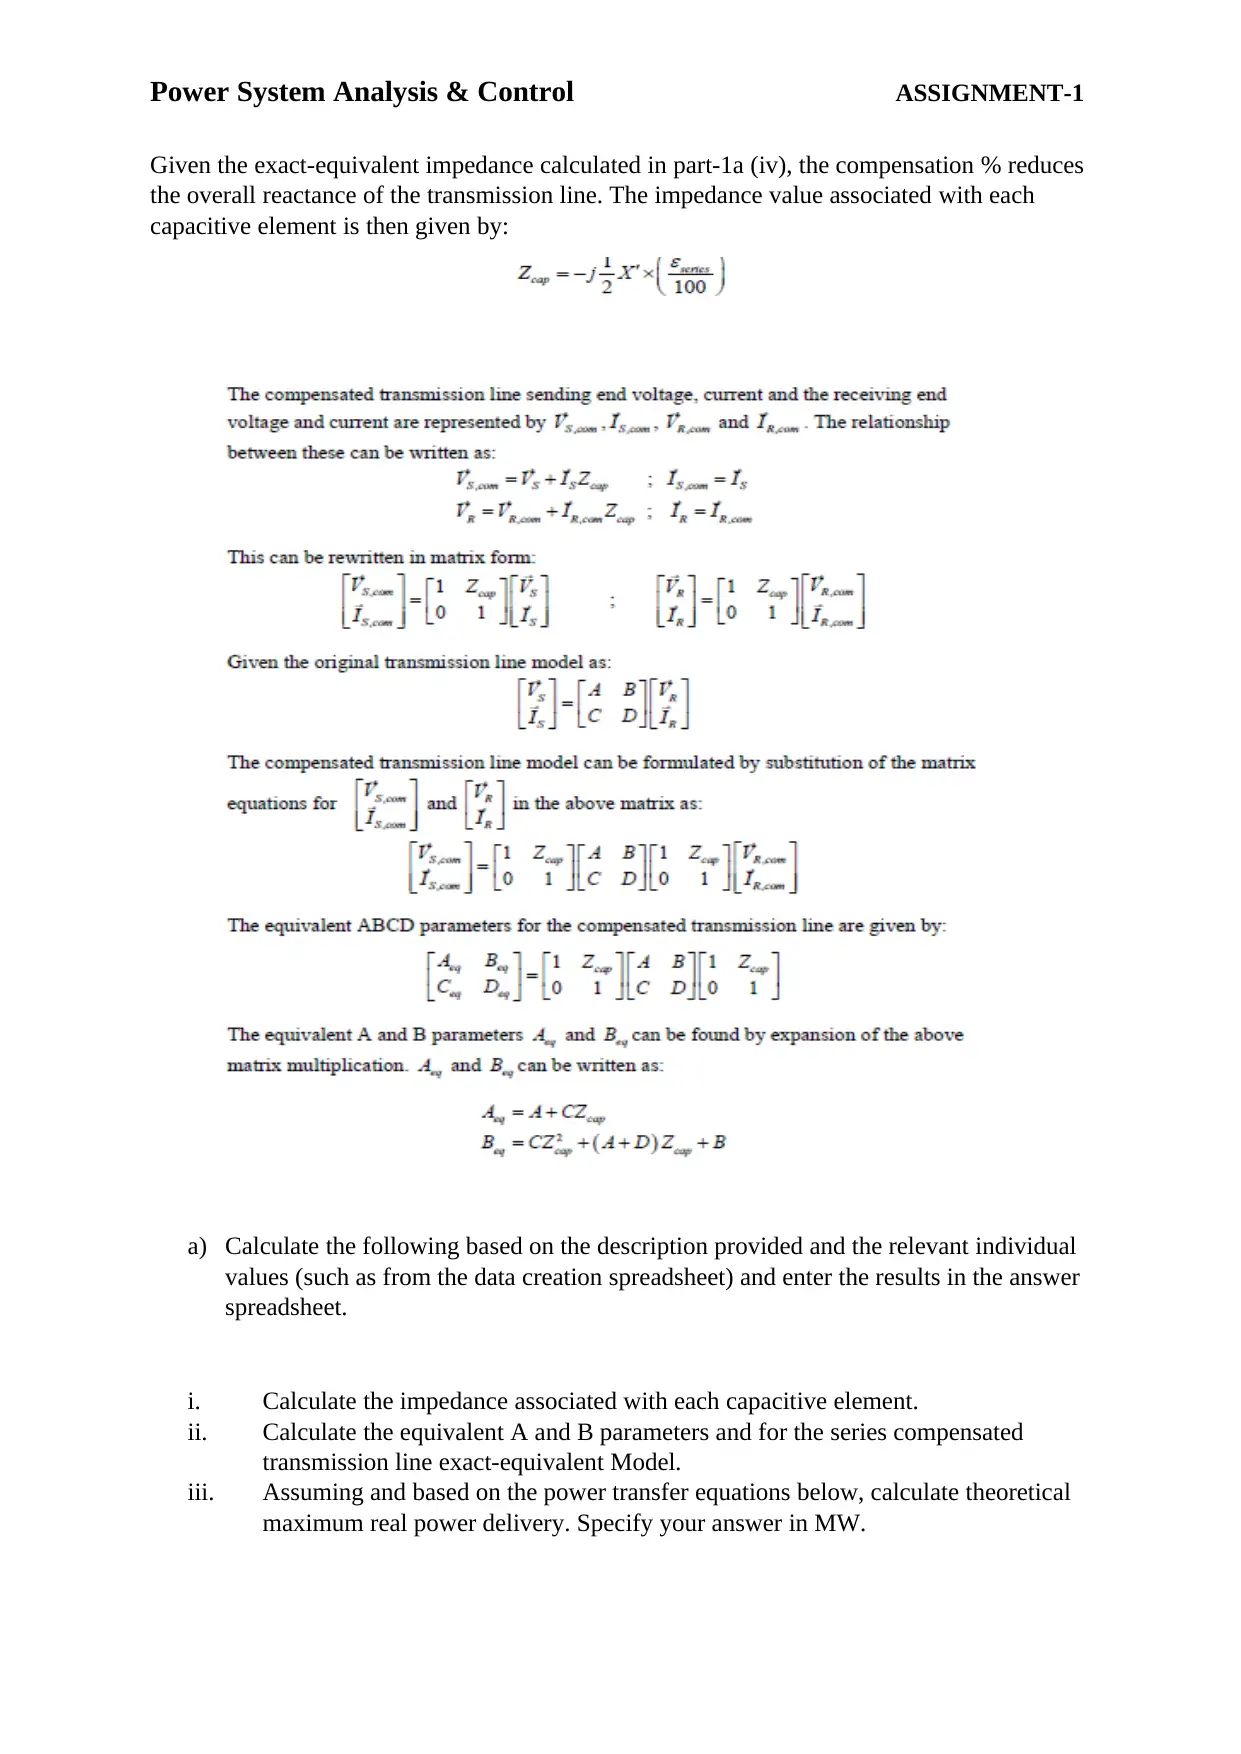
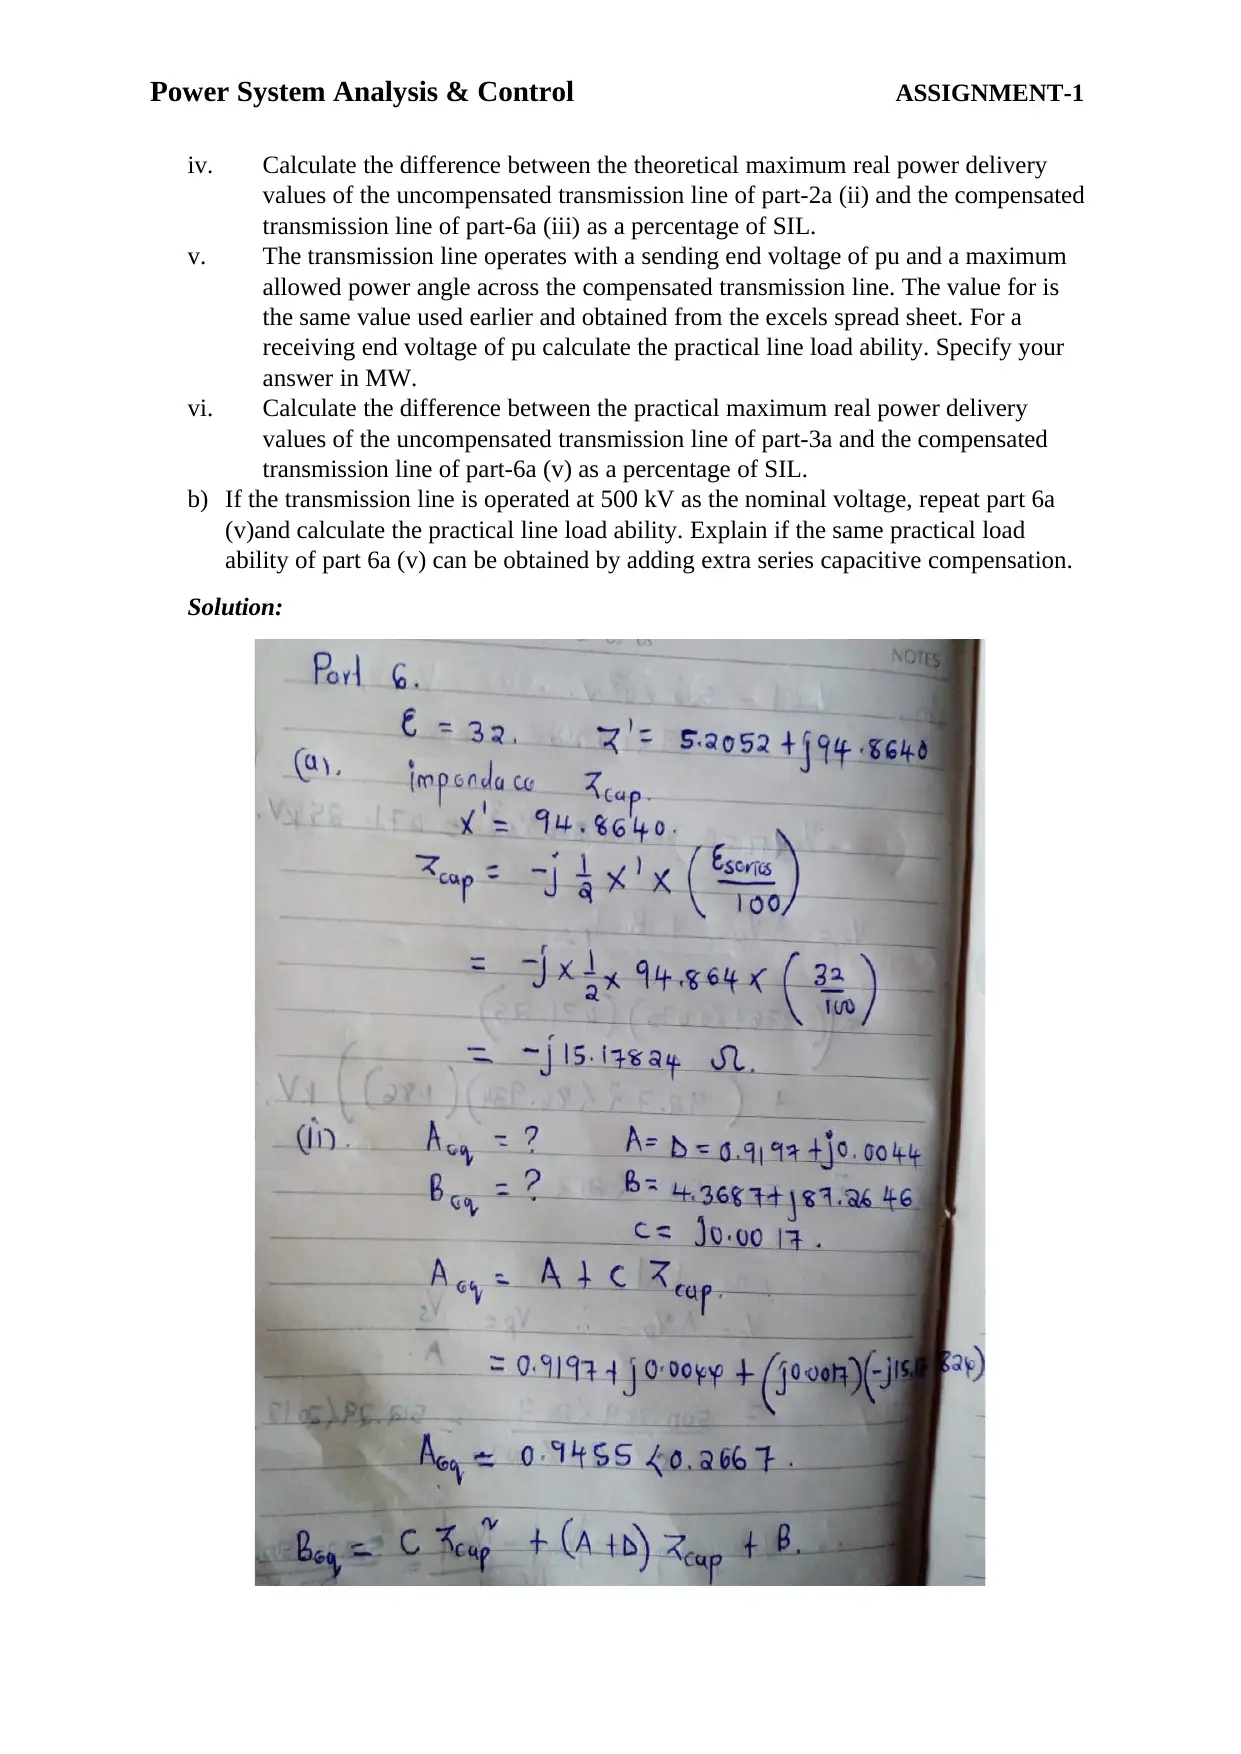
This document presents a comprehensive solution to a Power System Analysis & Control assignment, focusing on transmission line design and performance analysis. The assignment covers various aspects, including the calculation of transmission line parameters (propagation constant, characteristic impedance, ABCD parameters, and equivalent circuit models), analysis of power transfer limits, and the impact of shunt and series compensation on voltage regulation and load ability. The solution includes detailed calculations, graphs comparing different line models, and the evaluation of practical load ability under various operating conditions, considering factors such as sending and receiving end voltages, power angles, and full-load current. The assignment also explores the effects of operating the transmission line at different nominal voltages and the impact of shunt and series compensation on the power transfer capabilities. The solutions are aimed at providing detailed engineering design and calculations for a transmission line project, delivering power to a remote mining facility.
Contribute Materials
Your contribution can guide someone’s learning journey. Share your
documents today.

Power System Analysis & Control ASSIGNMENT-1
ASSIGNMENT
By
(Name)
(Course)
(Professor’s Name)
(Institution)
(State)
(Date)
ASSIGNMENT
By
(Name)
(Course)
(Professor’s Name)
(Institution)
(State)
(Date)
Secure Best Marks with AI Grader
Need help grading? Try our AI Grader for instant feedback on your assignments.

Power System Analysis & Control ASSIGNMENT-1
Power System Analysis & Control
Objectives:
The main objective of this assignment is to apply your knowledge gained from Power System
Analysis and Control Course on the following topics:
Transmission Line Parameters
Transmission Line Modelling
Power Transfer Limits of Transmission Lines
Transmission Line Design
Reading material:
Revise Lecture materials and text book. Examples 5.2, 5.3, 5.5 5.6, 5.9 and 5.10 of the
prescribed text book are recommended prior to this assignment.
Data Set:
In this assignment you will need to use a unique set of system data in several parts of the
assignment which are outlined in Table 1. The detailed information about obtaining your data
and submission of the complete assignment are provided at the end of this document and the
“Assignments” Section in Canvas.
Table: 1 Values of the following variables are to be generated via the data creation
spreadsheet.
Assignment Tasks:
Assume that you are a Power System Design Engineer working for a Power Utility Company.
You are tasked with providing detailed engineering design and calculations for a transmission
line project to deliver power to a remote mining facility. The preliminary studies have
suggested that a single circuit transposed HV transmission line with the rated voltage Vrated of
and the length Ltx-line of is a feasible solution for this power transmission project. The
schematic diagram of the proposed project is illustrated in Figure 1. The preliminary studies
have also suggested the type of towers and conductors and the transmission line series
impedance per-unit length z[Ω/km] and admittance per unit length y[s/km] have been
calculated accordingly.
The values for Vrated, Ltx-line, z and y are to be obtained from the excel spreadsheet as part of
your individual unique set of data.

Power System Analysis & Control ASSIGNMENT-1
Figure 1: Transmission line single-line diagram.
Real part Imaginary part
Transmission line rated voltage (for part-1) [kV] 760 0
Length of the transmission line (for part-1) [km] 308 0
Series impedance per-unit length (for part-1) [ohm/km] 0.0169 0.308
Shunt admittance per unit length (for part-1) [S/km] 0 0.0000055
Practical limit for phase angle (for part-3) [deg] 35 0
Receiving end voltage (for part-4, 5 and 6)
[pu] 0.9425 0
Rated full load current (for part-4, 5 and 6)
[kA] 1.86 0
Shunt reactive compensation (for part-5) [%] 71 0
Capacitive compensation (for part-6) [%] 32 0
Part 1: (20 marks)
a) Assuming positive sequence operation, calculate the following based on the relevant
individual values (generated from the data spreadsheet) and enter the results in the
answer spreadsheet.
i) The propagation constant gamma in units [km-1].
γ= √zy = √ ( 0.0169+ j 0.308 )∗308∗308∗( j0.0000055)=0.0110+ 0.4010i
ii) The characteristic impedance Zc in units [Ω].
Zc= √ z
y = √ 0.0169+ j 0.308
j 0.0000055 =7.2914e+04−1.9989e+03i
iii) Exact ABCD parameters of the line.
A=D=1+ zy
2 =1+ ( 0.0169+ j 0.308 )∗( j 0.0000055)
2 =1
B=z (1+ zy
4 )= ( 0.0169+ j 0.308 ) (1+ ( 0.0169+ j0.308 )∗( j 0.0000055 )
4 )=0.0169+ j 0.308
C= j 0.0000055
iv) Calculate the exact-pi equivalent circuit model parameters the Z’ and Y’.
Exact parameters
Z=zl=5.2052+94.8640 i
Y = yl=5.2052+94.8640 i
b) Compare the Z’ and Y’ parameters for the exact and nominal π-equivalent models of
this transmission line based on the length of the line and draw relevant graphs
considering the line lengths of 200 km to 1000 km (at least 100 km intervals).
Exact parameters

Power System Analysis & Control ASSIGNMENT-1
Z=zl
Y = yl
Nominal pi parameters
Z=Zc sinh γl
Y
2 =
tanh γl
2
Zc
200 300 400 500 600 700 800 900 1000
0
0.5
1
1.5
2
2.5 109Graphs of exact and nominal pi parameters of the transmission line
Exact impedance
Nominal impedance
Exact admittance
Nominal admittance
Hint: you can either calculate the parameters for nominal and exact models in100 km
intervals or use a computer code to generate the relevant graphs.
Part 2: (10 marks)
a. Calculate the following based on the relevant individual values (generated from the
data spreadsheet) and enter the results in the answer spreadsheet.
i. Assuming and that the surge impedance of the line is equal to the real part of
(resistive), calculate the SIL (surge impedance loading) of the transmission line.
Specify your answer in MW.
PR= VsVr
Zc = 760∗760∗106
7.2941 e 4 =7918 MW
ii. Based on the power transfer equations below, calculate theoretical maximum real
power delivery as a percentage of SIL.
Secure Best Marks with AI Grader
Need help grading? Try our AI Grader for instant feedback on your assignments.

Power System Analysis & Control ASSIGNMENT-1
PR= 760∗760
0.308 cos 86.86−760∗760
0.308 cos −86.86=5897 MW
QR= 760∗760
0.308 sin 86.86− 760∗760
0.308 s∈86.86=6130 Mvar
b. Calculate the SIL and theoretical maximum real power transfer if the transmission
line is operated at 500 kV as the nominal voltage due to technical reasons and the
sending and receiving end voltages are kept at 500 kV.
Psil = VsVr
Zc = 500∗500
7.2941e+04 =3427 MW
Pmax= VsVr
Zc sin βl = 500∗500∗106
7.2941e+04∗sin 0.07448 =2636 MW
Part 3: (8 marks)
a) The transmission line operates with a sending end voltage of pu (where the base
voltage is the rated voltage). The maximum allowed power angle across the
transmission line is taken as. The value for and are to be obtained from the data
spread sheet.
i. For a receiving end voltage of pu calculate the practical line load ability as a
percentage of SIL and enter the results in the answer spreadsheet. 98.0=V
SIL= VsVr
Zc = 1.02∗0.98∗760∗760
7.294e+4 =7891 Mw
Pmax = VsVr
Zc sin βl sin δSR =1.02∗0.98∗76 0∗76 0∗106∗sin 35
7.2941e+04∗sin 0.07448 =3494 MW
b) What is the practical load ability if the nominal voltage of the transmission line is set
at500 kV?
Pmax = VsVr
Zc sin βl sin δSR =1.02∗0.98∗500∗50 0∗106∗sin35
7.2941e+04∗sin 0.07448 =1512.316 MW
Part 4:

Power System Analysis & Control ASSIGNMENT-1
The full load current per-phase for the transmission line is . The transmission line is required
to supply the full load current to a load at a receiving end voltage of pu (the values for and are
to be obtained from the data spread sheet). Calculate the following based on the relevant
individual values and enter the results in the answer spreadsheet. FLIRV FLI RV
i. Calculate the sending end line to line voltage and power angle during full-load
operation at unity power factor. Specify your answer in kV and degrees.
ii. The load is switched off. The load current is zero. Assuming the sending end
voltage magnitude is regulated at the same value as in part 4-(i), calculate the no-
load receiving end voltage. Specify your answer in kV and degrees.
iii. Calculate the voltage regulation for the transmission line as a percentage.
Solution:
Part 5: (24 marks)

Power System Analysis & Control ASSIGNMENT-1
Figure 2: Transmission line with shunt reactive compensation
In order to reduce the voltage regulation, the transmission line in Part-4 is supplemented with
shunt reactive compensation. This is performed by connecting two shunt reactors at the
receiving end and the sending end of the transmission line as shown in figure 2. The reactive
power compensation is %. Given the exact-equivalent admittance calculated in part 1a (iv),
the reactive power compensation % reduces the susceptance by % due to the connection of
the reactance. Hence the new value is given by:
a) Calculate the following based on the relevant individual values (such as , from the
data creation spreadsheet) and enter the results in the answer spreadsheet.
i. Taking and as calculated above, recalculate the new A and B parameters for
the exact-equivalent transmission line model.
ii. The transmission line supplies the full load current to the same load as in part
4 ata receiving end voltage of pu (value for receiving end voltage used in part-
4). Calculate the sending end line to line voltage and power angle during full-
load operation at unity power factor. Specify your answer in kV and degrees.
iii. Assuming the sending end voltage magnitude is regulated at the same value as
in part 5a-(ii), calculate the no-load receiving end voltage. Specify your
answer in kV and degrees.
iv. Calculate the voltage regulation for the transmission line as a percentage.
v. The reactors are switched off at high load and switched on at light load.
Hence, the sending end voltage during high load operation is the same as that
of part-4 (i). Assuming the sending end voltage is regulated at this voltage
magnitude and is maintained constant, calculate the receiving end voltage
under no-load operation. Specify your answer in kV and degrees.
vi. Calculate the voltage regulation for the transmission line as a percentage for
the transmission line operating with switched shunt reactive compensation as
explained in part-5a (v).
b) If the transmission line is operated at 500 kV as the nominal voltage, repeat part 5a
(vi)and calculate the voltage regulation for the transmission line operating with
switched shunt reactive compensation and compare your results with part 5a (vi).
Paraphrase This Document
Need a fresh take? Get an instant paraphrase of this document with our AI Paraphraser

Power System Analysis & Control ASSIGNMENT-1
Solution:
Solution:

Power System Analysis & Control ASSIGNMENT-1

Power System Analysis & Control ASSIGNMENT-1
Part 6:
In order to improve load ability, the transmission line in Part-4 is supplemented with series
capacitive compensation. This is performed by installing two series capacitors at the
receiving end and the sending end of the transmission line as shown in Figure 3. The series
compensation is specified as% .
Secure Best Marks with AI Grader
Need help grading? Try our AI Grader for instant feedback on your assignments.

Power System Analysis & Control ASSIGNMENT-1
Given the exact-equivalent impedance calculated in part-1a (iv), the compensation % reduces
the overall reactance of the transmission line. The impedance value associated with each
capacitive element is then given by:
a) Calculate the following based on the description provided and the relevant individual
values (such as from the data creation spreadsheet) and enter the results in the answer
spreadsheet.
i. Calculate the impedance associated with each capacitive element.
ii. Calculate the equivalent A and B parameters and for the series compensated
transmission line exact-equivalent Model.
iii. Assuming and based on the power transfer equations below, calculate theoretical
maximum real power delivery. Specify your answer in MW.

Power System Analysis & Control ASSIGNMENT-1
iv. Calculate the difference between the theoretical maximum real power delivery
values of the uncompensated transmission line of part-2a (ii) and the compensated
transmission line of part-6a (iii) as a percentage of SIL.
v. The transmission line operates with a sending end voltage of pu and a maximum
allowed power angle across the compensated transmission line. The value for is
the same value used earlier and obtained from the excels spread sheet. For a
receiving end voltage of pu calculate the practical line load ability. Specify your
answer in MW.
vi. Calculate the difference between the practical maximum real power delivery
values of the uncompensated transmission line of part-3a and the compensated
transmission line of part-6a (v) as a percentage of SIL.
b) If the transmission line is operated at 500 kV as the nominal voltage, repeat part 6a
(v)and calculate the practical line load ability. Explain if the same practical load
ability of part 6a (v) can be obtained by adding extra series capacitive compensation.
Solution:

Power System Analysis & Control ASSIGNMENT-1
Paraphrase This Document
Need a fresh take? Get an instant paraphrase of this document with our AI Paraphraser

Power System Analysis & Control ASSIGNMENT-1

Power System Analysis & Control ASSIGNMENT-1
1 out of 15
Related Documents

Your All-in-One AI-Powered Toolkit for Academic Success.
+13062052269
info@desklib.com
Available 24*7 on WhatsApp / Email
Unlock your academic potential
© 2024 | Zucol Services PVT LTD | All rights reserved.