Capital Budgeting Report: Comparing Powerboat Investment Options
VerifiedAdded on 2020/12/18
|10
|2046
|447
Report
AI Summary
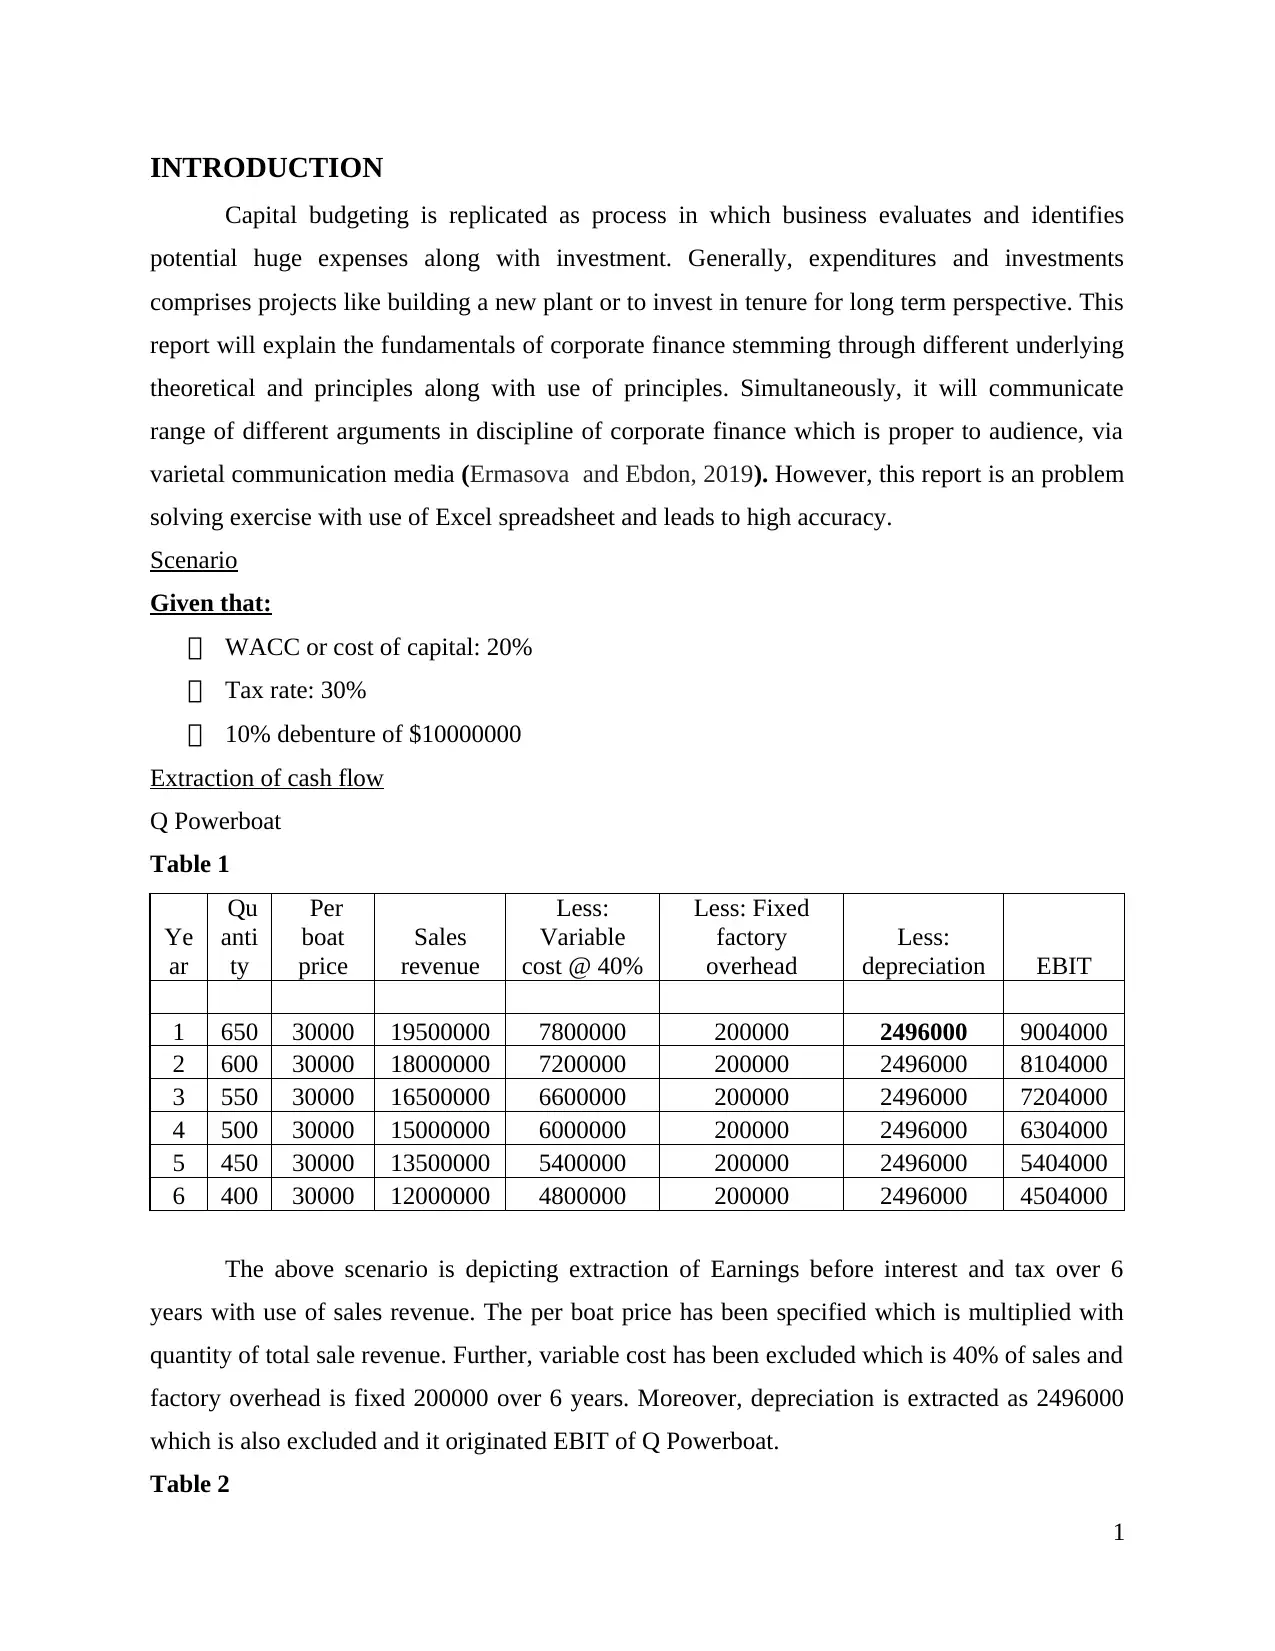
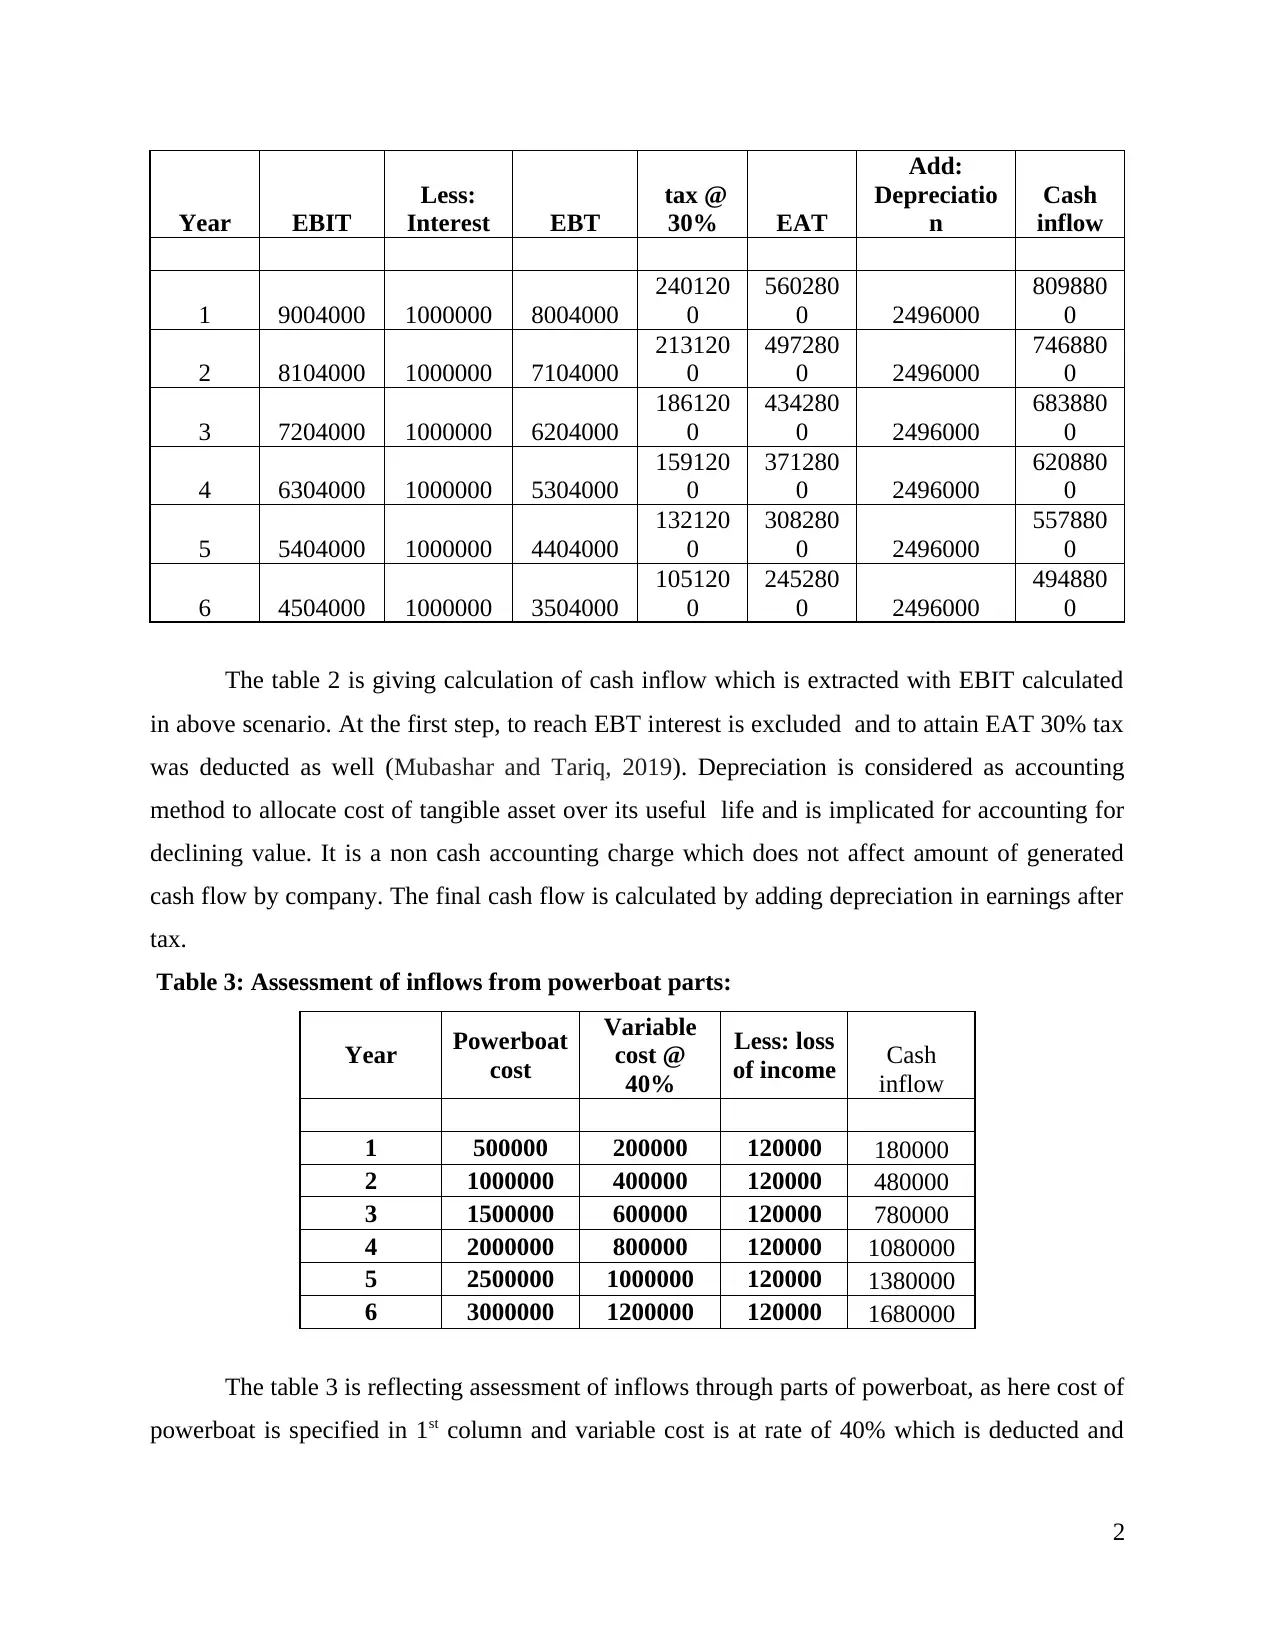
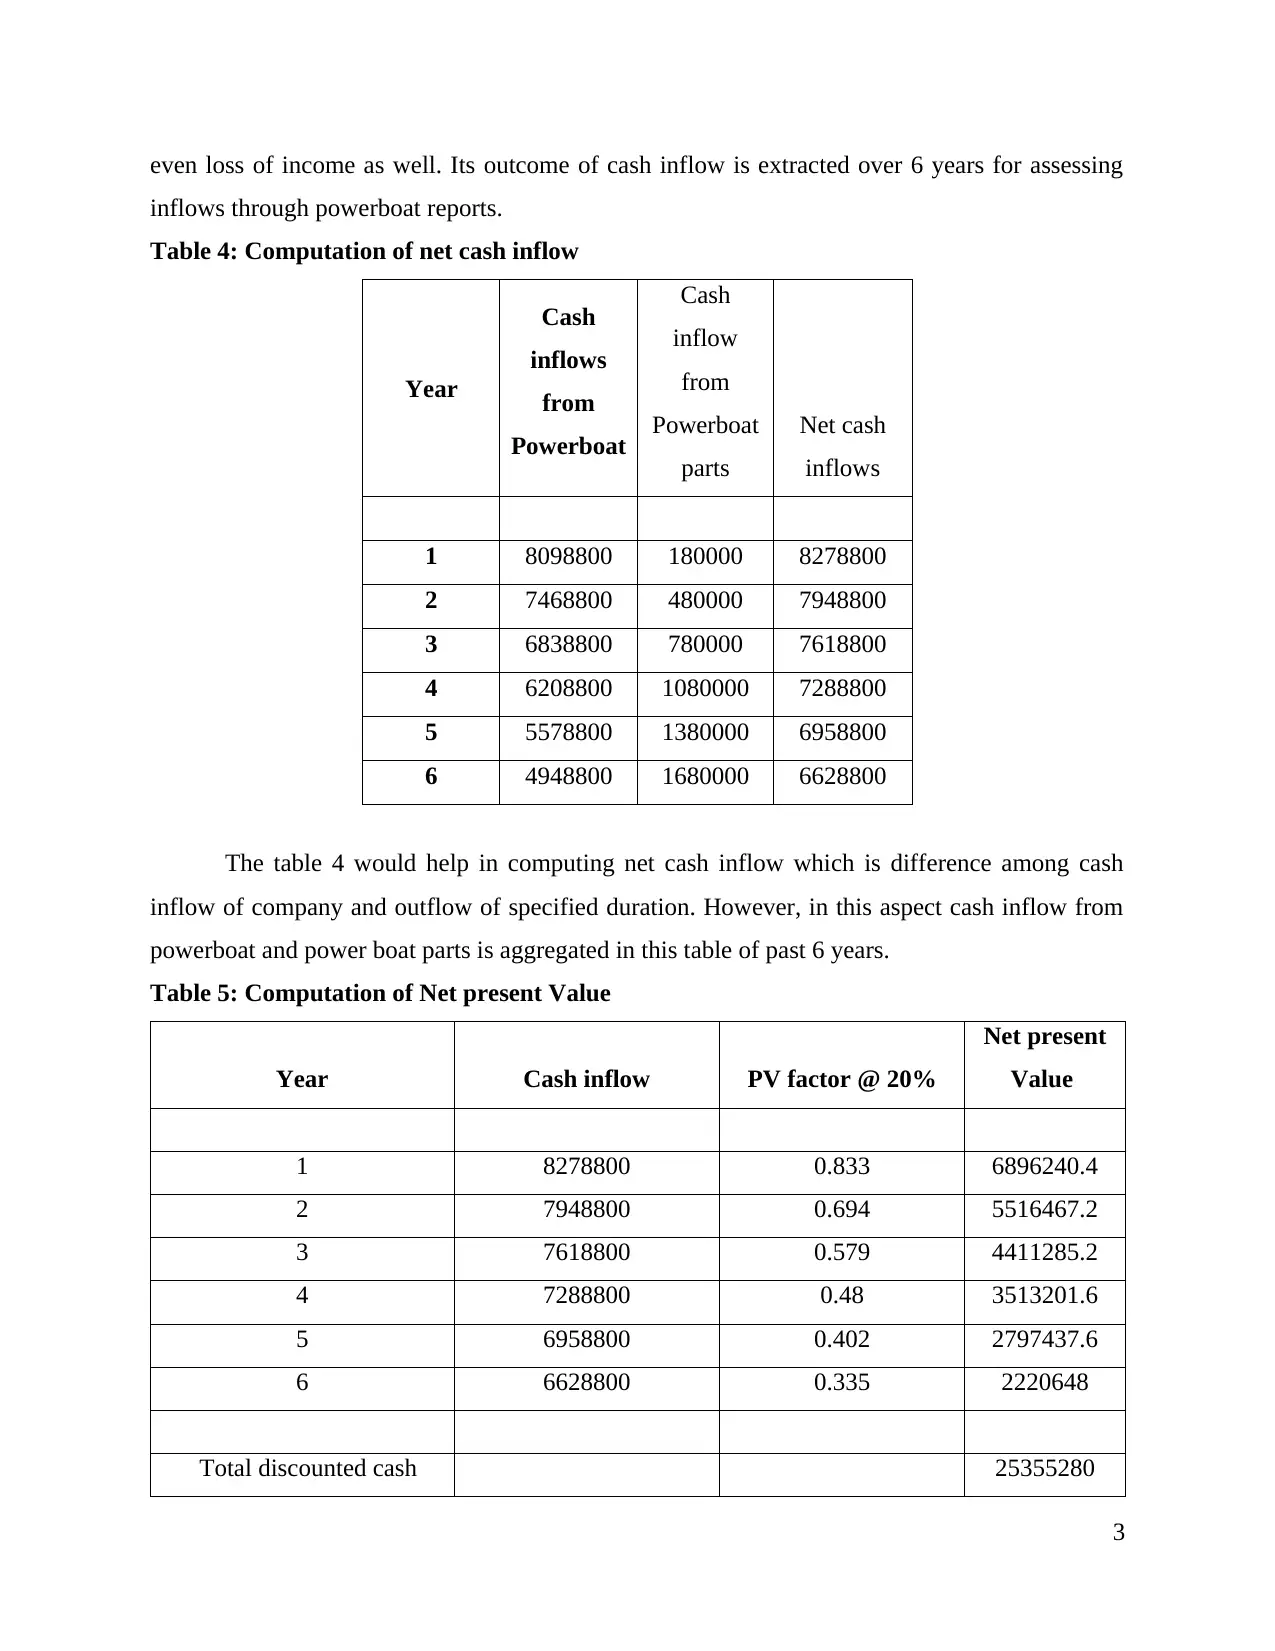
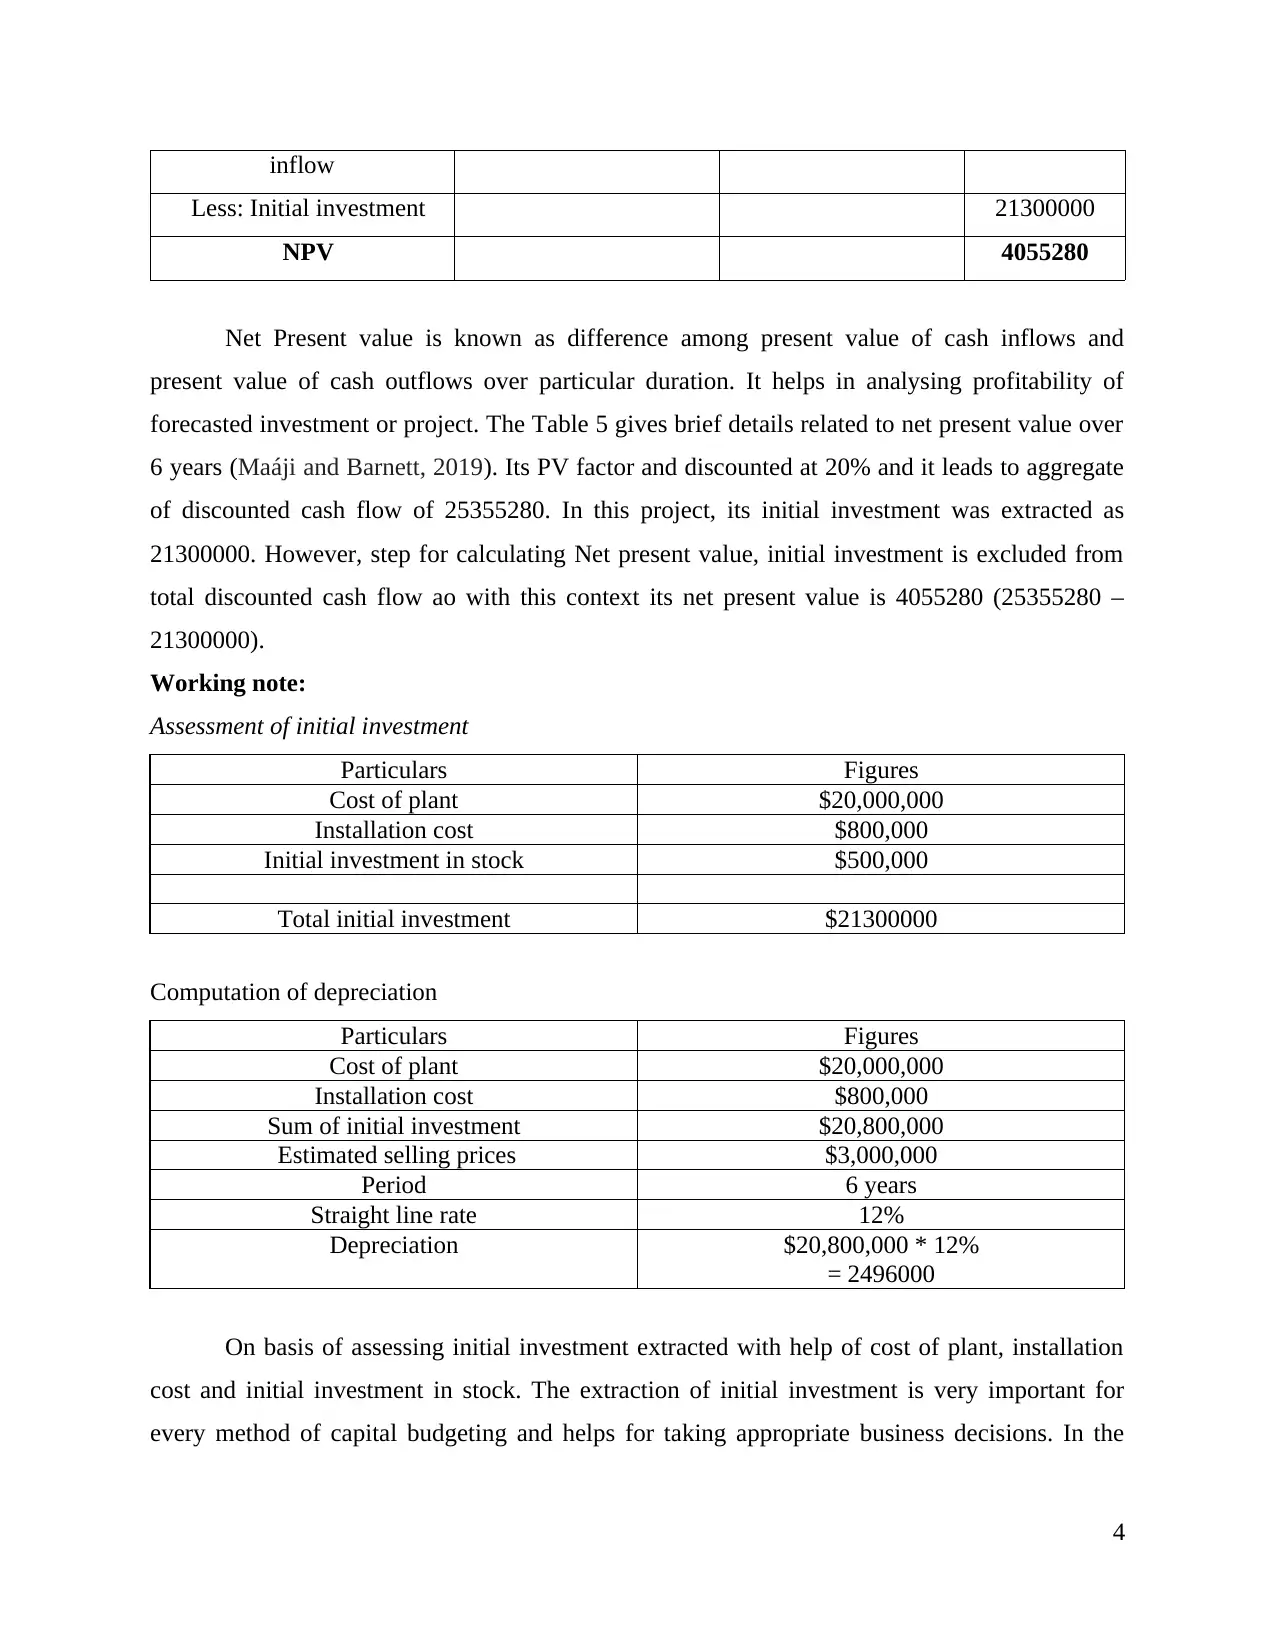
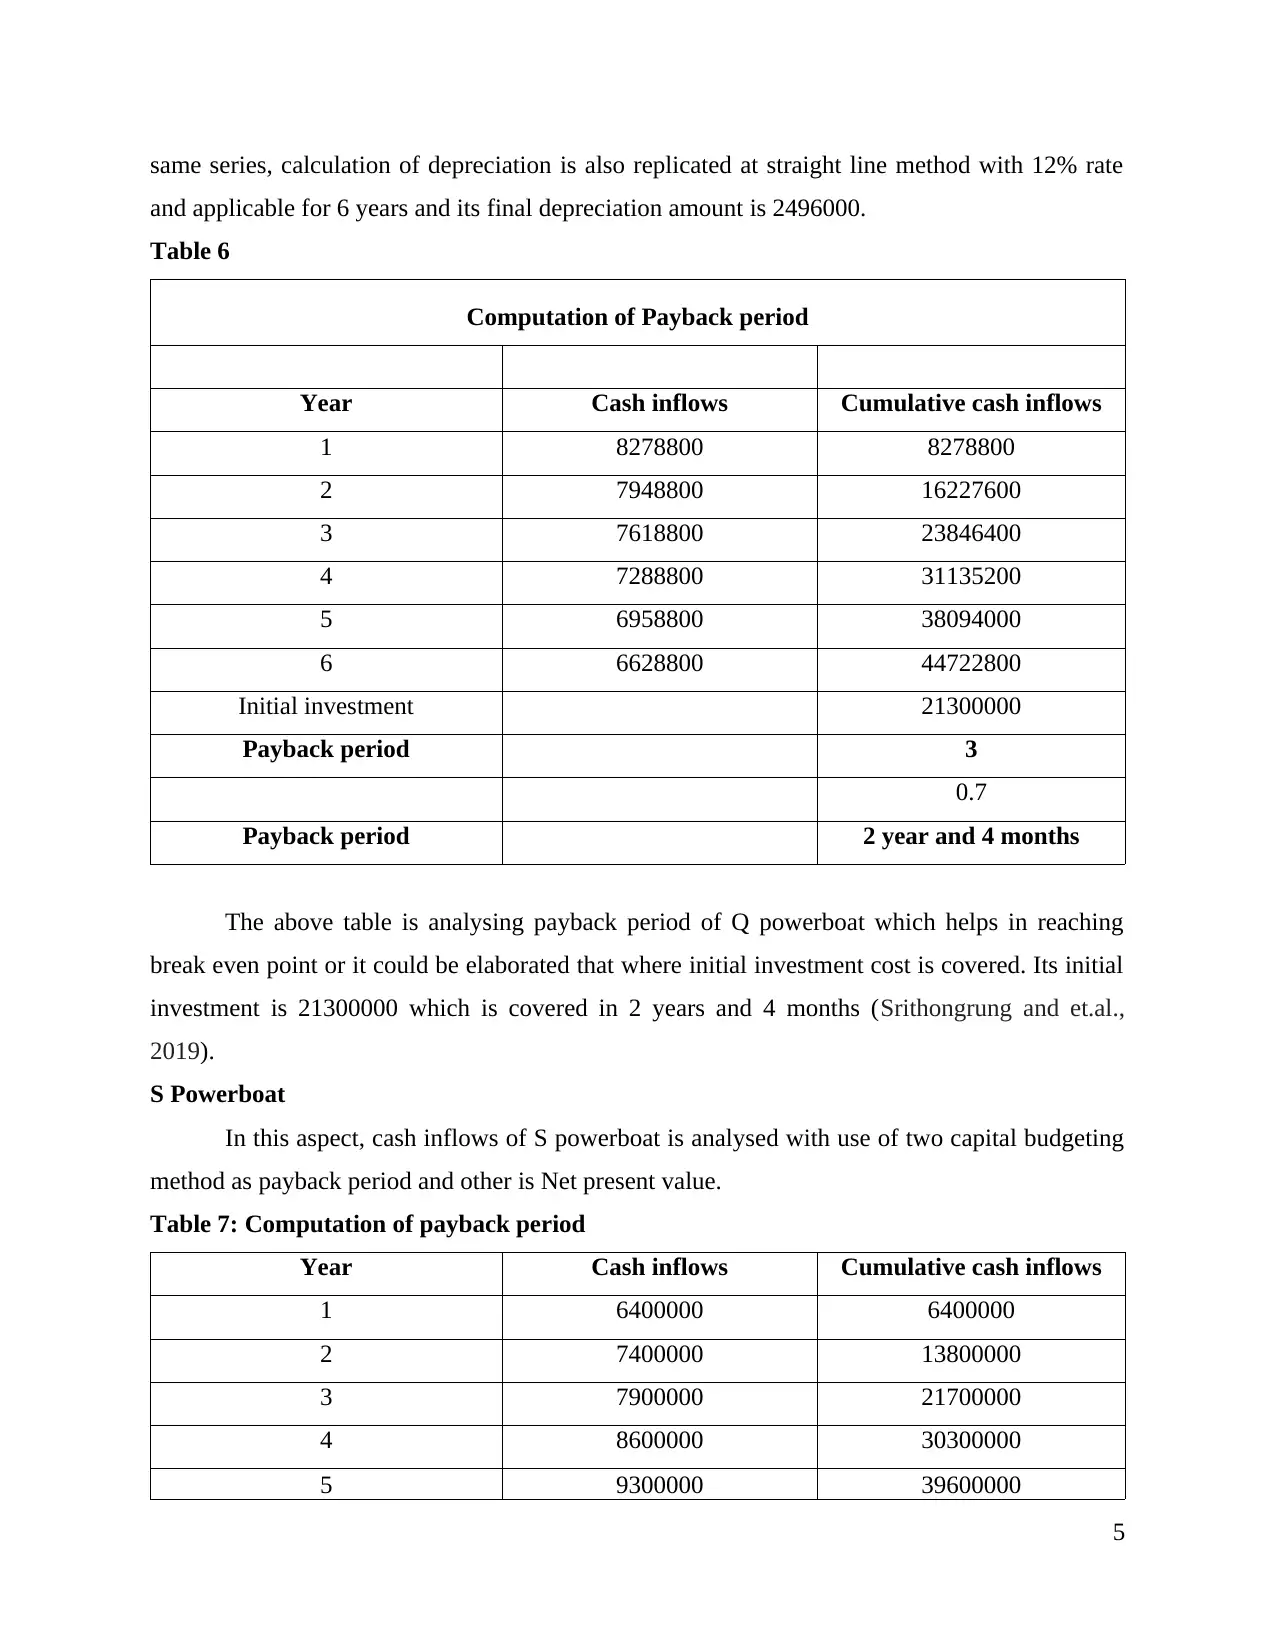
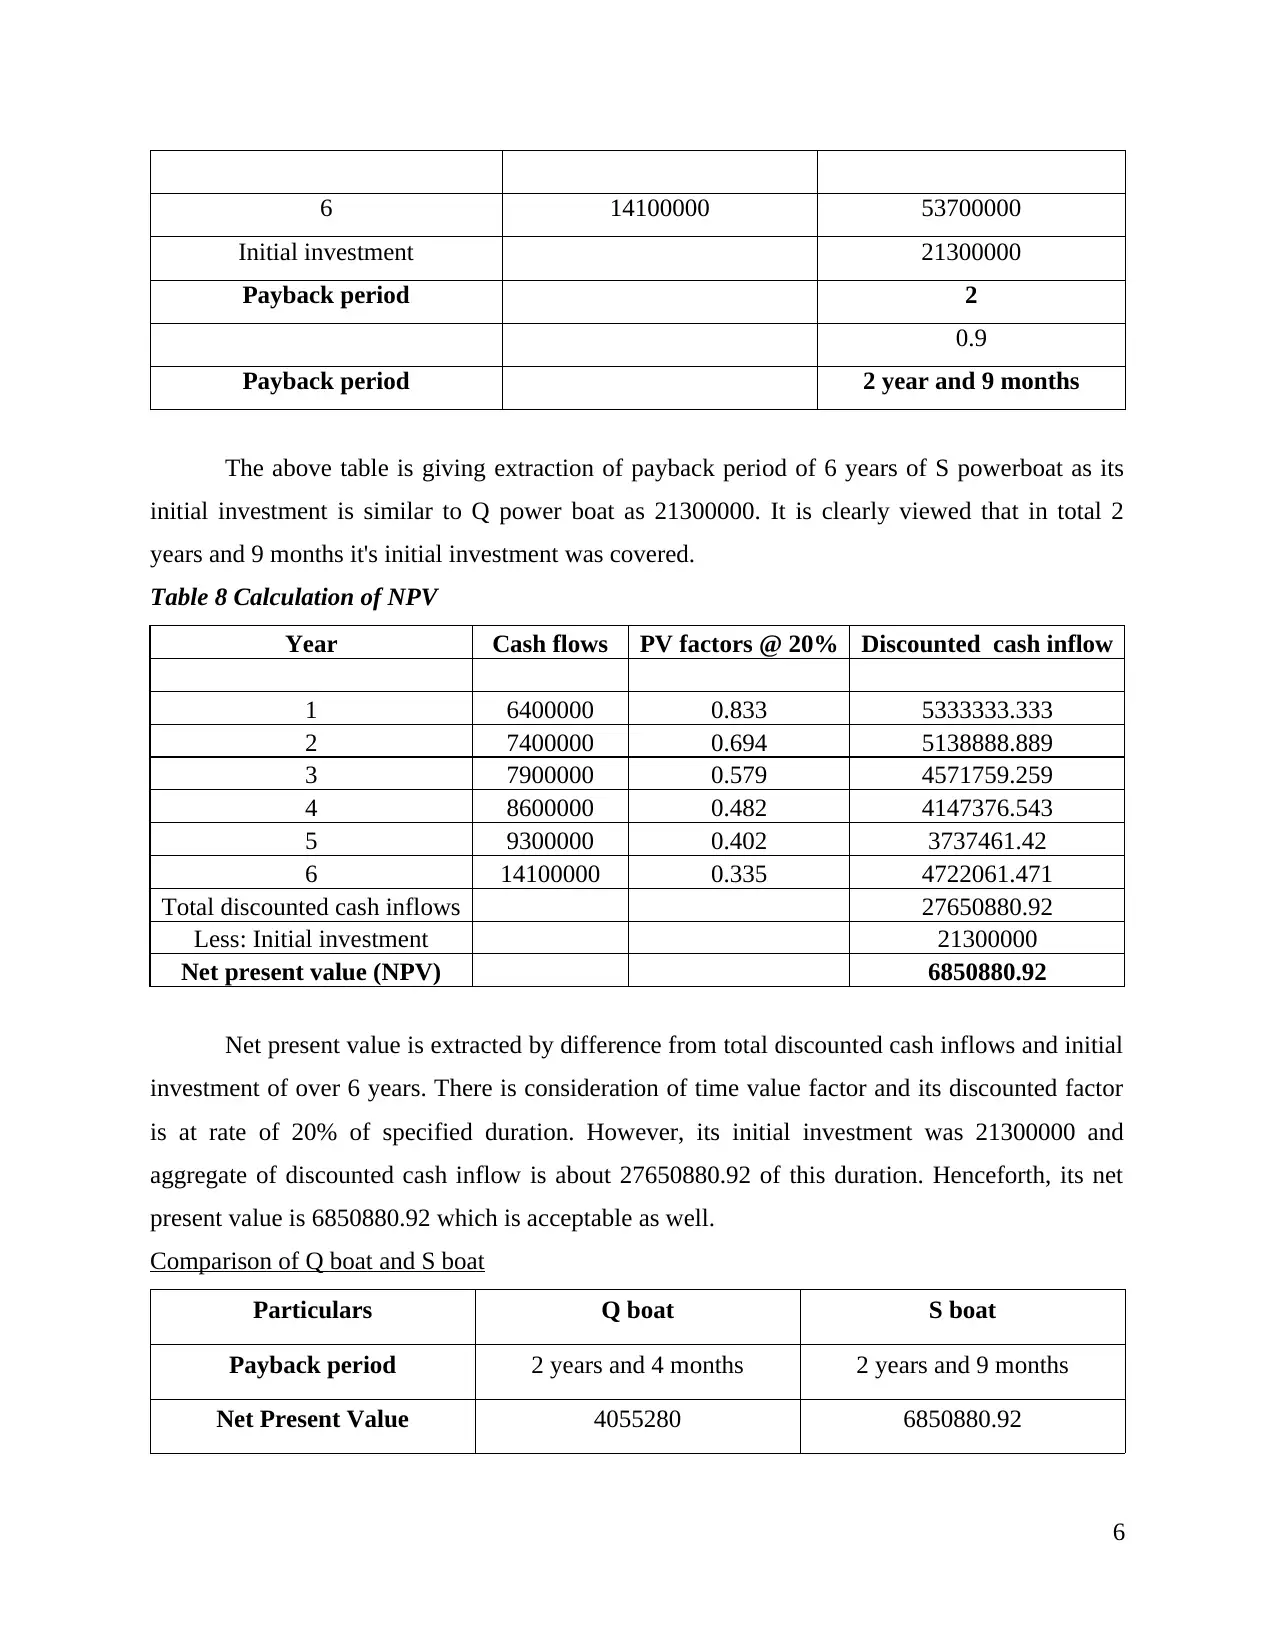
This report provides a detailed analysis of capital budgeting, focusing on two powerboat investment options, Q boat and S boat. It begins with an introduction to capital budgeting and its importance in evaluating potential investments, including building new plants and long-term projects. The report uses Excel spreadsheets to extract and analyze cash flows over a six-year period, considering factors like sales revenue, variable costs, fixed overheads, and depreciation to calculate EBIT and EAT. The report calculates cash inflows, net cash inflows, and net present value (NPV) for each boat, along with payback periods. The analysis includes working notes on initial investment and depreciation calculations. A comparison of the Q boat and S boat is provided, highlighting the payback period and NPV for each, and ultimately recommending the S powerboat for investment due to its higher NPV. The report concludes by emphasizing the importance of capital budgeting in strategic planning and decision-making, and it references relevant academic sources.

CAPITAL BUDGETING
REPORT
REPORT
Secure Best Marks with AI Grader
Need help grading? Try our AI Grader for instant feedback on your assignments.

TABLE OF CONTENTS
INTRODUCTION...........................................................................................................................1
Scenario.......................................................................................................................................1
Given that:...................................................................................................................................1
Extraction of cash flow...............................................................................................................1
Comparison of Q boat and S boat...............................................................................................6
CONCLUSION................................................................................................................................6
REFERENCES................................................................................................................................8

INTRODUCTION
Capital budgeting is replicated as process in which business evaluates and identifies
potential huge expenses along with investment. Generally, expenditures and investments
comprises projects like building a new plant or to invest in tenure for long term perspective. This
report will explain the fundamentals of corporate finance stemming through different underlying
theoretical and principles along with use of principles. Simultaneously, it will communicate
range of different arguments in discipline of corporate finance which is proper to audience, via
varietal communication media (Ermasova and Ebdon, 2019). However, this report is an problem
solving exercise with use of Excel spreadsheet and leads to high accuracy.
Scenario
Given that:
WACC or cost of capital: 20%
Tax rate: 30%
10% debenture of $10000000
Extraction of cash flow
Q Powerboat
Table 1
Ye
ar
Qu
anti
ty
Per
boat
price
Sales
revenue
Less:
Variable
cost @ 40%
Less: Fixed
factory
overhead
Less:
depreciation EBIT
1 650 30000 19500000 7800000 200000 2496000 9004000
2 600 30000 18000000 7200000 200000 2496000 8104000
3 550 30000 16500000 6600000 200000 2496000 7204000
4 500 30000 15000000 6000000 200000 2496000 6304000
5 450 30000 13500000 5400000 200000 2496000 5404000
6 400 30000 12000000 4800000 200000 2496000 4504000
The above scenario is depicting extraction of Earnings before interest and tax over 6
years with use of sales revenue. The per boat price has been specified which is multiplied with
quantity of total sale revenue. Further, variable cost has been excluded which is 40% of sales and
factory overhead is fixed 200000 over 6 years. Moreover, depreciation is extracted as 2496000
which is also excluded and it originated EBIT of Q Powerboat.
Table 2
1

Year EBIT
Less:
Interest EBT
tax @
30% EAT
Add:
Depreciatio
n
Cash
inflow
1 9004000 1000000 8004000
240120
0
560280
0 2496000
809880
0
2 8104000 1000000 7104000
213120
0
497280
0 2496000
746880
0
3 7204000 1000000 6204000
186120
0
434280
0 2496000
683880
0
4 6304000 1000000 5304000
159120
0
371280
0 2496000
620880
0
5 5404000 1000000 4404000
132120
0
308280
0 2496000
557880
0
6 4504000 1000000 3504000
105120
0
245280
0 2496000
494880
0
The table 2 is giving calculation of cash inflow which is extracted with EBIT calculated
in above scenario. At the first step, to reach EBT interest is excluded and to attain EAT 30% tax
was deducted as well (Mubashar and Tariq, 2019). Depreciation is considered as accounting
method to allocate cost of tangible asset over its useful life and is implicated for accounting for
declining value. It is a non cash accounting charge which does not affect amount of generated
cash flow by company. The final cash flow is calculated by adding depreciation in earnings after
tax.
Table 3: Assessment of inflows from powerboat parts:
Year Powerboat
cost
Variable
cost @
40%
Less: loss
of income Cash
inflow
1 500000 200000 120000 180000
2 1000000 400000 120000 480000
3 1500000 600000 120000 780000
4 2000000 800000 120000 1080000
5 2500000 1000000 120000 1380000
6 3000000 1200000 120000 1680000
The table 3 is reflecting assessment of inflows through parts of powerboat, as here cost of
powerboat is specified in 1st column and variable cost is at rate of 40% which is deducted and
2
Secure Best Marks with AI Grader
Need help grading? Try our AI Grader for instant feedback on your assignments.

even loss of income as well. Its outcome of cash inflow is extracted over 6 years for assessing
inflows through powerboat reports.
Table 4: Computation of net cash inflow
Year
Cash
inflows
from
Powerboat
Cash
inflow
from
Powerboat
parts
Net cash
inflows
1 8098800 180000 8278800
2 7468800 480000 7948800
3 6838800 780000 7618800
4 6208800 1080000 7288800
5 5578800 1380000 6958800
6 4948800 1680000 6628800
The table 4 would help in computing net cash inflow which is difference among cash
inflow of company and outflow of specified duration. However, in this aspect cash inflow from
powerboat and power boat parts is aggregated in this table of past 6 years.
Table 5: Computation of Net present Value
Year Cash inflow PV factor @ 20%
Net present
Value
1 8278800 0.833 6896240.4
2 7948800 0.694 5516467.2
3 7618800 0.579 4411285.2
4 7288800 0.48 3513201.6
5 6958800 0.402 2797437.6
6 6628800 0.335 2220648
Total discounted cash 25355280
3

inflow
Less: Initial investment 21300000
NPV 4055280
Net Present value is known as difference among present value of cash inflows and
present value of cash outflows over particular duration. It helps in analysing profitability of
forecasted investment or project. The Table 5 gives brief details related to net present value over
6 years (Maáji and Barnett, 2019). Its PV factor and discounted at 20% and it leads to aggregate
of discounted cash flow of 25355280. In this project, its initial investment was extracted as
21300000. However, step for calculating Net present value, initial investment is excluded from
total discounted cash flow ao with this context its net present value is 4055280 (25355280 –
21300000).
Working note:
Assessment of initial investment
Particulars Figures
Cost of plant $20,000,000
Installation cost $800,000
Initial investment in stock $500,000
Total initial investment $21300000
Computation of depreciation
Particulars Figures
Cost of plant $20,000,000
Installation cost $800,000
Sum of initial investment $20,800,000
Estimated selling prices $3,000,000
Period 6 years
Straight line rate 12%
Depreciation $20,800,000 * 12%
= 2496000
On basis of assessing initial investment extracted with help of cost of plant, installation
cost and initial investment in stock. The extraction of initial investment is very important for
every method of capital budgeting and helps for taking appropriate business decisions. In the
4

same series, calculation of depreciation is also replicated at straight line method with 12% rate
and applicable for 6 years and its final depreciation amount is 2496000.
Table 6
Computation of Payback period
Year Cash inflows Cumulative cash inflows
1 8278800 8278800
2 7948800 16227600
3 7618800 23846400
4 7288800 31135200
5 6958800 38094000
6 6628800 44722800
Initial investment 21300000
Payback period 3
0.7
Payback period 2 year and 4 months
The above table is analysing payback period of Q powerboat which helps in reaching
break even point or it could be elaborated that where initial investment cost is covered. Its initial
investment is 21300000 which is covered in 2 years and 4 months (Srithongrung and et.al.,
2019).
S Powerboat
In this aspect, cash inflows of S powerboat is analysed with use of two capital budgeting
method as payback period and other is Net present value.
Table 7: Computation of payback period
Year Cash inflows Cumulative cash inflows
1 6400000 6400000
2 7400000 13800000
3 7900000 21700000
4 8600000 30300000
5 9300000 39600000
5
Paraphrase This Document
Need a fresh take? Get an instant paraphrase of this document with our AI Paraphraser

6 14100000 53700000
Initial investment 21300000
Payback period 2
0.9
Payback period 2 year and 9 months
The above table is giving extraction of payback period of 6 years of S powerboat as its
initial investment is similar to Q power boat as 21300000. It is clearly viewed that in total 2
years and 9 months it's initial investment was covered.
Table 8 Calculation of NPV
Year Cash flows PV factors @ 20% Discounted cash inflow
1 6400000 0.833 5333333.333
2 7400000 0.694 5138888.889
3 7900000 0.579 4571759.259
4 8600000 0.482 4147376.543
5 9300000 0.402 3737461.42
6 14100000 0.335 4722061.471
Total discounted cash inflows 27650880.92
Less: Initial investment 21300000
Net present value (NPV) 6850880.92
Net present value is extracted by difference from total discounted cash inflows and initial
investment of over 6 years. There is consideration of time value factor and its discounted factor
is at rate of 20% of specified duration. However, its initial investment was 21300000 and
aggregate of discounted cash inflow is about 27650880.92 of this duration. Henceforth, its net
present value is 6850880.92 which is acceptable as well.
Comparison of Q boat and S boat
Particulars Q boat S boat
Payback period 2 years and 4 months 2 years and 9 months
Net Present Value 4055280 6850880.92
6

The above table is stating difference in Q powerboat and S powerboat, or in simple
words, which project is favourable to organization and gives high benefit with similar initial
investment of 21300000. On basis of pay back period, Q power boat is highly advantageous
because of fast recovery of initial investment cost as it has variation of 5 months. On the
contrary, with consideration of net present value S powerboat is acceptable because of high
positive value as compared to Q power boat (Srithongrung, Yusuf and Kriz, 2019). Henceforth,
it has been recommended to select S powerboat for investment because it has high net present
value and it considers time value of money as well. The payback period does not involve time
factor which is great limitation because in the present scenario, it is most important factor for
attaining success and make business decisions.
CONCLUSION
On basis of above report, it could be concluded that capital budgeting helps in
undertaking various business decision and for making strategic plans. It has shown stepwise
calculation for extracting cash flow and it has also shown importance of depreciation for
analysing business strategic decisions. Thus, it has articulated importance of time value of
money concept and here S powerboat is suggested to investment and for benefit.
7

REFERENCES
Books and Journals
Ermasova, N. B. and Ebdon, C., 2019. The Case of Public Capital Budgeting and Management
Processes in the United States. In Capital Management and Budgeting in the Public
Sector (pp. 23-48). IGI Global.
Maáji, M. M. and Barnett, C., 2019. Determinants of Capital Budgeting Practices and Risks
Adjustment among Cambodian Companies. Archives of Business Research. 7(3).
Mubashar, A. and Tariq, Y.B., 2019. Capital budgeting decision-making practices: evidence
from Pakistan. Journal of Advances in Management Research. 16(2). pp.142-167.
Srithongrung, A., Yusuf, J. E. W. and Kriz, K. A., 2019. A systematic public capital
management and budgeting process. In Capital management and budgeting in the public
sector (pp. 1-22). IGI Global.
Srithongrung, A.and et.al., 2019. Capital management and budgeting in the public sector. IGI
Global.
8
1 out of 10
Related Documents

Your All-in-One AI-Powered Toolkit for Academic Success.
+13062052269
info@desklib.com
Available 24*7 on WhatsApp / Email
Unlock your academic potential
© 2024 | Zucol Services PVT LTD | All rights reserved.