Financial Management Report: Analysis of Pentag's Powerboat Projects
VerifiedAdded on 2022/12/30
|10
|2052
|24
Report
AI Summary
This financial management report assesses the viability of two powerboat projects, Q-Powerboat and S-Powerboat, for the Pentag Company. The analysis includes a detailed examination of financial metrics such as Net Present Value (NPV), Internal Rate of Return (IRR), and discounted payback period for each project. The report evaluates the quantitative and qualitative aspects of the Q-Powerboat project, comparing its performance with the S-Powerboat project, which is considered more environmentally friendly. The study also calculates the crossover rate, which identifies the point at which the projects' NPVs are equal. The conclusion recommends against pursuing either project because their discounted payback periods exceed the company's required timeframe, despite both projects meeting other financial acceptance criteria. The report incorporates financial tables, calculations, and references to support its findings and recommendations.

Running head: FINANCIAL MANAGEMENT
Financial management
Name of the student
Name of the university
Student ID
Author note
Financial management
Name of the student
Name of the university
Student ID
Author note
Paraphrase This Document
Need a fresh take? Get an instant paraphrase of this document with our AI Paraphraser
1FINANCIAL MANAGEMENT
Table of Contents
Introduction................................................................................................................................2
Findings......................................................................................................................................2
Findings from the Q-Powerboat project.................................................................................2
Quantitative aspect.................................................................................................................3
Qualitative aspect...................................................................................................................5
Finding and comparison with S-Powerboat project...............................................................5
Cross over rate........................................................................................................................6
Conclusion and recommendation...............................................................................................7
Reference....................................................................................................................................8
Appendix....................................................................................................................................9
2FINANCIAL MANAGEMENT
Introduction
Pentag company is engaged in producing the small power boats and is currently
facing the challenges regarding building and marketing the environment friendly green
powerboat. The objective of the report is to analyse the new project Q-Powerboat that is
expected to leave carbon footprint in water. Apart from that the report will also focus on
another project S-Powerboat that is identified by the entity to be more environment-friendly
(DeFusco et al. 2015).
Findings
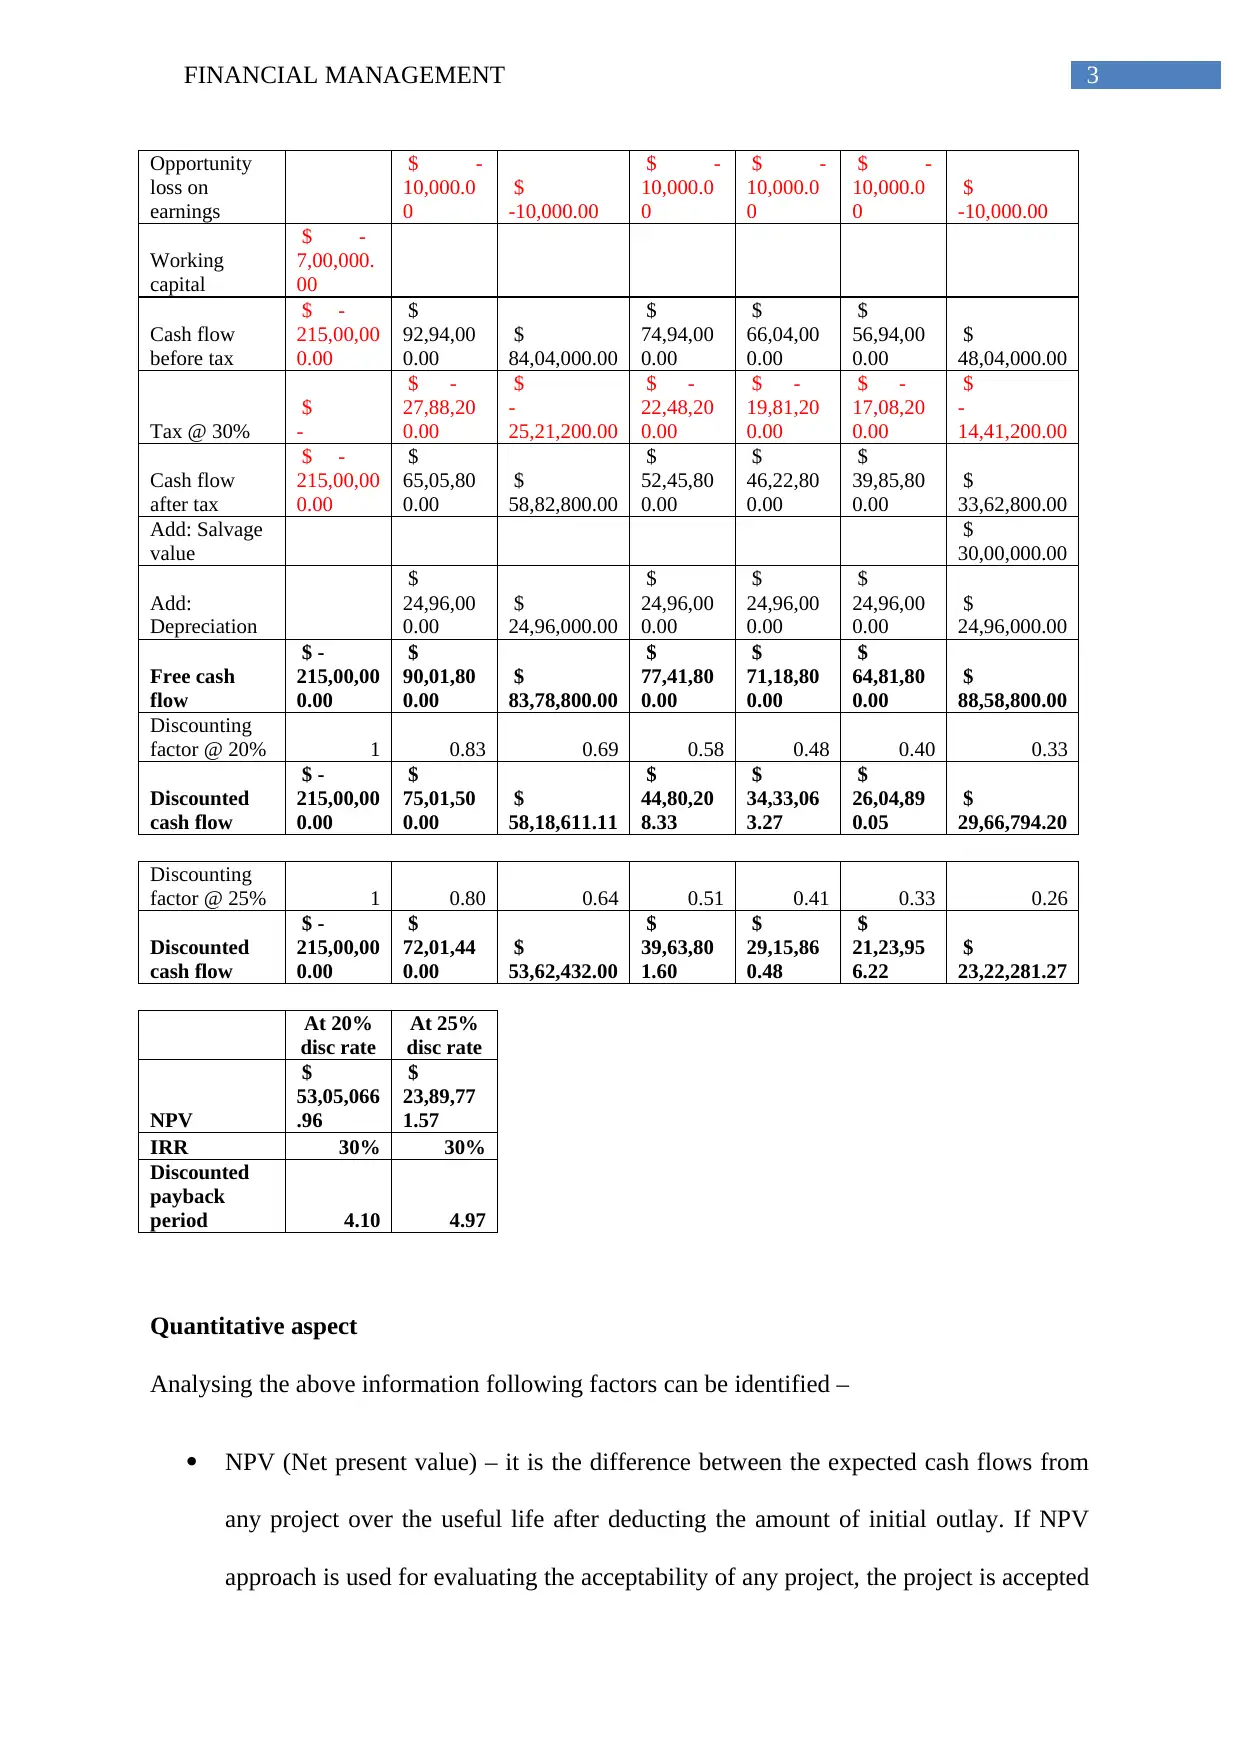
Findings from the Q-Powerboat project
Analysis of Q-
Powerboat
Year 0 1 2 3 4 5 6
Cost of
equipment
$ -
200,00,00
0.00
Installation
cost of
equipment
$ -
8,00,000.
00
Sales in units 650.00 600.00 550.00 500.00 450.00 400.00
selling price
per unit
$
30,000.0
0
$
30,000.00
$
30,000.0
0
$
30,000.0
0
$
30,000.0
0
$
30,000.00
Sales revenue
$
195,00,0
00.00
$
180,00,000.0
0
$
165,00,0
00.00
$
150,00,0
00.00
$
135,00,0
00.00
$
120,00,000.0
0
Variable cost
$ -
78,00,00
0.00
$
-
72,00,000.00
$ -
66,00,00
0.00
$ -
60,00,00
0.00
$ -
54,00,00
0.00
$
-
48,00,000.00
Fixed cost
$ -
2,00,000.
00
$
-2,00,000.00
$ -
2,00,000.
00
$ -
2,00,000.
00
$ -
2,00,000.
00
$
-2,00,000.00
Depreciation
$ -
24,96,00
0.00
$
-
24,96,000.00
$ -
24,96,00
0.00
$ -
24,96,00
0.00
$ -
24,96,00
0.00
$
-
24,96,000.00
opportunity
sales revenue
$
5,00,000.
00
$
5,00,000.00
$
5,00,000.
00
$
5,00,000.
00
$
5,00,000.
00
$
5,00,000.00
Cost of
production
$ -
2,00,000.
00
$
-2,00,000.00
$ -
2,00,000.
00
$ -
2,00,000.
00
$ -
2,00,000.
00
$
-2,00,000.00
Introduction
Pentag company is engaged in producing the small power boats and is currently
facing the challenges regarding building and marketing the environment friendly green
powerboat. The objective of the report is to analyse the new project Q-Powerboat that is
expected to leave carbon footprint in water. Apart from that the report will also focus on
another project S-Powerboat that is identified by the entity to be more environment-friendly
(DeFusco et al. 2015).
Findings
Findings from the Q-Powerboat project
Analysis of Q-
Powerboat
Year 0 1 2 3 4 5 6
Cost of
equipment
$ -
200,00,00
0.00
Installation
cost of
equipment
$ -
8,00,000.
00
Sales in units 650.00 600.00 550.00 500.00 450.00 400.00
selling price
per unit
$
30,000.0
0
$
30,000.00
$
30,000.0
0
$
30,000.0
0
$
30,000.0
0
$
30,000.00
Sales revenue
$
195,00,0
00.00
$
180,00,000.0
0
$
165,00,0
00.00
$
150,00,0
00.00
$
135,00,0
00.00
$
120,00,000.0
0
Variable cost
$ -
78,00,00
0.00
$
-
72,00,000.00
$ -
66,00,00
0.00
$ -
60,00,00
0.00
$ -
54,00,00
0.00
$
-
48,00,000.00
Fixed cost
$ -
2,00,000.
00
$
-2,00,000.00
$ -
2,00,000.
00
$ -
2,00,000.
00
$ -
2,00,000.
00
$
-2,00,000.00
Depreciation
$ -
24,96,00
0.00
$
-
24,96,000.00
$ -
24,96,00
0.00
$ -
24,96,00
0.00
$ -
24,96,00
0.00
$
-
24,96,000.00
opportunity
sales revenue
$
5,00,000.
00
$
5,00,000.00
$
5,00,000.
00
$
5,00,000.
00
$
5,00,000.
00
$
5,00,000.00
Cost of
production
$ -
2,00,000.
00
$
-2,00,000.00
$ -
2,00,000.
00
$ -
2,00,000.
00
$ -
2,00,000.
00
$
-2,00,000.00
⊘ This is a preview!⊘
Do you want full access?
Subscribe today to unlock all pages.
Trusted by 1+ million students worldwide
3FINANCIAL MANAGEMENT
Opportunity
loss on
earnings
$ -
10,000.0
0
$
-10,000.00
$ -
10,000.0
0
$ -
10,000.0
0
$ -
10,000.0
0
$
-10,000.00
Working
capital
$ -
7,00,000.
00
Cash flow
before tax
$ -
215,00,00
0.00
$
92,94,00
0.00
$
84,04,000.00
$
74,94,00
0.00
$
66,04,00
0.00
$
56,94,00
0.00
$
48,04,000.00
Tax @ 30%
$
-
$ -
27,88,20
0.00
$
-
25,21,200.00
$ -
22,48,20
0.00
$ -
19,81,20
0.00
$ -
17,08,20
0.00
$
-
14,41,200.00
Cash flow
after tax
$ -
215,00,00
0.00
$
65,05,80
0.00
$
58,82,800.00
$
52,45,80
0.00
$
46,22,80
0.00
$
39,85,80
0.00
$
33,62,800.00
Add: Salvage
value
$
30,00,000.00
Add:
Depreciation
$
24,96,00
0.00
$
24,96,000.00
$
24,96,00
0.00
$
24,96,00
0.00
$
24,96,00
0.00
$
24,96,000.00
Free cash
flow
$ -
215,00,00
0.00
$
90,01,80
0.00
$
83,78,800.00
$
77,41,80
0.00
$
71,18,80
0.00
$
64,81,80
0.00
$
88,58,800.00
Discounting
factor @ 20% 1 0.83 0.69 0.58 0.48 0.40 0.33
Discounted
cash flow
$ -
215,00,00
0.00
$
75,01,50
0.00
$
58,18,611.11
$
44,80,20
8.33
$
34,33,06
3.27
$
26,04,89
0.05
$
29,66,794.20
Discounting
factor @ 25% 1 0.80 0.64 0.51 0.41 0.33 0.26
Discounted
cash flow
$ -
215,00,00
0.00
$
72,01,44
0.00
$
53,62,432.00
$
39,63,80
1.60
$
29,15,86
0.48
$
21,23,95
6.22
$
23,22,281.27
At 20%
disc rate
At 25%
disc rate
NPV
$
53,05,066
.96
$
23,89,77
1.57
IRR 30% 30%
Discounted
payback
period 4.10 4.97
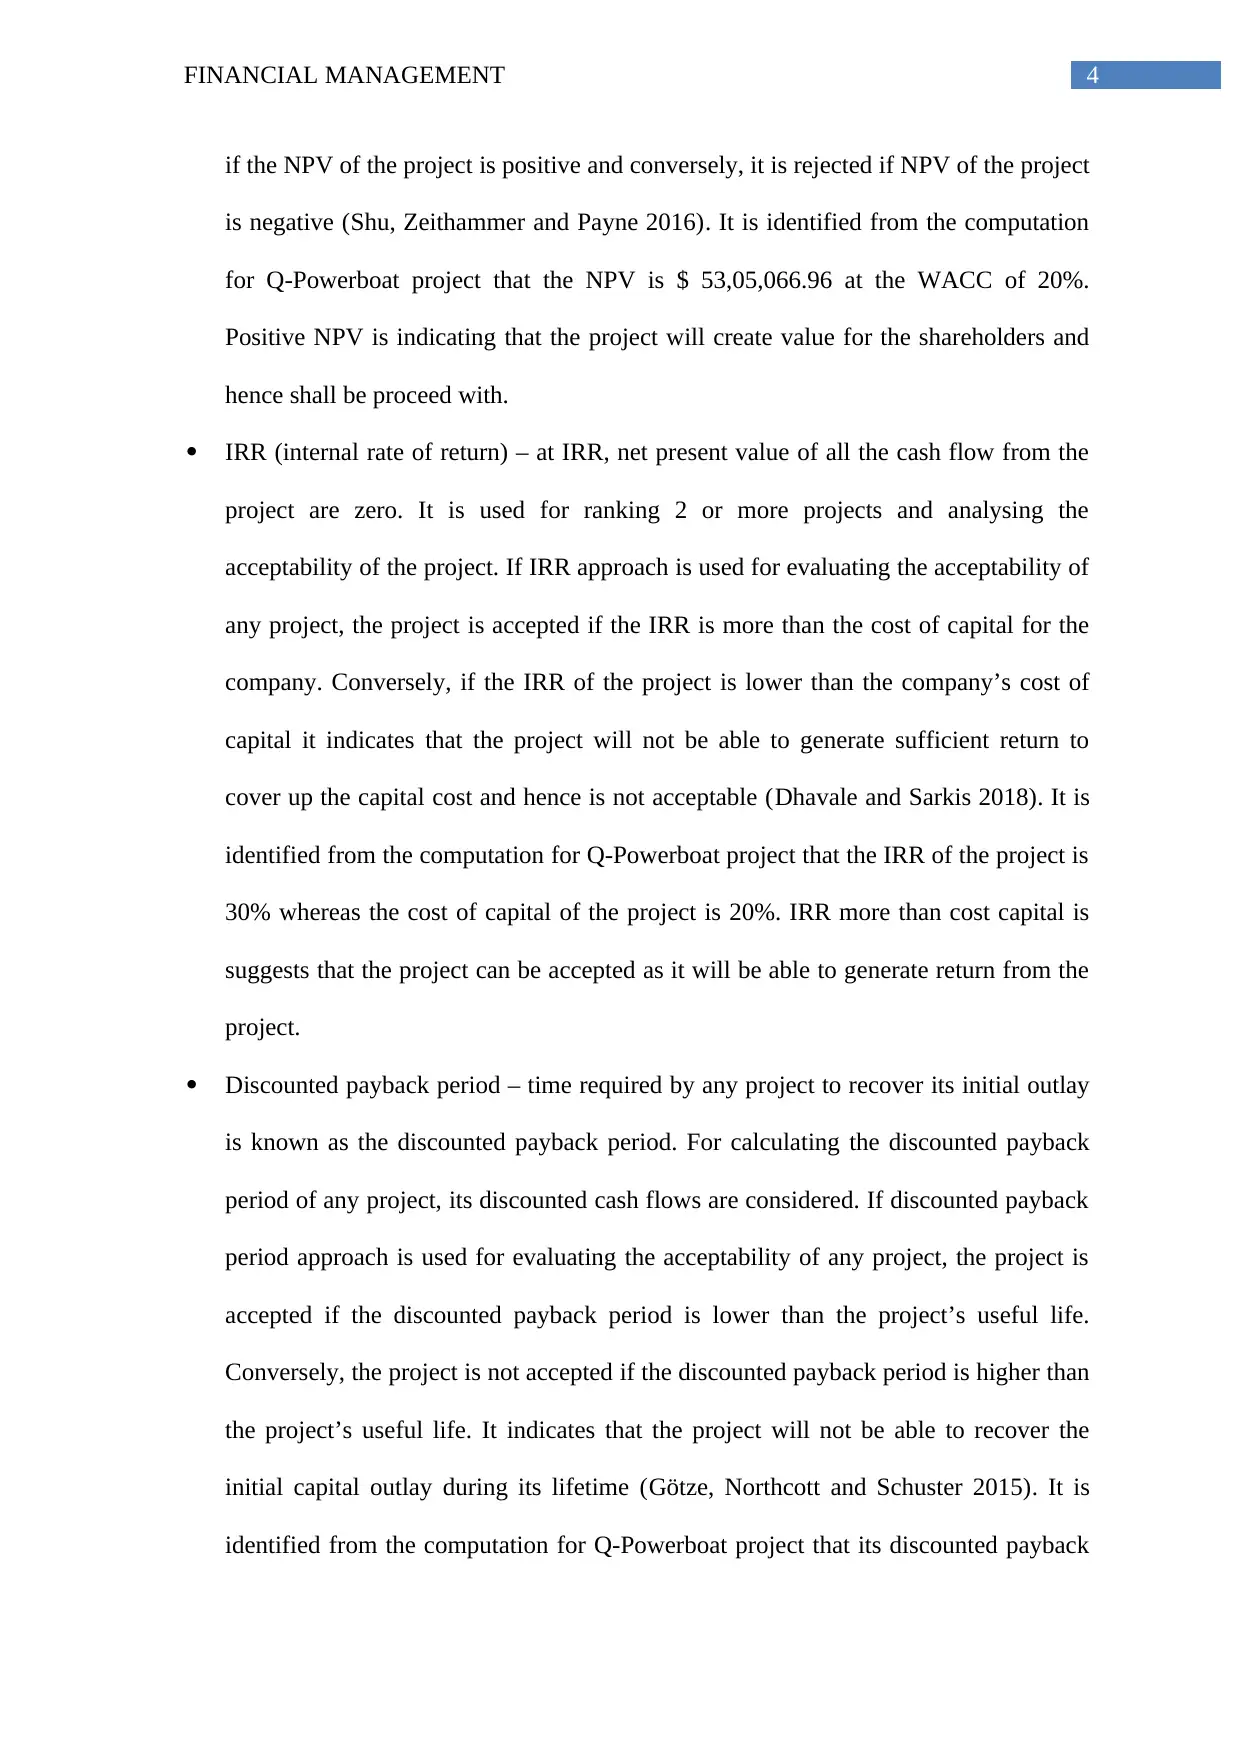
Quantitative aspect
Analysing the above information following factors can be identified –
NPV (Net present value) – it is the difference between the expected cash flows from
any project over the useful life after deducting the amount of initial outlay. If NPV
approach is used for evaluating the acceptability of any project, the project is accepted
Opportunity
loss on
earnings
$ -
10,000.0
0
$
-10,000.00
$ -
10,000.0
0
$ -
10,000.0
0
$ -
10,000.0
0
$
-10,000.00
Working
capital
$ -
7,00,000.
00
Cash flow
before tax
$ -
215,00,00
0.00
$
92,94,00
0.00
$
84,04,000.00
$
74,94,00
0.00
$
66,04,00
0.00
$
56,94,00
0.00
$
48,04,000.00
Tax @ 30%
$
-
$ -
27,88,20
0.00
$
-
25,21,200.00
$ -
22,48,20
0.00
$ -
19,81,20
0.00
$ -
17,08,20
0.00
$
-
14,41,200.00
Cash flow
after tax
$ -
215,00,00
0.00
$
65,05,80
0.00
$
58,82,800.00
$
52,45,80
0.00
$
46,22,80
0.00
$
39,85,80
0.00
$
33,62,800.00
Add: Salvage
value
$
30,00,000.00
Add:
Depreciation
$
24,96,00
0.00
$
24,96,000.00
$
24,96,00
0.00
$
24,96,00
0.00
$
24,96,00
0.00
$
24,96,000.00
Free cash
flow
$ -
215,00,00
0.00
$
90,01,80
0.00
$
83,78,800.00
$
77,41,80
0.00
$
71,18,80
0.00
$
64,81,80
0.00
$
88,58,800.00
Discounting
factor @ 20% 1 0.83 0.69 0.58 0.48 0.40 0.33
Discounted
cash flow
$ -
215,00,00
0.00
$
75,01,50
0.00
$
58,18,611.11
$
44,80,20
8.33
$
34,33,06
3.27
$
26,04,89
0.05
$
29,66,794.20
Discounting
factor @ 25% 1 0.80 0.64 0.51 0.41 0.33 0.26
Discounted
cash flow
$ -
215,00,00
0.00
$
72,01,44
0.00
$
53,62,432.00
$
39,63,80
1.60
$
29,15,86
0.48
$
21,23,95
6.22
$
23,22,281.27
At 20%
disc rate
At 25%
disc rate
NPV
$
53,05,066
.96
$
23,89,77
1.57
IRR 30% 30%
Discounted
payback
period 4.10 4.97
Quantitative aspect
Analysing the above information following factors can be identified –
NPV (Net present value) – it is the difference between the expected cash flows from
any project over the useful life after deducting the amount of initial outlay. If NPV
approach is used for evaluating the acceptability of any project, the project is accepted
Paraphrase This Document
Need a fresh take? Get an instant paraphrase of this document with our AI Paraphraser
4FINANCIAL MANAGEMENT
if the NPV of the project is positive and conversely, it is rejected if NPV of the project
is negative (Shu, Zeithammer and Payne 2016). It is identified from the computation
for Q-Powerboat project that the NPV is $ 53,05,066.96 at the WACC of 20%.
Positive NPV is indicating that the project will create value for the shareholders and
hence shall be proceed with.
IRR (internal rate of return) – at IRR, net present value of all the cash flow from the
project are zero. It is used for ranking 2 or more projects and analysing the
acceptability of the project. If IRR approach is used for evaluating the acceptability of
any project, the project is accepted if the IRR is more than the cost of capital for the
company. Conversely, if the IRR of the project is lower than the company’s cost of
capital it indicates that the project will not be able to generate sufficient return to
cover up the capital cost and hence is not acceptable (Dhavale and Sarkis 2018). It is
identified from the computation for Q-Powerboat project that the IRR of the project is
30% whereas the cost of capital of the project is 20%. IRR more than cost capital is
suggests that the project can be accepted as it will be able to generate return from the
project.
Discounted payback period – time required by any project to recover its initial outlay
is known as the discounted payback period. For calculating the discounted payback
period of any project, its discounted cash flows are considered. If discounted payback
period approach is used for evaluating the acceptability of any project, the project is
accepted if the discounted payback period is lower than the project’s useful life.
Conversely, the project is not accepted if the discounted payback period is higher than
the project’s useful life. It indicates that the project will not be able to recover the
initial capital outlay during its lifetime (Götze, Northcott and Schuster 2015). It is
identified from the computation for Q-Powerboat project that its discounted payback
5FINANCIAL MANAGEMENT
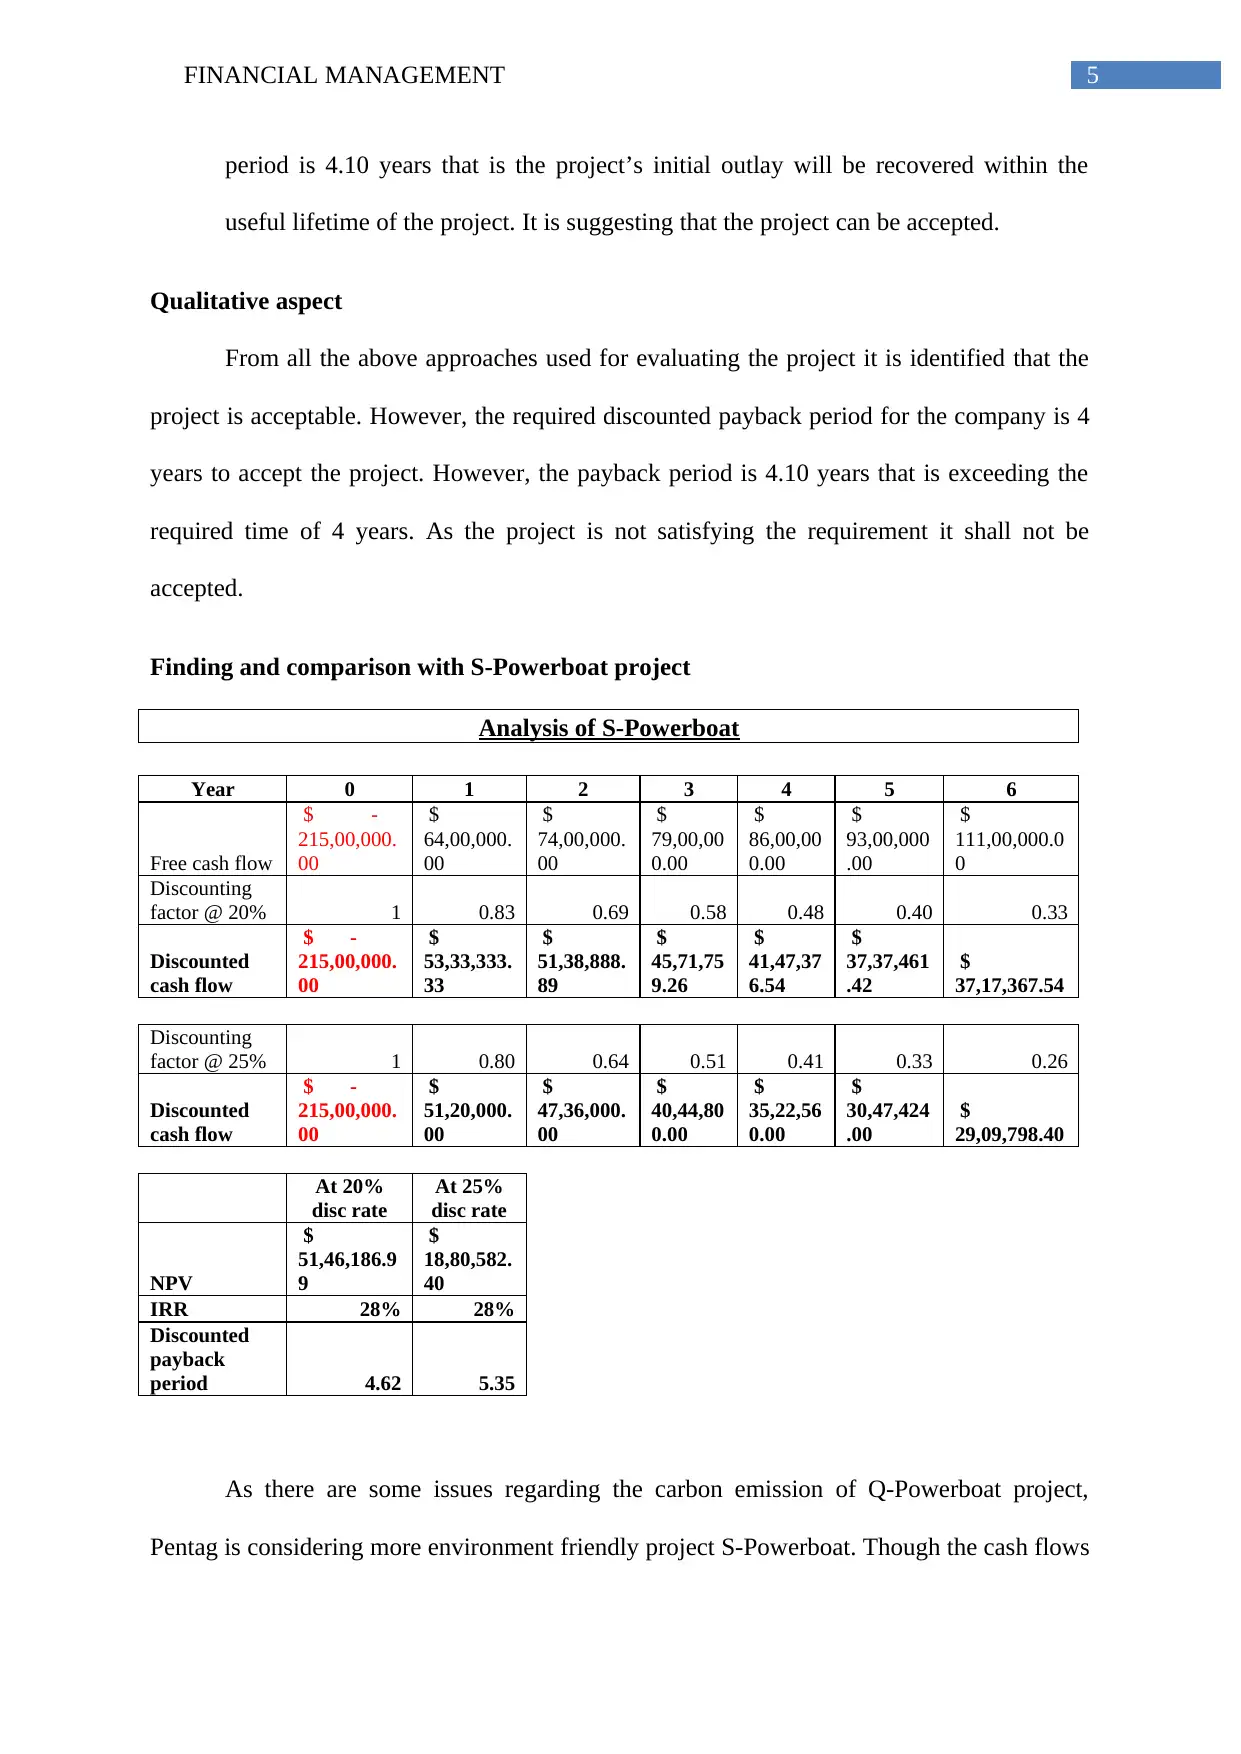
period is 4.10 years that is the project’s initial outlay will be recovered within the
useful lifetime of the project. It is suggesting that the project can be accepted.
Qualitative aspect
From all the above approaches used for evaluating the project it is identified that the
project is acceptable. However, the required discounted payback period for the company is 4
years to accept the project. However, the payback period is 4.10 years that is exceeding the
required time of 4 years. As the project is not satisfying the requirement it shall not be
accepted.
Finding and comparison with S-Powerboat project
Analysis of S-Powerboat
Year 0 1 2 3 4 5 6
Free cash flow
$ -
215,00,000.
00
$
64,00,000.
00
$
74,00,000.
00
$
79,00,00
0.00
$
86,00,00
0.00
$
93,00,000
.00
$
111,00,000.0
0
Discounting
factor @ 20% 1 0.83 0.69 0.58 0.48 0.40 0.33
Discounted
cash flow
$ -
215,00,000.
00
$
53,33,333.
33
$
51,38,888.
89
$
45,71,75
9.26
$
41,47,37
6.54
$
37,37,461
.42
$
37,17,367.54
Discounting
factor @ 25% 1 0.80 0.64 0.51 0.41 0.33 0.26
Discounted
cash flow
$ -
215,00,000.
00
$
51,20,000.
00
$
47,36,000.
00
$
40,44,80
0.00
$
35,22,56
0.00
$
30,47,424
.00
$
29,09,798.40
At 20%
disc rate
At 25%
disc rate
NPV
$
51,46,186.9
9
$
18,80,582.
40
IRR 28% 28%
Discounted
payback
period 4.62 5.35
As there are some issues regarding the carbon emission of Q-Powerboat project,
Pentag is considering more environment friendly project S-Powerboat. Though the cash flows
⊘ This is a preview!⊘
Do you want full access?
Subscribe today to unlock all pages.
Trusted by 1+ million students worldwide
6FINANCIAL MANAGEMENT
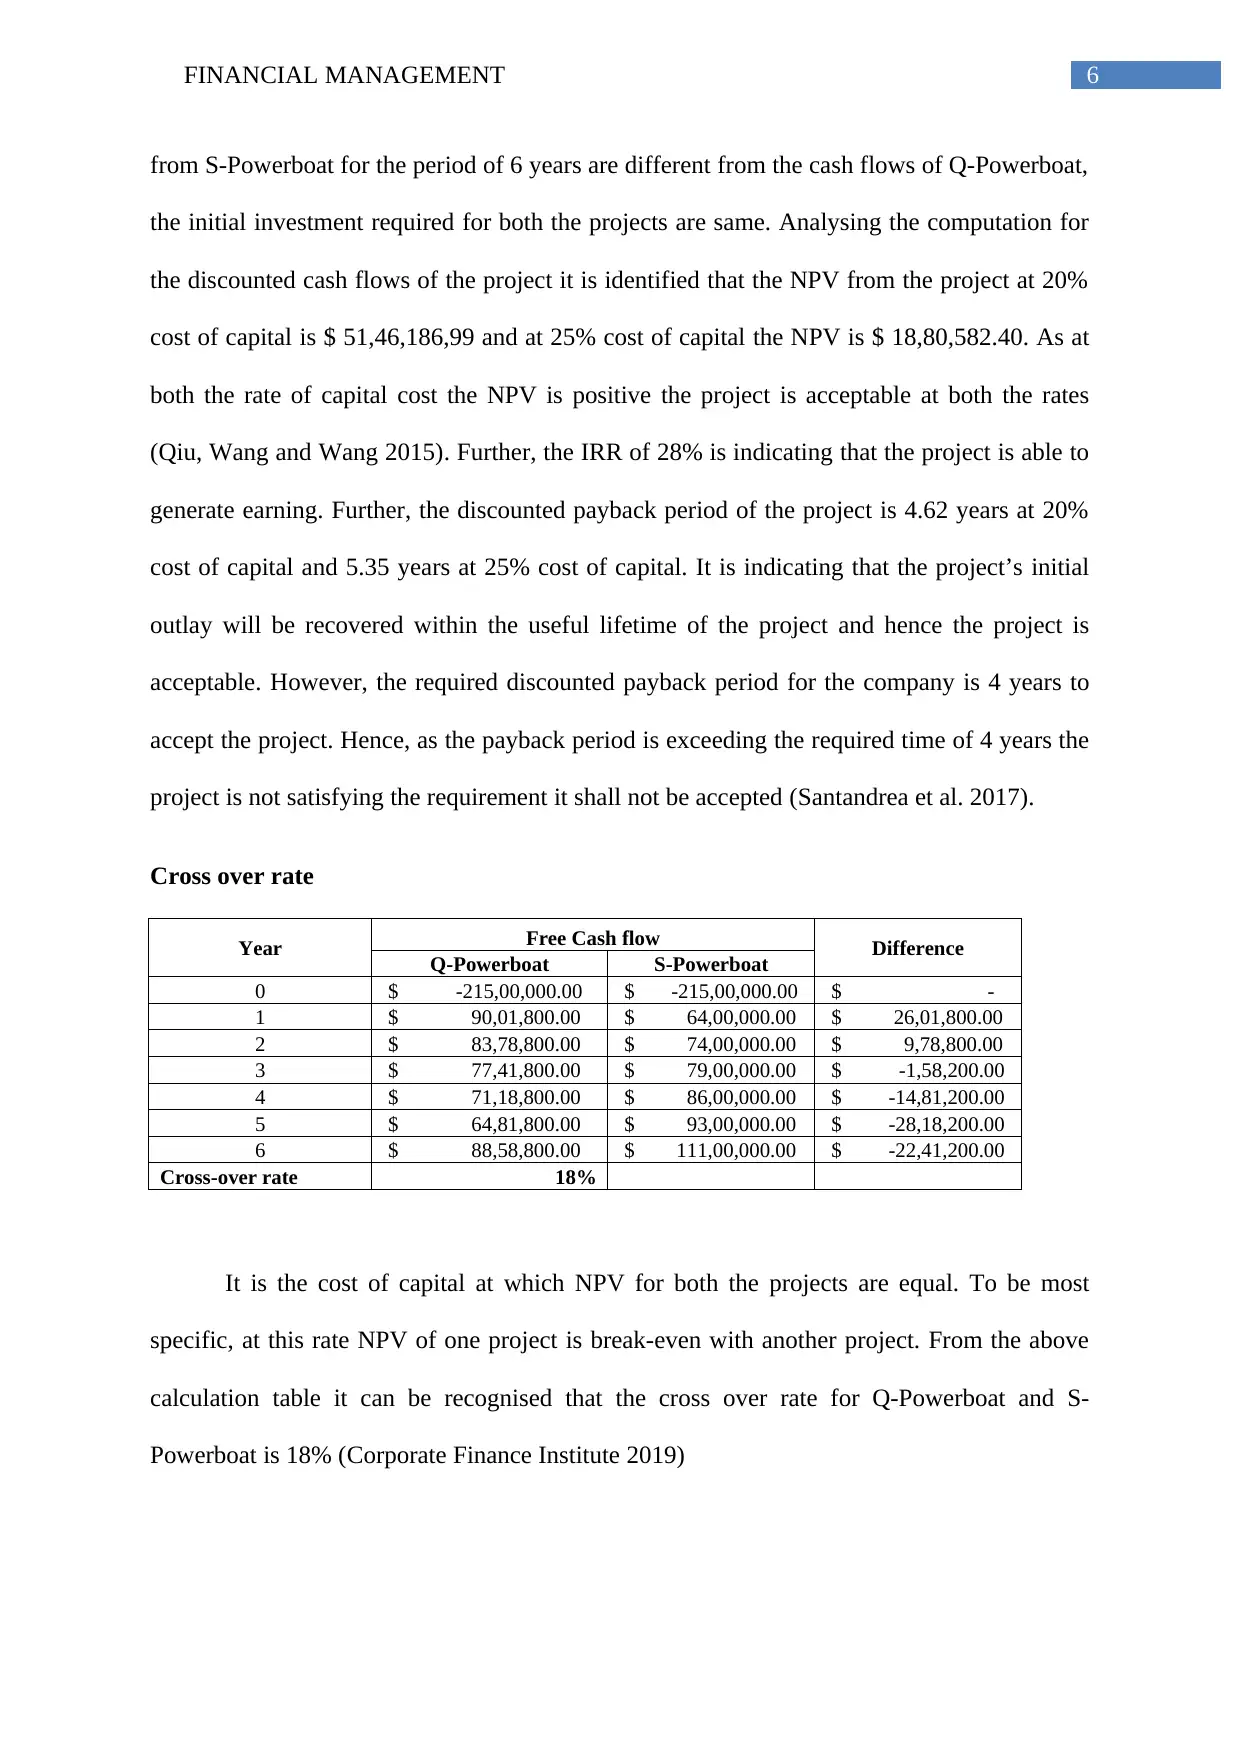
from S-Powerboat for the period of 6 years are different from the cash flows of Q-Powerboat,
the initial investment required for both the projects are same. Analysing the computation for
the discounted cash flows of the project it is identified that the NPV from the project at 20%
cost of capital is $ 51,46,186,99 and at 25% cost of capital the NPV is $ 18,80,582.40. As at
both the rate of capital cost the NPV is positive the project is acceptable at both the rates
(Qiu, Wang and Wang 2015). Further, the IRR of 28% is indicating that the project is able to
generate earning. Further, the discounted payback period of the project is 4.62 years at 20%
cost of capital and 5.35 years at 25% cost of capital. It is indicating that the project’s initial
outlay will be recovered within the useful lifetime of the project and hence the project is
acceptable. However, the required discounted payback period for the company is 4 years to
accept the project. Hence, as the payback period is exceeding the required time of 4 years the
project is not satisfying the requirement it shall not be accepted (Santandrea et al. 2017).
Cross over rate
Year Free Cash flow Difference
Q-Powerboat S-Powerboat
0 $ -215,00,000.00 $ -215,00,000.00 $ -
1 $ 90,01,800.00 $ 64,00,000.00 $ 26,01,800.00
2 $ 83,78,800.00 $ 74,00,000.00 $ 9,78,800.00
3 $ 77,41,800.00 $ 79,00,000.00 $ -1,58,200.00
4 $ 71,18,800.00 $ 86,00,000.00 $ -14,81,200.00
5 $ 64,81,800.00 $ 93,00,000.00 $ -28,18,200.00
6 $ 88,58,800.00 $ 111,00,000.00 $ -22,41,200.00
Cross-over rate 18%
It is the cost of capital at which NPV for both the projects are equal. To be most
specific, at this rate NPV of one project is break-even with another project. From the above
calculation table it can be recognised that the cross over rate for Q-Powerboat and S-
Powerboat is 18% (Corporate Finance Institute 2019)
Paraphrase This Document
Need a fresh take? Get an instant paraphrase of this document with our AI Paraphraser
7FINANCIAL MANAGEMENT
Conclusion and recommendation
From the above analysis it is identified that though both the projects are fulfilling the
acceptability criteria as per NPV approach, IRR approach and discounted payback period,
both the project’s discounted payback period as 20% cost of capital as well as 25% cost of
capital are more than 4 years. However, the required discounted period for the company is 4
years. Hence, as the payback period is exceeding the required time of 4 years the both the
projects are not satisfying the requirement. Therefore, it is recommended that the company
shall not proceed with any of the project.
8FINANCIAL MANAGEMENT
Reference
Corporate Finance Institute., 2019. Crossover Rate - Formula, Examples, and Guide to
Discount Rate, NPV. [online] Available at:
https://corporatefinanceinstitute.com/resources/knowledge/valuation/crossover-rate/
[Accessed 9 May 2019].
DeFusco, R.A., McLeavey, D.W., Pinto, J.E., Anson, M.J. and Runkle, D.E.,
2015. Quantitative investment analysis. John Wiley & Sons.
Dhavale, D. G., and Sarkis, J., 2018. Stochastic internal rate of return on investments in
sustainable assets generating carbon credits. Computers & Operations Research, 89, 324-336.
Götze, U., Northcott, D., and Schuster, P., 2015. Discounted Cash Flow Methods.
In Investment Appraisal (pp. 47-83). Springer, Berlin, Heidelberg.
Qiu, Y., Wang, Y. D., and Wang, J., 2015. Implied discount rate and payback threshold of
energy efficiency investment in the industrial sector. Applied Economics, 47(21), 2218-2233.
Santandrea, M., Sironi, A., Grassi, L., and Giorgino, M., 2017. Concentration risk and
internal rate of return: Evidence from the infrastructure equity market. International Journal
of Project Management, 35(3), 241-251.
Shu, S. B., Zeithammer, R., and Payne, J. W., 2016. Consumer preferences for annuity
attributes: Beyond net present value. Journal of Marketing Research, 53(2), 240-262.
⊘ This is a preview!⊘
Do you want full access?
Subscribe today to unlock all pages.
Trusted by 1+ million students worldwide
9FINANCIAL MANAGEMENT
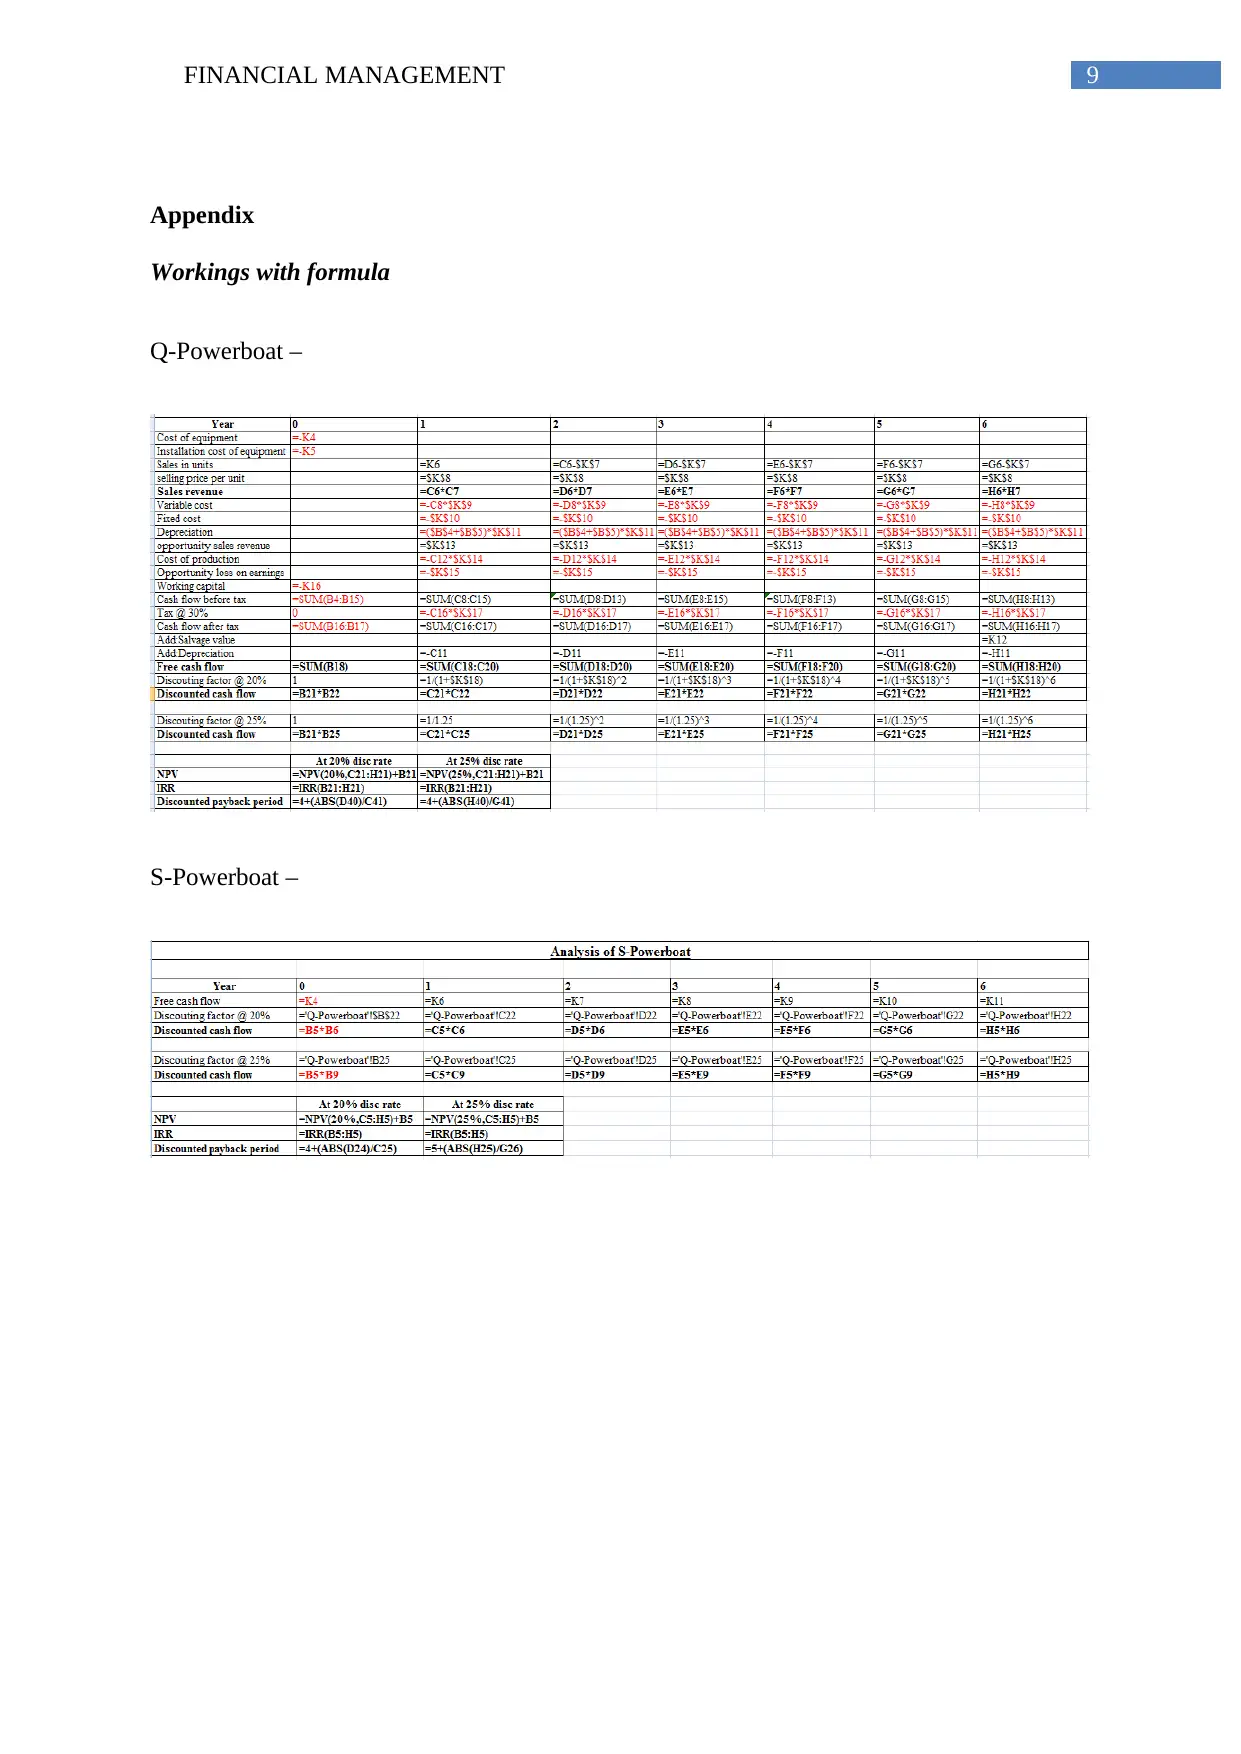
Appendix
Workings with formula
Q-Powerboat –
S-Powerboat –
Appendix
Workings with formula
Q-Powerboat –
S-Powerboat –
1 out of 10


Your All-in-One AI-Powered Toolkit for Academic Success.
+13062052269
info@desklib.com
Available 24*7 on WhatsApp / Email
![[object Object]](/_next/static/media/star-bottom.7253800d.svg)
Unlock your academic potential
Copyright © 2020–2026 A2Z Services. All Rights Reserved. Developed and managed by ZUCOL.