Comparative Financial Report: Q Powerboat vs. S Powerboat Projects
VerifiedAdded on 2021/06/17
|6
|2104
|19
Report
AI Summary
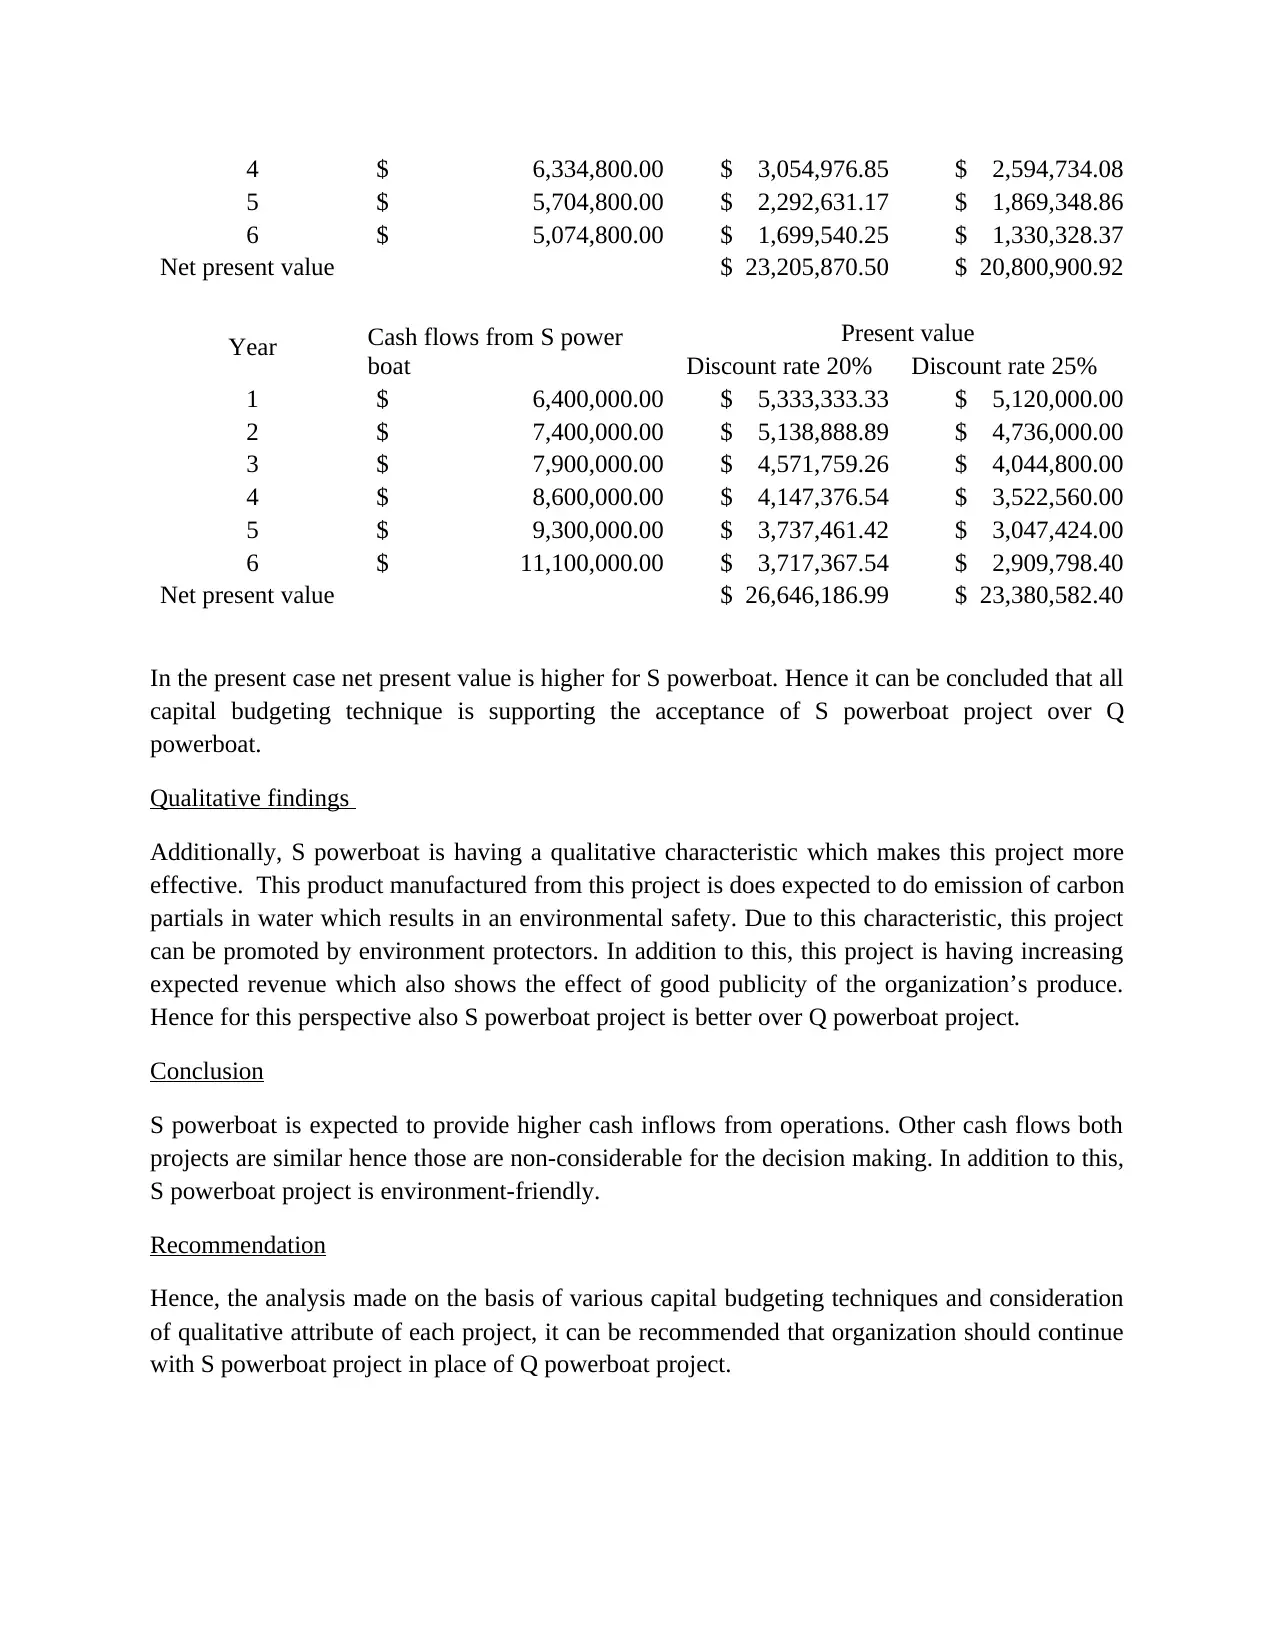
This report provides a comparative financial analysis of two powerboat projects, Q and S, using capital budgeting techniques to aid in decision-making. The analysis includes calculations for initial, terminal, and operating cash flows for both projects. Quantitative aspects are evaluated using net present value (NPV), internal rate of return (IRR), and discounted payback period. The report calculates and compares these metrics for both projects, considering a 20% discount rate. The analysis reveals that the Q powerboat project has a positive NPV and an IRR significantly higher than the weighted average cost of capital, with a discounted payback period within the acceptable timeframe. However, the S powerboat project exhibits a higher NPV. Qualitative factors, such as environmental impact and revenue trends, are also considered, with the S powerboat project being environmentally friendly and showing increasing revenue. The report concludes with a recommendation to proceed with the S powerboat project due to its superior financial performance and positive qualitative attributes.
1 out of 6
Related Documents


Your All-in-One AI-Powered Toolkit for Academic Success.
+13062052269
info@desklib.com
Available 24*7 on WhatsApp / Email
![[object Object]](/_next/static/media/star-bottom.7253800d.svg)
Copyright © 2020–2026 A2Z Services. All Rights Reserved. Developed and managed by ZUCOL.