In-depth Financial Analysis of PPHE Hotel Group and ABHL Report

Verified

Added on  2023/04/26

|28
|5899
|103
Report
AI Summary
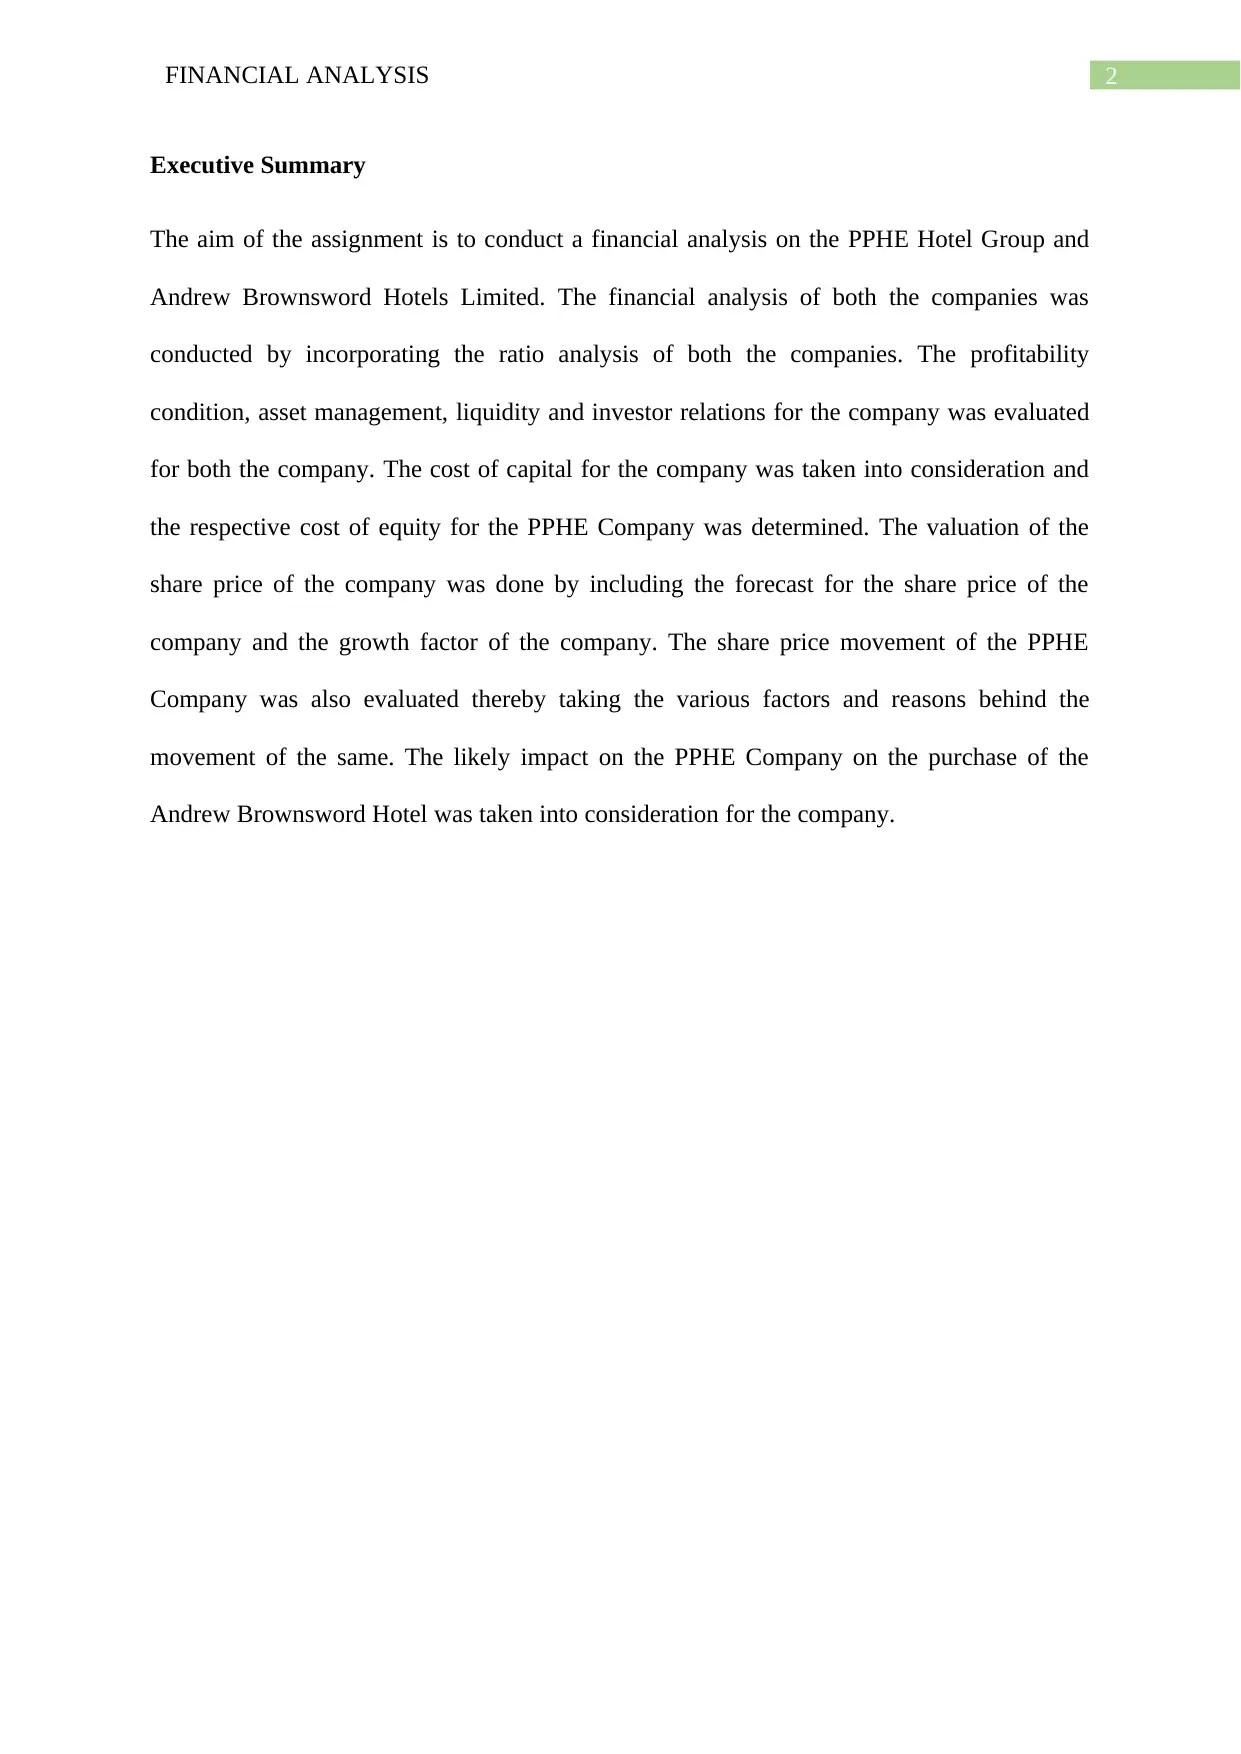
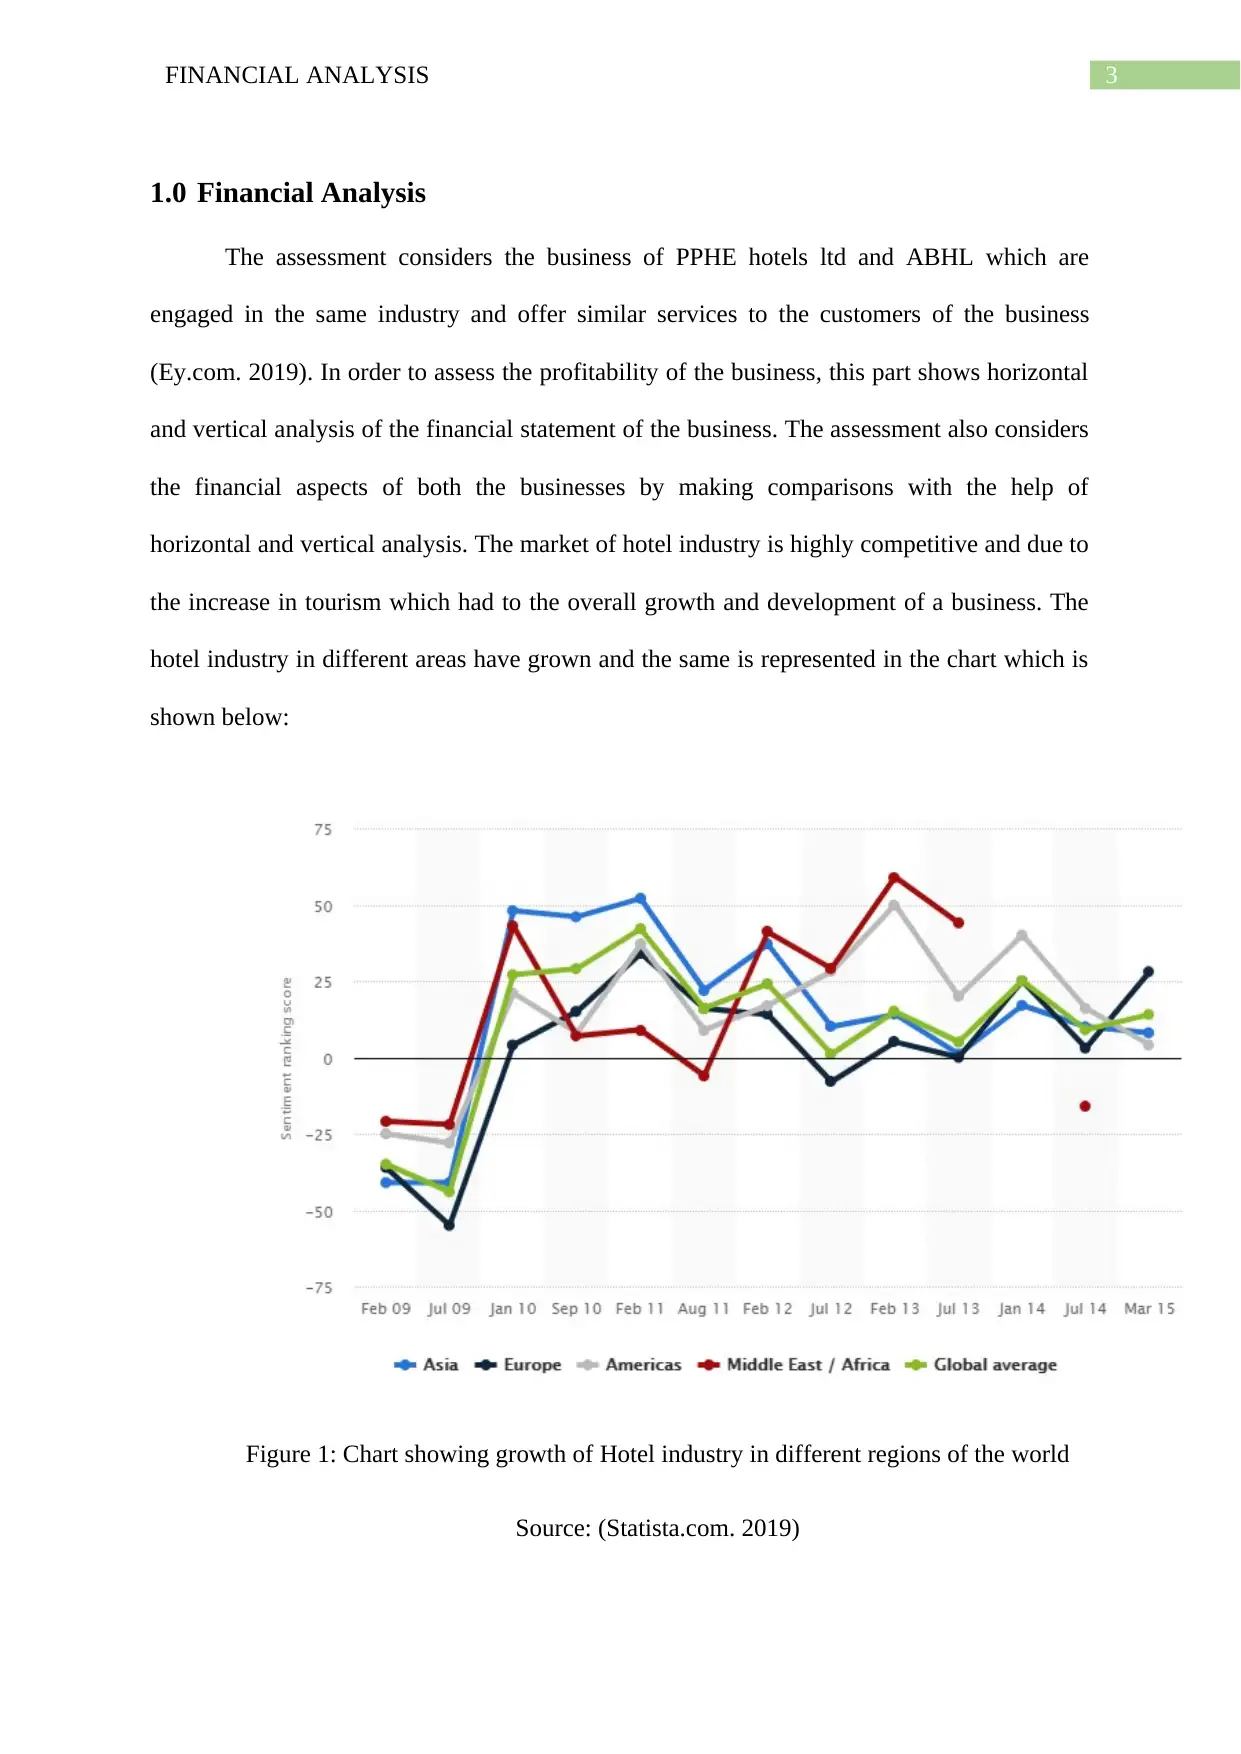
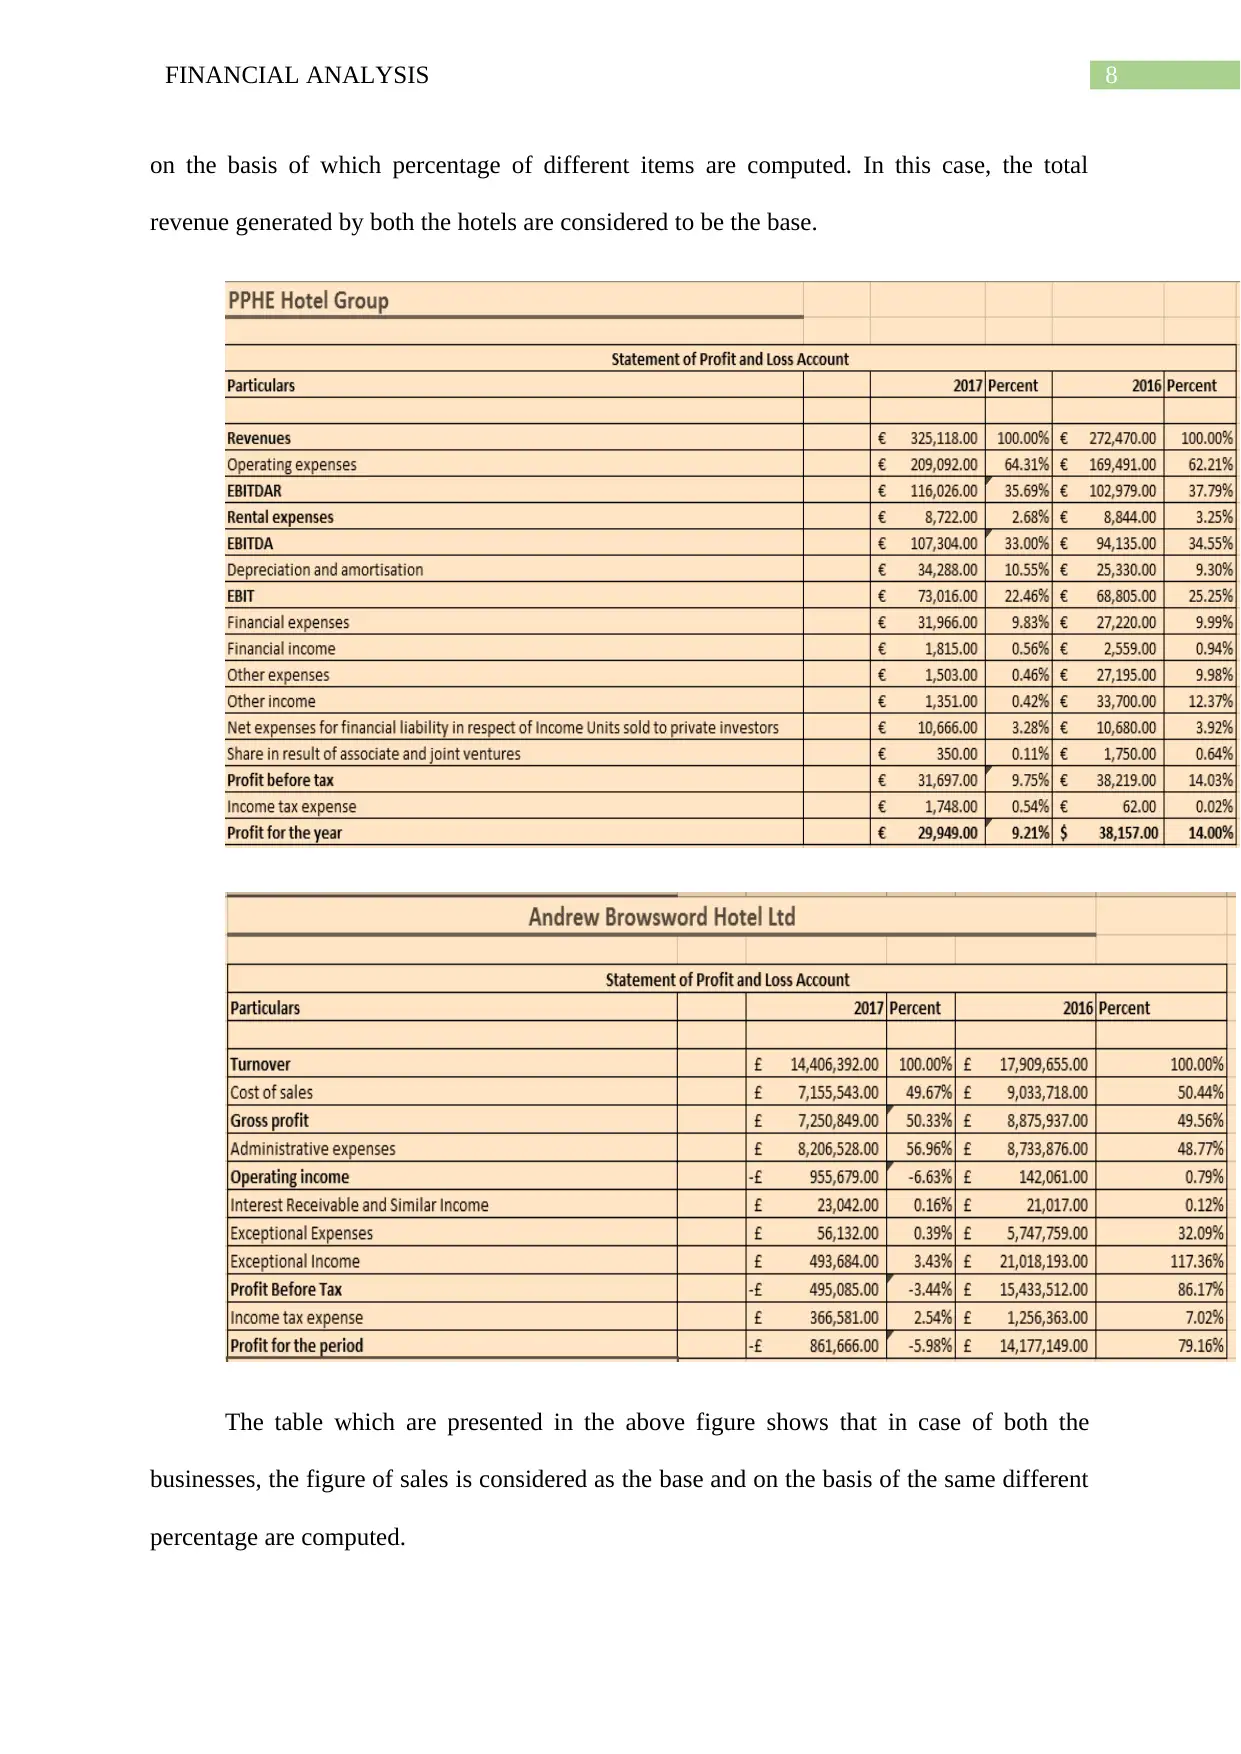
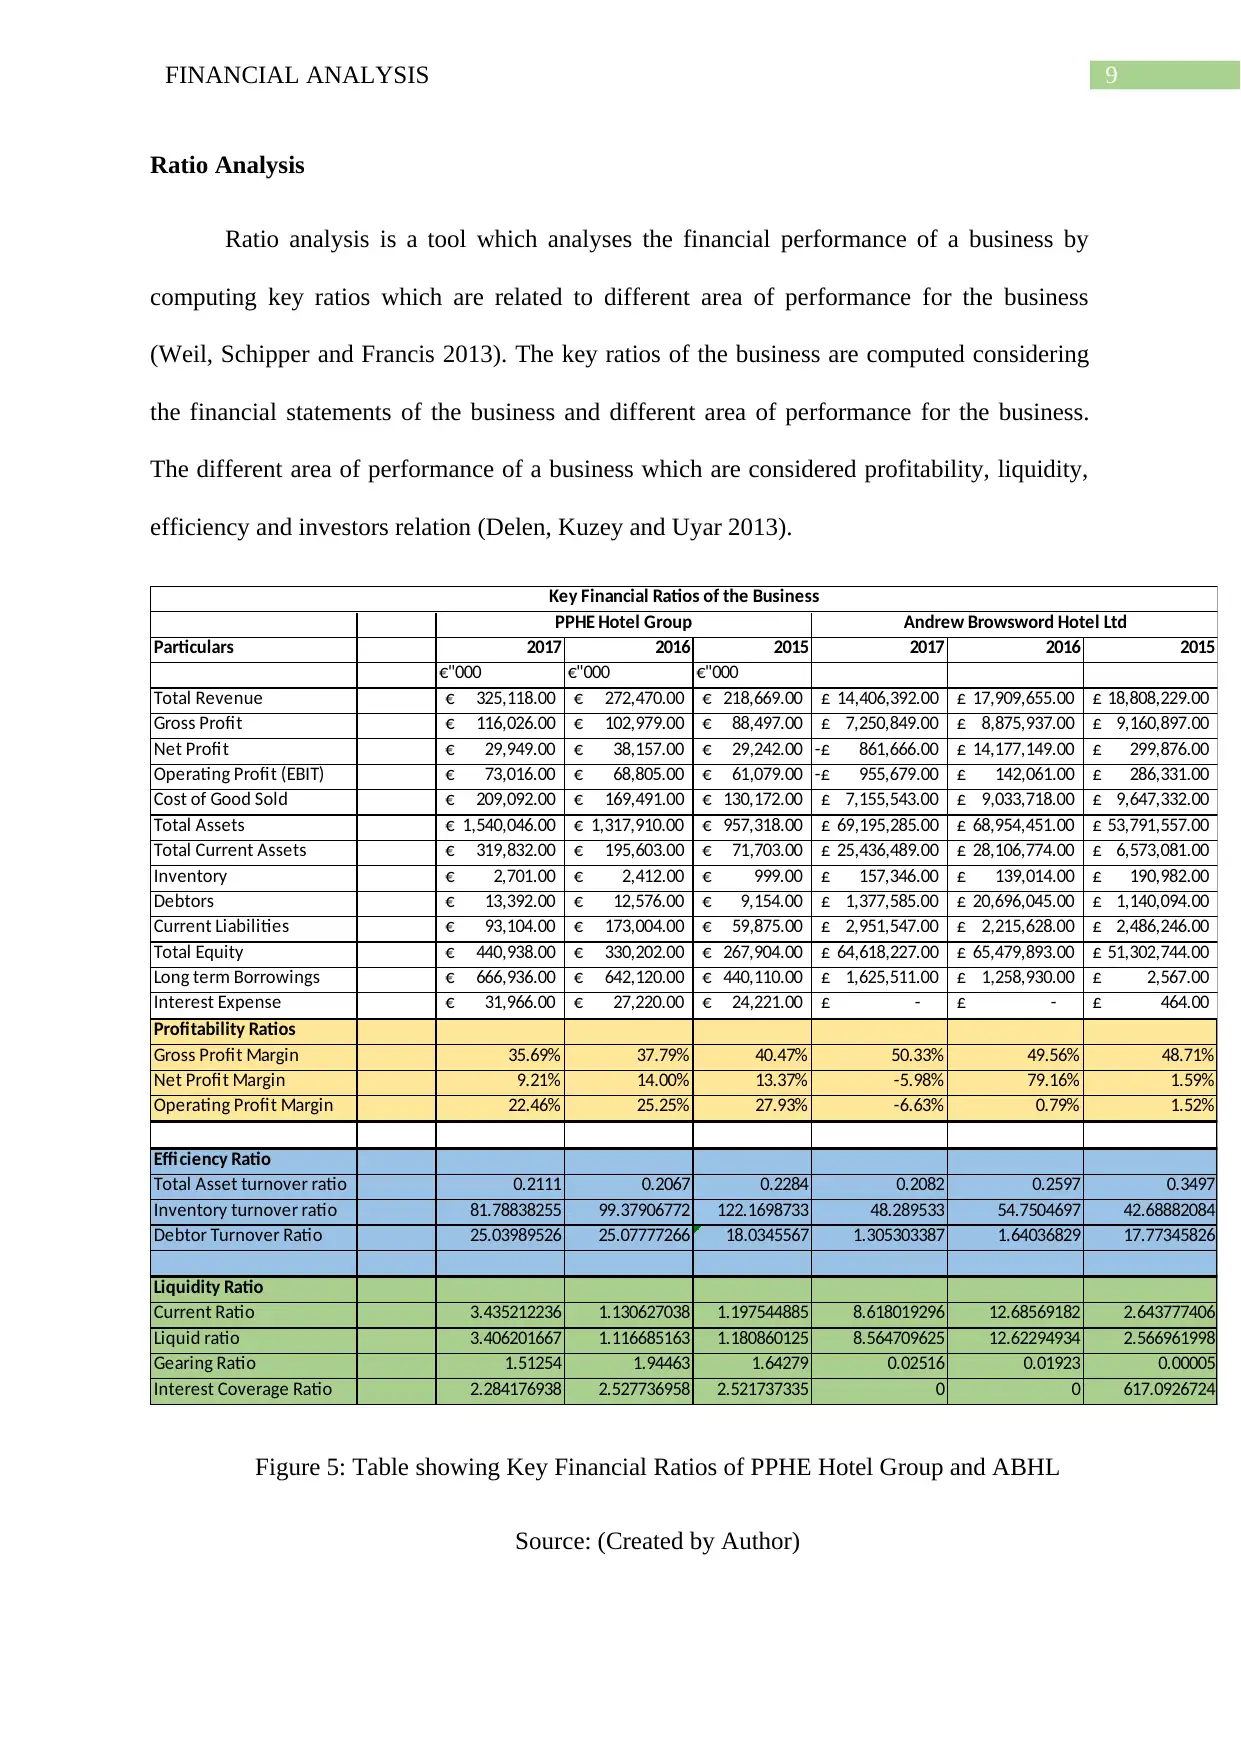
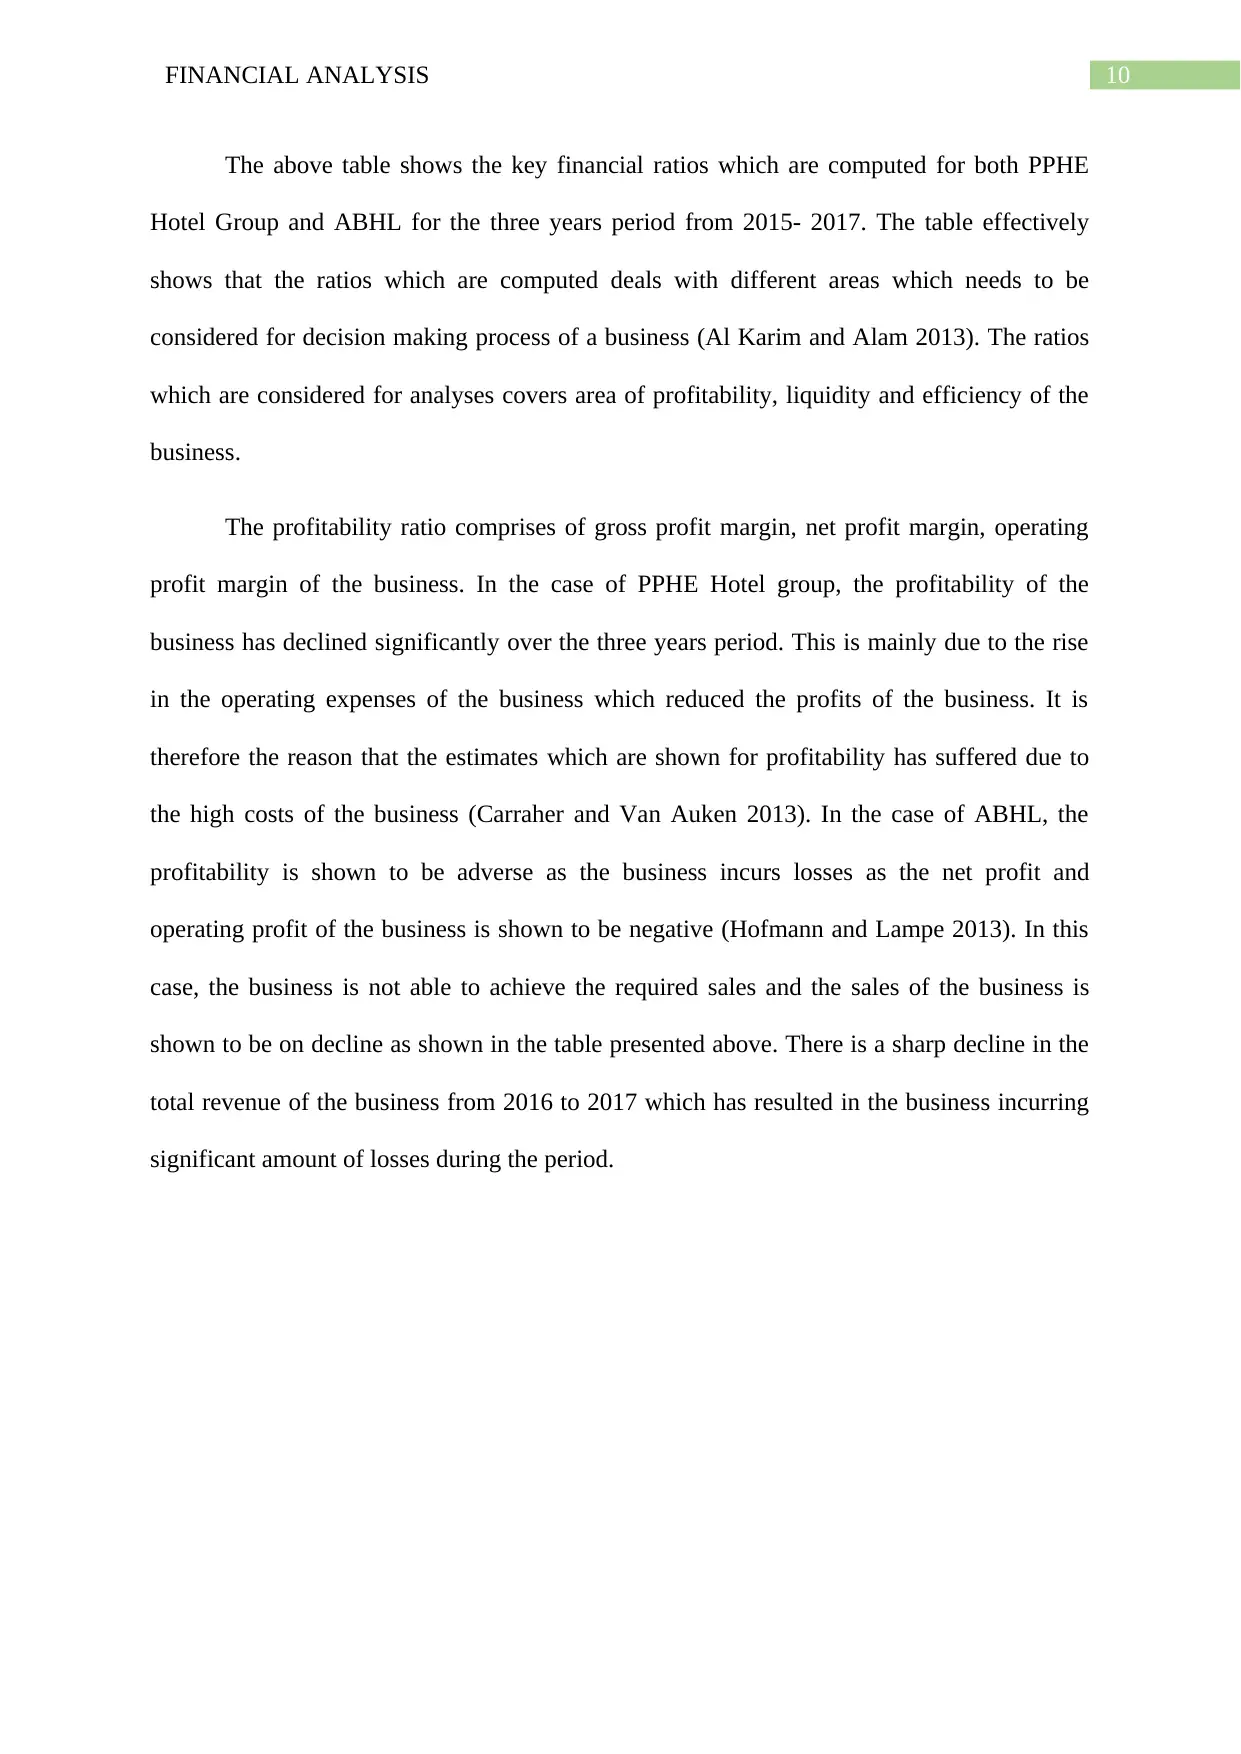
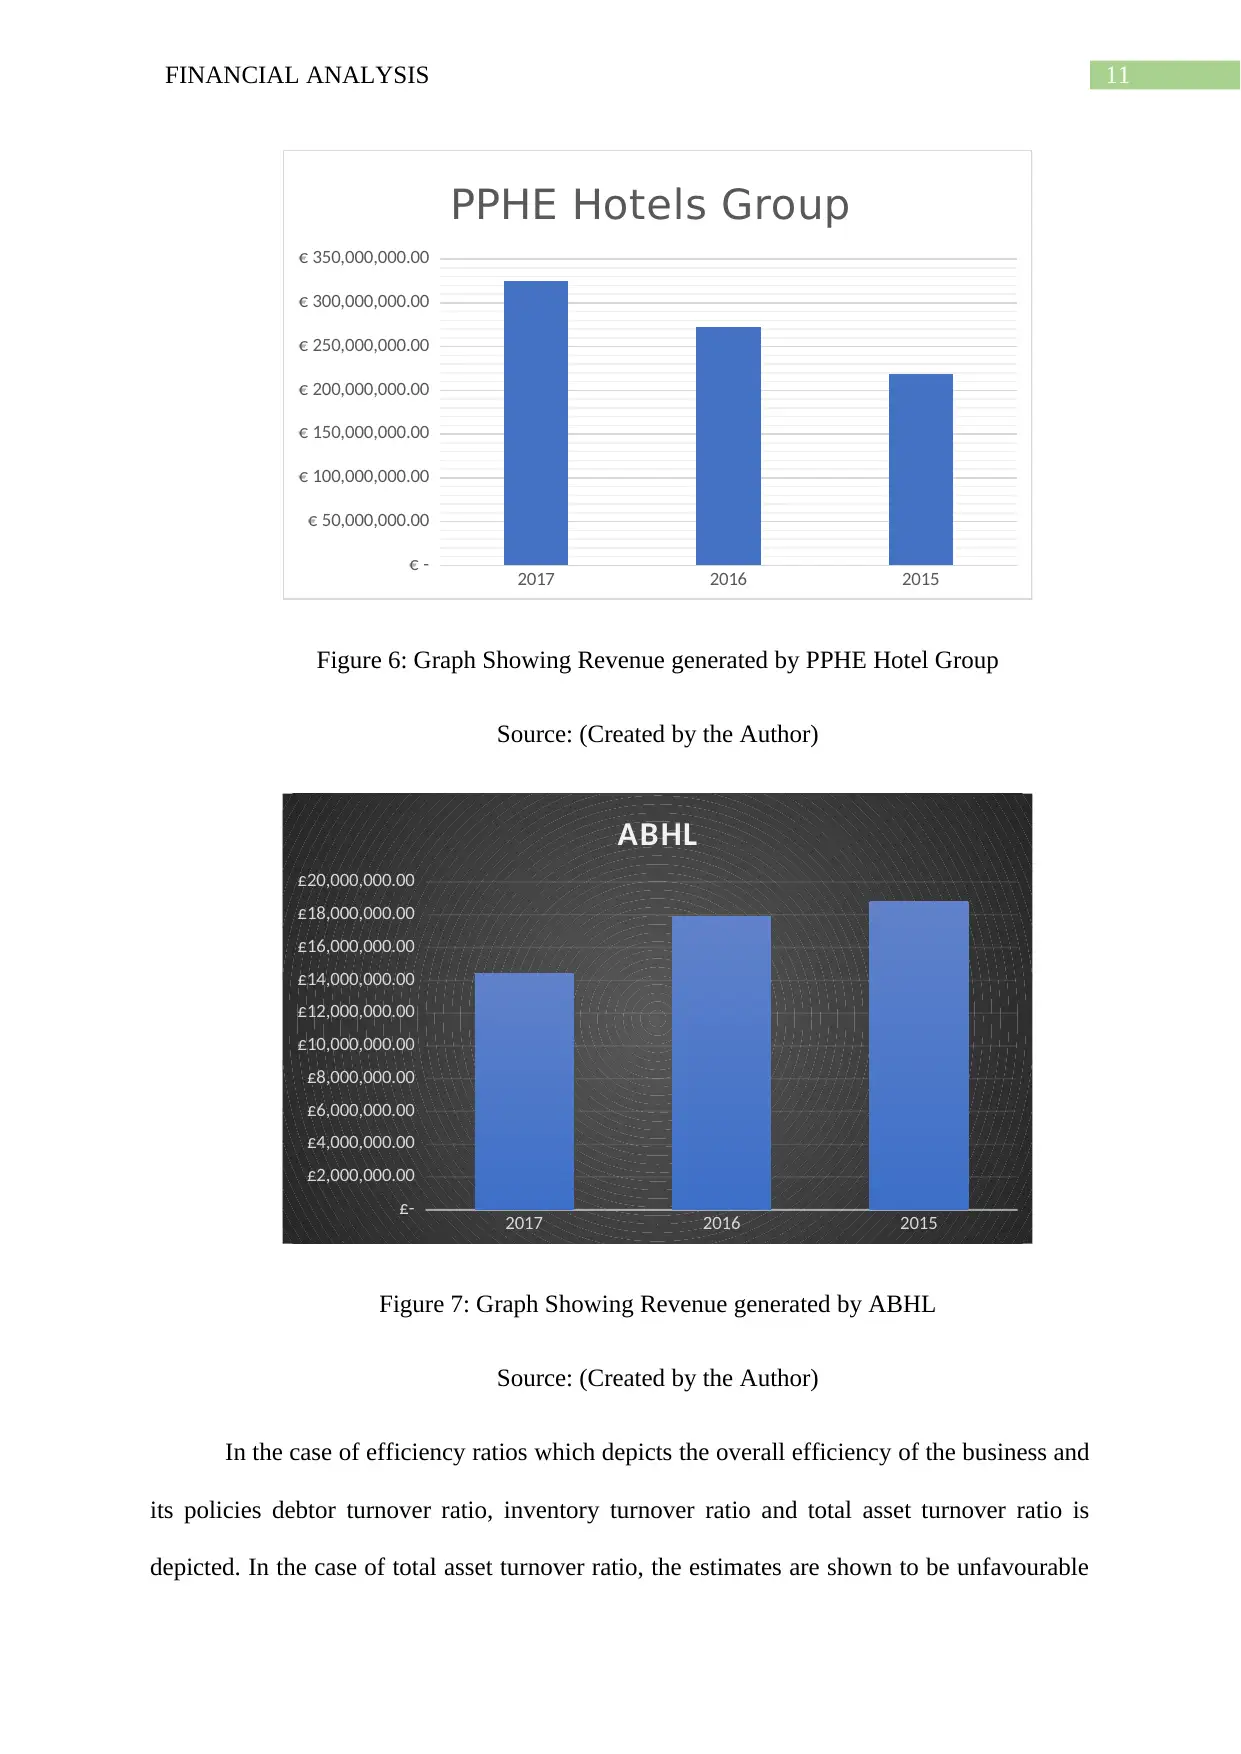
This report delivers a comprehensive financial analysis of PPHE Hotel Group and Andrew Brownsword Hotels Limited, utilizing ratio analysis to evaluate profitability, asset management, liquidity, and investor relations for both entities. It delves into the cost of capital for PPHE, determining its cost of equity and valuing its share price through forecasting and growth factor analysis. Furthermore, the report examines PPHE's share price movements, identifying key influencing factors, and assesses the potential impact of acquiring Andrew Brownsword Hotels on PPHE's financial statements, exploring possible synergy effects. The analysis includes horizontal and vertical assessments of financial statements, supported by charts and graphs visualizing revenue and profit trends. Key financial ratios are computed and compared over a three-year period (2015-2017) to provide insights into the financial health and performance of both hotel groups.
Document Page
Running head: FINANCE
Financial Analysis
Name of the Student:
Name of the University:
Author’s Note:
tabler-icon-diamond-filled.svg

Secure Best Marks with AI Grader

Need help grading? Try our AI Grader for instant feedback on your assignments.
Document Page
1FINANCIAL ANALYSIS
Table of Contents
1.0 Financial Analysis...........................................................................................................3
2.0 Cost of Capital....................................................................................................................14
3.0 Share Price Valuation.........................................................................................................16
4.0 Effect on Financial Statements and Synergy Effect...........................................................17
5.0 Share Price Movements......................................................................................................18
Conclusion................................................................................................................................19
Reference..................................................................................................................................21
Appendix..................................................................................................................................24
Document Page
2FINANCIAL ANALYSIS
Executive Summary
The aim of the assignment is to conduct a financial analysis on the PPHE Hotel Group and
Andrew Brownsword Hotels Limited. The financial analysis of both the companies was
conducted by incorporating the ratio analysis of both the companies. The profitability
condition, asset management, liquidity and investor relations for the company was evaluated
for both the company. The cost of capital for the company was taken into consideration and
the respective cost of equity for the PPHE Company was determined. The valuation of the
share price of the company was done by including the forecast for the share price of the
company and the growth factor of the company. The share price movement of the PPHE
Company was also evaluated thereby taking the various factors and reasons behind the
movement of the same. The likely impact on the PPHE Company on the purchase of the
Andrew Brownsword Hotel was taken into consideration for the company.
Document Page
3FINANCIAL ANALYSIS
1.0 Financial Analysis
The assessment considers the business of PPHE hotels ltd and ABHL which are
engaged in the same industry and offer similar services to the customers of the business
(Ey.com. 2019). In order to assess the profitability of the business, this part shows horizontal
and vertical analysis of the financial statement of the business. The assessment also considers
the financial aspects of both the businesses by making comparisons with the help of
horizontal and vertical analysis. The market of hotel industry is highly competitive and due to
the increase in tourism which had to the overall growth and development of a business. The
hotel industry in different areas have grown and the same is represented in the chart which is
shown below:
Figure 1: Chart showing growth of Hotel industry in different regions of the world
Source: (Statista.com. 2019)
tabler-icon-diamond-filled.svg

Secure Best Marks with AI Grader

Need help grading? Try our AI Grader for instant feedback on your assignments.
Document Page
4FINANCIAL ANALYSIS
The business of PPHE hotels follows an effective strategy for the purpose of ensuring
that there is constant growth in the revenue which is generated by the company. The
strategies which are followed by the management of PPHE Hotels group is presented in the
form of chart presented below:
Figure 2: Image showing Core strategies of PPHE Hotels group
Source: (Pphe.com. 2019)
Horizontal analysis is a tool which is used by most of the businesses for the purpose
of measuring the changes which takes place in the financial statements which is prepared by
the business. The analysis considers the period of 2017 and 2018 for the purpose of
measuring the changes in financial statements (Pphe.com. 2019). On the other hand, vertical
analysis can be determined as a tool which measures the variation in items on the basis of
particular base which is considered by the business. The analysis is conducted so that the
Document Page
5FINANCIAL ANALYSIS
management of the company is able to effectively measure the variations in the items, which
are reported in the annual reports of the business. Both horizontal and vertical analysis can be
described as a tool which can measure the trends in the business.
Horizontal Analysis of Income Statement
Document Page
6FINANCIAL ANALYSIS
The horizontal analysis of the income statement for both the companies is shown in
the figure which is presented above. In the case of PPHE hotel group, the turnover of the
business is shown to have increased from previous year which is not the case for ABHL as
shown in the tables above. The turnover of ABHL has declined as the turnover of the
business has declined from £17,909,655 in 2016 to around £ 14,406,392 (Andrew
Brownsword Hotels. 2019). This shows that the level of business for the hotel has declined
over the year.
1 2
-
50,000,000.00
100,000,000.00
150,000,000.00
200,000,000.00
250,000,000.00
300,000,000.00
350,000,000.00
Profitability of PPHE Hotels
Turnover Net Profit
Figure 3: Chart showing comparison between Revenue and Profits of PPHE Hotels
Source: (Created by Author)
tabler-icon-diamond-filled.svg

Paraphrase This Document

Need a fresh take? Get an instant paraphrase of this document with our AI Paraphraser
Document Page
7FINANCIAL ANALYSIS
2017 2016
-£5,000,000.00
£-
£5,000,000.00
£10,000,000.00
£15,000,000.00
£20,000,000.00
Profitability of ABHL
Turnover Net Profit
Figure 4: Chart showing comparison between Revenue and Profits of ABHL
Source: (Created by Author)
The above charts effectively show that the management of PPHE hotels ltd has been
able to generate more turnover which also suggest that the business has better control in
terms of management of the business (Warren, Reeve and Duchac 2013). The horizontal
analysis of the income statement further shows that the expenses of PPHE Hotel Group has
increased significantly from previous year analysis which has affected the profitability of the
business while the expenses for ABHL has declined in respect to last year. The other
expenses which are incurred by the business has also reduced somewhat which shows that
both the companies are trying to enhance the revenue which is generated.
Vertical Analysis of the Income Statement
In order to analyse the income statement of both the companies and variations which
have taken place in the financial figures, vertical analysis is also conducted (Kraft 2014).
Vertical analysis considers a base which is the highest value figure in the statement as base
Document Page
8FINANCIAL ANALYSIS
on the basis of which percentage of different items are computed. In this case, the total
revenue generated by both the hotels are considered to be the base.
The table which are presented in the above figure shows that in case of both the
businesses, the figure of sales is considered as the base and on the basis of the same different
percentage are computed.
Document Page
9FINANCIAL ANALYSIS
Ratio Analysis
Ratio analysis is a tool which analyses the financial performance of a business by
computing key ratios which are related to different area of performance for the business
(Weil, Schipper and Francis 2013). The key ratios of the business are computed considering
the financial statements of the business and different area of performance for the business.
The different area of performance of a business which are considered profitability, liquidity,
efficiency and investors relation (Delen, Kuzey and Uyar 2013).
Particulars 2017 2016 2015 2017 2016 2015
€"000 €"000 €"000
Total Revenue 325,118.00 272,470.00 218,669.00 14,406,392.00£ 17,909,655.00£ 18,808,229.00£
Gross Profit 116,026.00 102,979.00 88,497.00 7,250,849.00£ 8,875,937.00£ 9,160,897.00£
Net Profit 29,949.00 38,157.00 29,242.00 861,666.00 14,177,149.00£ 299,876.00£
Operating Profit (EBIT) 73,016.00 68,805.00 61,079.00 955,679.00 142,061.00£ 286,331.00£
Cost of Good Sold 209,092.00 169,491.00 130,172.00 7,155,543.00£ 9,033,718.00£ 9,647,332.00£
Total Assets 1,540,046.00 1,317,910.00 957,318.00 69,195,285.00£ 68,954,451.00£ 53,791,557.00£
Total Current Assets 319,832.00 195,603.00 71,703.00 25,436,489.00£ 28,106,774.00£ 6,573,081.00£
Inventory 2,701.00 2,412.00 999.00 157,346.00£ 139,014.00£ 190,982.00£
Debtors 13,392.00 12,576.00 9,154.00 1,377,585.00£ 20,696,045.00£ 1,140,094.00£
Current Liabilities 93,104.00 173,004.00 59,875.00 2,951,547.00£ 2,215,628.00£ 2,486,246.00£
Total Equity 440,938.00 330,202.00 267,904.00 64,618,227.00£ 65,479,893.00£ 51,302,744.00£
Long term Borrowings 666,936.00 642,120.00 440,110.00 1,625,511.00£ 1,258,930.00£ 2,567.00£
Interest Expense 31,966.00 27,220.00 24,221.00 -£ -£ 464.00£
Profitability Ratios
Gross Profit Margin 35.69% 37.79% 40.47% 50.33% 49.56% 48.71%
Net Profit Margin 9.21% 14.00% 13.37% -5.98% 79.16% 1.59%
Operating Profit Margin 22.46% 25.25% 27.93% -6.63% 0.79% 1.52%
Efficiency Ratio
Total Asset turnover ratio 0.2111 0.2067 0.2284 0.2082 0.2597 0.3497
Inventory turnover ratio 81.78838255 99.37906772 122.1698733 48.289533 54.7504697 42.68882084
Debtor Turnover Ratio 25.03989526 25.07777266 18.0345567 1.305303387 1.64036829 17.77345826
Liquidity Ratio
Current Ratio 3.435212236 1.130627038 1.197544885 8.618019296 12.68569182 2.643777406
Liquid ratio 3.406201667 1.116685163 1.180860125 8.564709625 12.62294934 2.566961998
Gearing Ratio 1.51254 1.94463 1.64279 0.02516 0.01923 0.00005
Interest Coverage Ratio 2.284176938 2.527736958 2.521737335 0 0 617.0926724
PPHE Hotel Group
Key Financial Ratios of the Business
Andrew Browsword Hotel Ltd
Figure 5: Table showing Key Financial Ratios of PPHE Hotel Group and ABHL
Source: (Created by Author)
tabler-icon-diamond-filled.svg

Secure Best Marks with AI Grader

Need help grading? Try our AI Grader for instant feedback on your assignments.
Document Page
10FINANCIAL ANALYSIS
The above table shows the key financial ratios which are computed for both PPHE
Hotel Group and ABHL for the three years period from 2015- 2017. The table effectively
shows that the ratios which are computed deals with different areas which needs to be
considered for decision making process of a business (Al Karim and Alam 2013). The ratios
which are considered for analyses covers area of profitability, liquidity and efficiency of the
business.
The profitability ratio comprises of gross profit margin, net profit margin, operating
profit margin of the business. In the case of PPHE Hotel group, the profitability of the
business has declined significantly over the three years period. This is mainly due to the rise
in the operating expenses of the business which reduced the profits of the business. It is
therefore the reason that the estimates which are shown for profitability has suffered due to
the high costs of the business (Carraher and Van Auken 2013). In the case of ABHL, the
profitability is shown to be adverse as the business incurs losses as the net profit and
operating profit of the business is shown to be negative (Hofmann and Lampe 2013). In this
case, the business is not able to achieve the required sales and the sales of the business is
shown to be on decline as shown in the table presented above. There is a sharp decline in the
total revenue of the business from 2016 to 2017 which has resulted in the business incurring
significant amount of losses during the period.
Document Page
11FINANCIAL ANALYSIS
2017 2016 2015
-
50,000,000.00
100,000,000.00
150,000,000.00
200,000,000.00
250,000,000.00
300,000,000.00
350,000,000.00
PPHE Hotels Group
Figure 6: Graph Showing Revenue generated by PPHE Hotel Group
Source: (Created by the Author)
2017 2016 2015
£-
£2,000,000.00
£4,000,000.00
£6,000,000.00
£8,000,000.00
£10,000,000.00
£12,000,000.00
£14,000,000.00
£16,000,000.00
£18,000,000.00
£20,000,000.00
ABHL
Figure 7: Graph Showing Revenue generated by ABHL
Source: (Created by the Author)
In the case of efficiency ratios which depicts the overall efficiency of the business and
its policies debtor turnover ratio, inventory turnover ratio and total asset turnover ratio is
depicted. In the case of total asset turnover ratio, the estimates are shown to be unfavourable
Document Page
12FINANCIAL ANALYSIS
for both the companies and this shows both companies are unable to generate appropriate
revenue in terms of the assets which are used by the business (Edmonds et al. 2013). The
inventory turnover ratio of both the companies is shown to be on the decline over the years
which is considered to be a good sign for both the companies (Islam 2014). This shows that
the management is improving the inventory management practice so that the stocks can move
out quicker and the same can be sold. The debtor turnover period for PPHE Hotel ltd is
shown to have increased from 2015 estimates which signifies that the there is a change in the
debtor’s policies of the business. In the case of ABHL, the debtor turnover estimate is shown
to have decreased significantly which shows that the management of the company is
efficiently managing the operations of the business.
The liquidity ratio of the business shows the availability of funds for the business
which can be used by the business for the purpose of financing the operations of the business
and meeting the current obligations of the business (Weygandt, Kimmel and Kieso 2015).
The liquidity ratios of the business comprise of current ratio, quick ratio, gearing ratio and
interest coverage ratio. The current ratio of both the companies is shown to be appropriate
which shows that the current assets which the company possess is more than the current
liabilities of the hotels. The quick ratio of the business also shows similar results as current
ratio. However, it can be identified that the liquidity position of ABHL is better than PPHE
Hotels group. The management of both the hotels need to take appropriate decisions
regarding improving the business structure.
The investor relation ratios with a view point of making comparisons for the same is
shown in the figure below. The investors relation ratios are established with a view point of
ensuring that needs of the investors are considered
tabler-icon-diamond-filled.svg

Paraphrase This Document

Need a fresh take? Get an instant paraphrase of this document with our AI Paraphraser
Document Page
13FINANCIAL ANALYSIS
Figure 8: Table Showing industry average comparisons
Source: (Created by the Author)
The industry is shown to be highly competitive and the average shows there is further
scope of growth of the business.
Document Page
14FINANCIAL ANALYSIS
2.0
Document Page
15FINANCIAL ANALYSIS
2.0 Cost of Capital
The cost of capital for the company shows the minimum required return, which is
required for the fund investment that will be done by the company. The required return shows
the minimum rate that is demanded by the shareholders of the company for the risk taken
(Berger, Chen and Li 2018). The required rate of return was calculated by applying the
capital assets pricing model and the relevant analysis for the required return was taken into
consideration for the purpose of the analysis. The required rate of return was evaluated by the
capital asset pricing model where the formula applied was:
CAPM: Risk Free Rate of Return+ Beta*(Return on Market-Risk Free Rate of Return).
The risk free rate of return taken for the analysis of the company was the risk free rate
prevailing in the United Kingdom that is about 1.29% (Baker and Wurgler 2015).
tabler-icon-diamond-filled.svg

Secure Best Marks with AI Grader

Need help grading? Try our AI Grader for instant feedback on your assignments.
Document Page
16FINANCIAL ANALYSIS
The beta for the PPHE Company was about 0.52 indicating that the movement in the
share price of the company is comparatively less volatile in compare to the benchmark of the
company. The movement on the stock was assessed to be less volatile than the benchmark
and less correlated on an overall basis (Huizinga, Voget and Wagner 2018).
The return on market shows the return generated by the benchmark index in the trend
period the trend period that was taken into consideration for the purpose of the analysis of the
company stock was around five years of period. The benchmark index evaluated for the
company was the S&P500 and the average return generated by the benchmark index in the
period was around 8.20%. The dividend for the company was around 0.20 pence per ordinary
share in the year 2015 and the same was around 0.24 pence per ordinary share in the year
Document Page
17FINANCIAL ANALYSIS
2017. The compounded average growth rate for the dividend was around 6.3% (Pphe.com
2018).
The value of debt and equity was considered for the calculation of the weighted
average cost of capital for the company. The weighted average cost of capital was derived
after taking the value of equity and the value of debt for the firm and the respective cost for
the equity and debt associated. The cost of equity through the CAPM Model was around
6.30% and Weighted Average Cost of Capital for the PPHE Company was around 4.0% (Li
2015).
PPHE WACC GBP (Million)
Value of Equity 705.3
Value of Debt 1006
Value of Equity + Debt 1711.3
Taxation Rate 21.3%
Cost of Debt 3.13%
Risk free Rate of Return 1.29%
Beta 0.72
Return on Market 8.20%
Cost of Equity (CAPM) 6.3%
Weighted Average Cost of Capital (CAPM) 4.0%
3.0 Share Price Valuation
The share price valuation for the company was done thereby assessing the fair value
of the shares of the company. The revenue for the company was taken into consideration for
the period 2013 to 2017 and the revenue was forecasted for the period. The growth rate in
EBIT was considered 5% for the year 2019 and 2020 (Liang and Gan 2017). The growth rate
in the year 2021 was taken at 2.50% in the terminal year. Per share, valuation for the
company was done after taking the forecasted revenue and the various other key factors for
the company. The Free Cash flow for the firm was derived after taking the various factors
like the taxation rate, depreciation amount and the change in working capital of the company
Document Page
18FINANCIAL ANALYSIS
(Chen, Sun and Xu 2016). The capital expenditure was the amount spent by the company in
purchasing the fixed assets of the company like Plant and Machinery, Furniture and Fittings
and Buildings for the company. The formula applied for the calculation of the Free Cash
Flow for the Firm was:
FCFF: EBIT*(1-Tax Rate) + Depreciation Expenses – Capital Expenditure – Change in
Working Capital Investment.
The value per share for the company was derived for the company by taking the earnings of
the company and the various factors for the company. The per share value for the company
was derived to be around 5.97 per share taking the various growth aspect of the company.
Particulars 2014 2015 2016 2017 2018 2019 2020 2021
Earning Before Interest and Tax 1,89,919 3,02,443 1,63,078 -4,95,085 40,089 42093.1875 44197.84688 46407.73922
Taxation Rate 19.25% 19.25% 19.25% 19.25% 19.25% 19.25% 19.25% 19.25%
Depreciation 1,64,95,299 1,70,22,478 1,60,14,231 1,66,92,307 1,65,56,079 16887200.33 17224944.33 17569443.22
Current Asset 25,76,549 15,11,826 11,64,498 29,23,944 20,44,204 2146414.463 2253735.186 2366421.945
Current Liability 24,28,153 14,28,271 11,92,648 5,45,887 13,98,740 1468676.738 1542110.574 1619216.103
Working Capital 1,48,396 83,555 -28,150 23,78,057 6,45,465 7,69,732 9,41,276 11,83,632
Change in Working Capital -64,841 -1,11,705 24,06,207 -1732592.5 124267.125 171544.1563 242356.4453
Capital Expenditures 8,59,710 15,34,332 6,17,944 45,41,055 18,88,260 1935466.756 1983853.425 2033449.761
EBIT-Taxes 153359.5925 244222.7225 131685.485 -399781.138 32371.66563 33990.24891 35689.76135 37474.24942
Free Cash Flow for Firm 15640552.59 15648813.72 15556122.49 9373413.863 1,64,32,783 1,48,61,457 1,51,05,237 1,53,31,111
Discount Rate 8.20% 8.20% 8.20% 8.20%
Growth Rate 2.50%
Present Value 15187414.66 12694244.5 11924652.92 268966864.2
15187414.66 12694244.5 280891517.2
Free Cash Flow for Firm 308773176.3
No of Outstanding Shares 64292008
Value Per Share 4.802668106
4.0 Effect on Financial Statements and Synergy Effect
tabler-icon-diamond-filled.svg

Paraphrase This Document

Need a fresh take? Get an instant paraphrase of this document with our AI Paraphraser
Document Page
19FINANCIAL ANALYSIS
The above table shows computation of book value computation for the business of
PPHE Hotel Group when the company has acquired ABHL. This would be providing a
synergy effect to the business of PPHE Hotel Group and thereby it would enhance the
productivity and profitability of the business. Synergy can be defined as when a combined
effect is created when a business acquires another firm, which enhances the productivity and
profitability of the business (Kim, Kraft and Ryan 2013). The synergy effect is very
beneficial for a business and the same can be used by the management of the company for
overall development of the business (Bentley, Omer and Sharp 2013). The management of
PPHE Hotels group is planning to add a new production joint which can provide the business
with the effect of synergy and thereby enhance the profitability of the business. The synergy
effect can also bring about rapid changes in the scale of operations of the business and lead to
growth and development of the business.
5.0 Share Price Movements
The share price movements are depicted by the values which are shown in the
valuation of the shares prices. The share price of PPHE Hotels group is considering the risks
of the business and even the overall costs of the business is shown to be high for the business.
The acquisition of ABHL would help the management of PPHE Hotel Group to enhance the
scale of operations of the business. The graph for the movement of the share price of the
PPHE Hotel group is presented below to assess and evaluate the performance of the share
price of the company. The share price of the company has been less volatile and has shown a
growth trend in the trend period analysed for the company (Buus 2015).
Brexit is acronym of Britain and exit, from the European Union which was done as a
voting which was carried out and the vote for Brexit won comfortably and therefore led to the
exit of Britain from the European. The market would be affected adversely and it is
Document Page
20FINANCIAL ANALYSIS
anticipated that the sales for PPHE Group Hotels would fall after Britain leaves the European
Union. In addition to this, it is also anticipated that the share prices of the business would also
fall as the market would be facing an initial crisis and restriction in trade. Another impact,
which can be identified, is that valuation of the currency of pound would fall further until the
same does not stabilise. The fall in the value of the currency would be reducing the cost of
service, which is charged from the foreign customers, and therefore the impact on
profitability is quite clear.
Document Page
21FINANCIAL ANALYSIS
Conclusion
The financial analysis of the PPHE Company and ABHL Company was evaluated for
the purpose of analysis and valuation of the companies. The financial analysis of the
company was conducted thereby analysing the profitability condition of both the companies,
the liquidity condition and the asset management done by the company were some of the key
other aspects that were analysed for the company. The assessment also considered the
financial aspects of both the businesses by making comparisons with the help of horizontal
and vertical analysis. The cost of capital and the weighted average cost of capital for the
PPHE Company was done thereby considering the important factors which are directly
associated with the company. The share price valuation of the company was done by taking
the Free Cash Flow for Firm and the relevant per share price of the company was derived
after taking the assumptions behind the growth rate and the cash flows to be received from
the company. The consolidated accounts for the companies were prepared by taking the
various key assets and liabilities of the company. The synergy for which the PPHE Company
will be paying for the acquisition of the ABHL Company was also taken into consideration
for the company. The share price movement of the PPHE Company in the five year trend
period and the various factors affecting the operational and financial condition of the
company was also taken into consideration.
Recommendations
It is recommended that the PPHE Company should acquire the Andrew Brownsword Limited
based on the expected synergy and valuation done by the company. The valuation of the
company based on the expected cash flows and synergy was expected to be around £330
million. The value per share for the company was around 4.80 per share for the company.
The joint venture will be helping the company in having a varied operation base for the
company and a increased market share in the global markets.
tabler-icon-diamond-filled.svg

Secure Best Marks with AI Grader

Need help grading? Try our AI Grader for instant feedback on your assignments.
Document Page
22FINANCIAL ANALYSIS
Reference
Al Karim, R. and Alam, T., 2013. An evaluation of financial performance of private
commercial banks in Bangladesh: Ratio analysis. Journal of Business Studies Quarterly, 5(2),
p.65.
Andrew Brownsword Hotels. (2019). Andrew Brownsword Hotels - AA Hotel Group of the
Year 2017-18. [online] Available at: https://www.brownswordhotels.co.uk/ [Accessed 12
Feb. 2019].
Baker, M. and Wurgler, J., 2015. Do strict capital requirements raise the cost of capital? Bank
regulation, capital structure, and the low-risk anomaly. American Economic Review, 105(5),
pp.315-20.
Bentley, K.A., Omer, T.C. and Sharp, N.Y., 2013. Business strategy, financial reporting
irregularities, and audit effort. Contemporary Accounting Research, 30(2), pp.780-817.
Berger, P.G., Chen, H.J. and Li, F., 2018. Firm specific information and the cost of equity
capital. Feng, Firm Specific Information and the Cost of Equity Capital (April 2, 2018).
Buus, T., 2015. A general free cash flow theory of capital structure. Journal of Business
Economics and Management, 16(3), pp.675-695.
Carraher, S. and Van Auken, H., 2013. The use of financial statements for decision making
by small firms. Journal of Small Business & Entrepreneurship, 26(3), pp.323-336.
Chen, X., Sun, Y. and Xu, X., 2016. Free cash flow, over-investment and corporate
governance in China. Pacific-Basin Finance Journal, 37, pp.81-103.
Delen, D., Kuzey, C. and Uyar, A., 2013. Measuring firm performance using financial ratios:
A decision tree approach. Expert Systems with Applications, 40(10), pp.3970-3983.
Document Page
23FINANCIAL ANALYSIS
Edmonds, T.P., McNair, F.M., Olds, P.R. and Milam, E.E., 2013. Fundamental financial
accounting concepts. New York, NY: McGraw-Hill Irwin.
Ey.com. (2019). [online] Available at:
https://www.ey.com/Publication/vwLUAssets/The_Hospitality_Sector_in_Europe/$FILE/
EY_The_Hospitality_Sector_in_Europe.pdf [Accessed 12 Feb. 2019].
Hofmann, E. and Lampe, K., 2013. Financial statement analysis of logistics service
providers: ways of enhancing performance. International Journal of Physical Distribution &
Logistics Management, 43(4), pp.321-342.
Huizinga, H., Voget, J. and Wagner, W., 2018. Capital gains taxation and the cost of capital:
Evidence from unanticipated cross-border transfers of tax base. Journal of Financial
Economics.
Islam, M.A., 2014. An analysis of the financial performance of national bank limited using
financial ratio. Journal of Behavioural Economics, Finance, Entrepreneurship, Accounting
and Transport, 2(5), pp.121-129.
Kim, S., Kraft, P. and Ryan, S.G., 2013. Financial statement comparability and credit
risk. Review of Accounting Studies, 18(3), pp.783-823.
Kraft, P., 2014. Rating agency adjustments to GAAP financial statements and their effect on
ratings and credit spreads. The Accounting Review, 90(2), pp.641-674.
Li, X., 2015. Accounting conservatism and the cost of capital: An international
analysis. Journal of Business Finance & Accounting, 42(5-6), pp.555-582.
Liang, Y. and Gan, S., 2017, February. Research on Institutional Investors, Free Cash Flow
And Idle Funds. In 2016 2nd International Conference on Education, Social Science,
Management and Sports (ICESSMS 2016). Atlantis Press.
Document Page
24FINANCIAL ANALYSIS
Pphe.com. (2018). Dividends. [online] Available at:
https://www.pphe.com/investors/shareholder-centre/dividends [Accessed 12 Feb. 2019].
Pphe.com. (2019). [online] Available at: https://www.pphe.com/~/media/Files/P/PPHE-
Corp/documents/Downloadcenter/2017/PPHE-Hotel-Group-2017-Annual-Report.pdf
[Accessed 12 Feb. 2019].
Statista.com. (2019). Outlook of the hotel market sentiment rankings 2009-2015 | Statistic.
[online] Statista. Available at: https://www.statista.com/statistics/186917/sentiment-ranking-
on-the-global-hotel-market-outlook-since-2009/ [Accessed 12 Feb. 2019].
Warren, C., Reeve, J.M. and Duchac, J., 2013. Financial & managerial accounting. Cengage
Learning.
Weil, R.L., Schipper, K. and Francis, J., 2013. Financial accounting: an introduction to
concepts, methods and uses. Cengage Learning.
Weygandt, J.J., Kimmel, P.D. and Kieso, D.E., 2015. Financial & managerial accounting.
John Wiley & Sons.
tabler-icon-diamond-filled.svg

Paraphrase This Document

Need a fresh take? Get an instant paraphrase of this document with our AI Paraphraser
Document Page
25FINANCIAL ANALYSIS
Appendix
1) Statement of Profit and Loss Account of PPHE Hotel Group Ltd.
Particulars 2017 2016 Changes in Balances % Change in Balances
€"000 €"000
Revenues 3,25,118.00 2,72,470.00 52,648.00 19.32249422
Operating expenses 2,09,092.00 1,69,491.00 39,601.00 23.36466243
EBITDAR 1,16,026.00 1,02,979.00 13,047.00 12.66957341
Rental expenses 8,722.00 8,844.00 122.00-€ -1.379466305
EBITDA 1,07,304.00 94,135.00 13,169.00 13.98948319
Depreciation and amortisation 34,288.00 25,330.00 8,958.00 35.36517963
EBIT 73,016.00 68,805.00 4,211.00 6.120194753
Financial expenses 31,966.00 27,220.00 4,746.00 17.43570904
Financial income 1,815.00 2,559.00 744.00-€ -29.07385698
Other expenses 1,503.00 27,195.00 25,692.00-€ -94.47324876
Other income 1,351.00 33,700.00 32,349.00-€ -95.99109792
Net expenses for financial liability in respect of Income Units sold to private investors 10,666.00 10,680.00 14.00-€ -0.131086142
Share in result of associate and joint ventures 350.00 1,750.00 1,400.00-€ -80
Profit before tax 31,697.00 38,219.00 6,522.00-€ -17.0648107
Income tax expense 1,748.00 62.00 1,686.00 2719.354839
Profit for the year 29,949.00 38,157.00 8,208.00-€ -21.51112509
PPHE Hotel Group
Statement of Profit and Loss Account
2) Statement of Profit and Loss Account of ABHL Company.
Particulars 2017 2016 Changes in Balances % Change in Balances
Turnover 1,44,06,392.00£ 1,79,09,655.00£ 35,03,263.00 -19.56075089
Cost of sales 71,55,543.00£ 90,33,718.00£ 18,78,175.00 -20.79071983
Gross profit 72,50,849.00£ 88,75,937.00£ 16,25,088.00 -18.3089177
Administrative expenses 82,06,528.00£ 87,33,876.00£ 5,27,348.00 -6.037960695
Operating income 9,55,679.00 1,42,061.00£ 10,97,740.00 -772.724393
Interest Receivable and Similar Income 23,042.00£ 21,017.00£ 2,025.00£ 9.635057335
Exceptional Expenses 56,132.00£ 57,47,759.00£ 56,91,627.00 -99.02341069
Exceptional Income 4,93,684.00£ 2,10,18,193.00£ 2,05,24,509.00 -97.65115869
Profit Before Tax 4,95,085.00 1,54,33,512.00£ 1,59,28,597.00 -103.207857
Income tax expense 3,66,581.00£ 12,56,363.00£ 8,89,782.00 -70.82204745
Profit for the period 8,61,666.00 1,41,77,149.00£ 1,50,38,815.00 -106.0778511
Andrew Browsword Hotel Ltd
Statement of Profit and Loss Account
Document Page
26FINANCIAL ANALYSIS
3) Vertical Analysis of PPHE Hotel Group Ltd
Particulars 2017 Percent 2016 Percent
Revenues 3,25,118.00 100.00% 2,72,470.00 100.00%
Operating expenses 2,09,092.00 64.31% 1,69,491.00 62.21%
EBITDAR 1,16,026.00 35.69% 1,02,979.00 37.79%
Rental expenses 8,722.00 2.68% 8,844.00 3.25%
EBITDA 1,07,304.00 33.00% 94,135.00 34.55%
Depreciation and amortisation 34,288.00 10.55% 25,330.00 9.30%
EBIT 73,016.00 22.46% 68,805.00 25.25%
Financial expenses 31,966.00 9.83% 27,220.00 9.99%
Financial income 1,815.00 0.56% 2,559.00 0.94%
Other expenses 1,503.00 0.46% 27,195.00 9.98%
Other income 1,351.00 0.42% 33,700.00 12.37%
Net expenses for financial liability in respect of Income Units sold to private investors 10,666.00 3.28% 10,680.00 3.92%
Share in result of associate and joint ventures 350.00 0.11% 1,750.00 0.64%
Profit before tax 31,697.00 9.75% 38,219.00 14.03%
Income tax expense 1,748.00 0.54% 62.00 0.02%
Profit for the year 29,949.00 9.21% 38,157.00$ 14.00%
Statement of Profit and Loss Account
4) Vertical Analysis of ABHL Company.
Particulars 2017 Percent 2016 Percent
Turnover 1,44,06,392.00£ 100.00% 1,79,09,655.00£ 100.00%
Cost of sales 71,55,543.00£ 49.67% 90,33,718.00£ 50.44%
Gross profit 72,50,849.00£ 50.33% 88,75,937.00£ 49.56%
Administrative expenses 82,06,528.00£ 56.96% 87,33,876.00£ 48.77%
Operating income 9,55,679.00 -6.63% 1,42,061.00£ 0.79%
Interest Receivable and Similar Income 23,042.00£ 0.16% 21,017.00£ 0.12%
Exceptional Expenses 56,132.00£ 0.39% 57,47,759.00£ 32.09%
Exceptional Income 4,93,684.00£ 3.43% 2,10,18,193.00£ 117.36%
Profit Before Tax 4,95,085.00 -3.44% 1,54,33,512.00£ 86.17%
Income tax expense 3,66,581.00£ 2.54% 12,56,363.00£ 7.02%
Profit for the period 8,61,666.00 -5.98% 1,41,77,149.00£ 79.16%
Statement of Profit and Loss Account
Document Page
27FINANCIAL ANALYSIS
5) Ratio Analysis
Particulars 2017 2016 2015 2017 2016 2015
€"000 €"000 €"000
Total Revenue 3,25,118.00 2,72,470.00 2,18,669.00 1,44,06,392.00£ 1,79,09,655.00£ 1,88,08,229.00£
Gross Profit 1,16,026.00 1,02,979.00 88,497.00 72,50,849.00£ 88,75,937.00£ 91,60,897.00£
Net Profit 29,949.00 38,157.00 29,242.00 8,61,666.00 1,41,77,149.00£ 2,99,876.00£
Operating Profit (EBIT) 73,016.00 68,805.00 61,079.00 9,55,679.00 1,42,061.00£ 2,86,331.00£
Cost of Good Sold 2,09,092.00 1,69,491.00 1,30,172.00 71,55,543.00£ 90,33,718.00£ 96,47,332.00£
Total Assets 15,40,046.00 13,17,910.00 9,57,318.00 6,91,95,285.00£ 6,89,54,451.00£ 5,37,91,557.00£
Total Current Assets 3,19,832.00 1,95,603.00 71,703.00 2,54,36,489.00£ 2,81,06,774.00£ 65,73,081.00£
Inventory 2,701.00 2,412.00 999.00 1,57,346.00£ 1,39,014.00£ 1,90,982.00£
Debtors 13,392.00 12,576.00 9,154.00 13,77,585.00£ 2,06,96,045.00£ 11,40,094.00£
Current Liabilities 93,104.00 1,73,004.00 59,875.00 29,51,547.00£ 22,15,628.00£ 24,86,246.00£
Total Equity 4,40,938.00 3,30,202.00 2,67,904.00 6,46,18,227.00£ 6,54,79,893.00£ 5,13,02,744.00£
Long term Borrowings 6,66,936.00 6,42,120.00 4,40,110.00 16,25,511.00£ 12,58,930.00£ 2,567.00£
Interest Expense 31,966.00 27,220.00 24,221.00 -£ -£ 464.00£
Profitability Ratios
Gross Profit Margin 35.69% 37.79% 40.47% 50.33% 49.56% 48.71%
Net Profit Margin 9.21% 14.00% 13.37% -5.98% 79.16% 1.59%
Operating Profit Margin 22.46% 25.25% 27.93% -6.63% 0.79% 1.52%
Efficiency Ratio
Total Asset turnover ratio 0.2111 0.2067 0.2284 0.2082 0.2597 0.3497
Inventory turnover ratio 81.78838255 99.37906772 122.1698733 48.289533 54.7504697 42.68882084
Debtor Turnover Ratio 25.03989526 25.07777266 18.0345567 1.305303387 1.64036829 17.77345826
Liquidity Ratio
Current Ratio 3.435212236 1.130627038 1.197544885 8.618019296 12.68569182 2.643777406
Liquid ratio 3.406201667 1.116685163 1.180860125 8.564709625 12.62294934 2.566961998
Gearing Ratio 1.51254 1.94463 1.64279 0.02516 0.01923 0.00005
Interest Coverage Ratio 2.284176938 2.527736958 2.521737335 0 0 617.0926724
Key Financial Ratios of the Business
PPHE Hotel Group Andrew Browsword Hotel Ltd
chevron_up_icon
1 out of 28
circle_padding
hide_on_mobile
zoom_out_icon
[object Object]