Financial Analysis and Comparison: PPHE Hotel Group Ltd vs ABHL
VerifiedAdded on 2023/04/26
|16
|1788
|347
Report
AI Summary
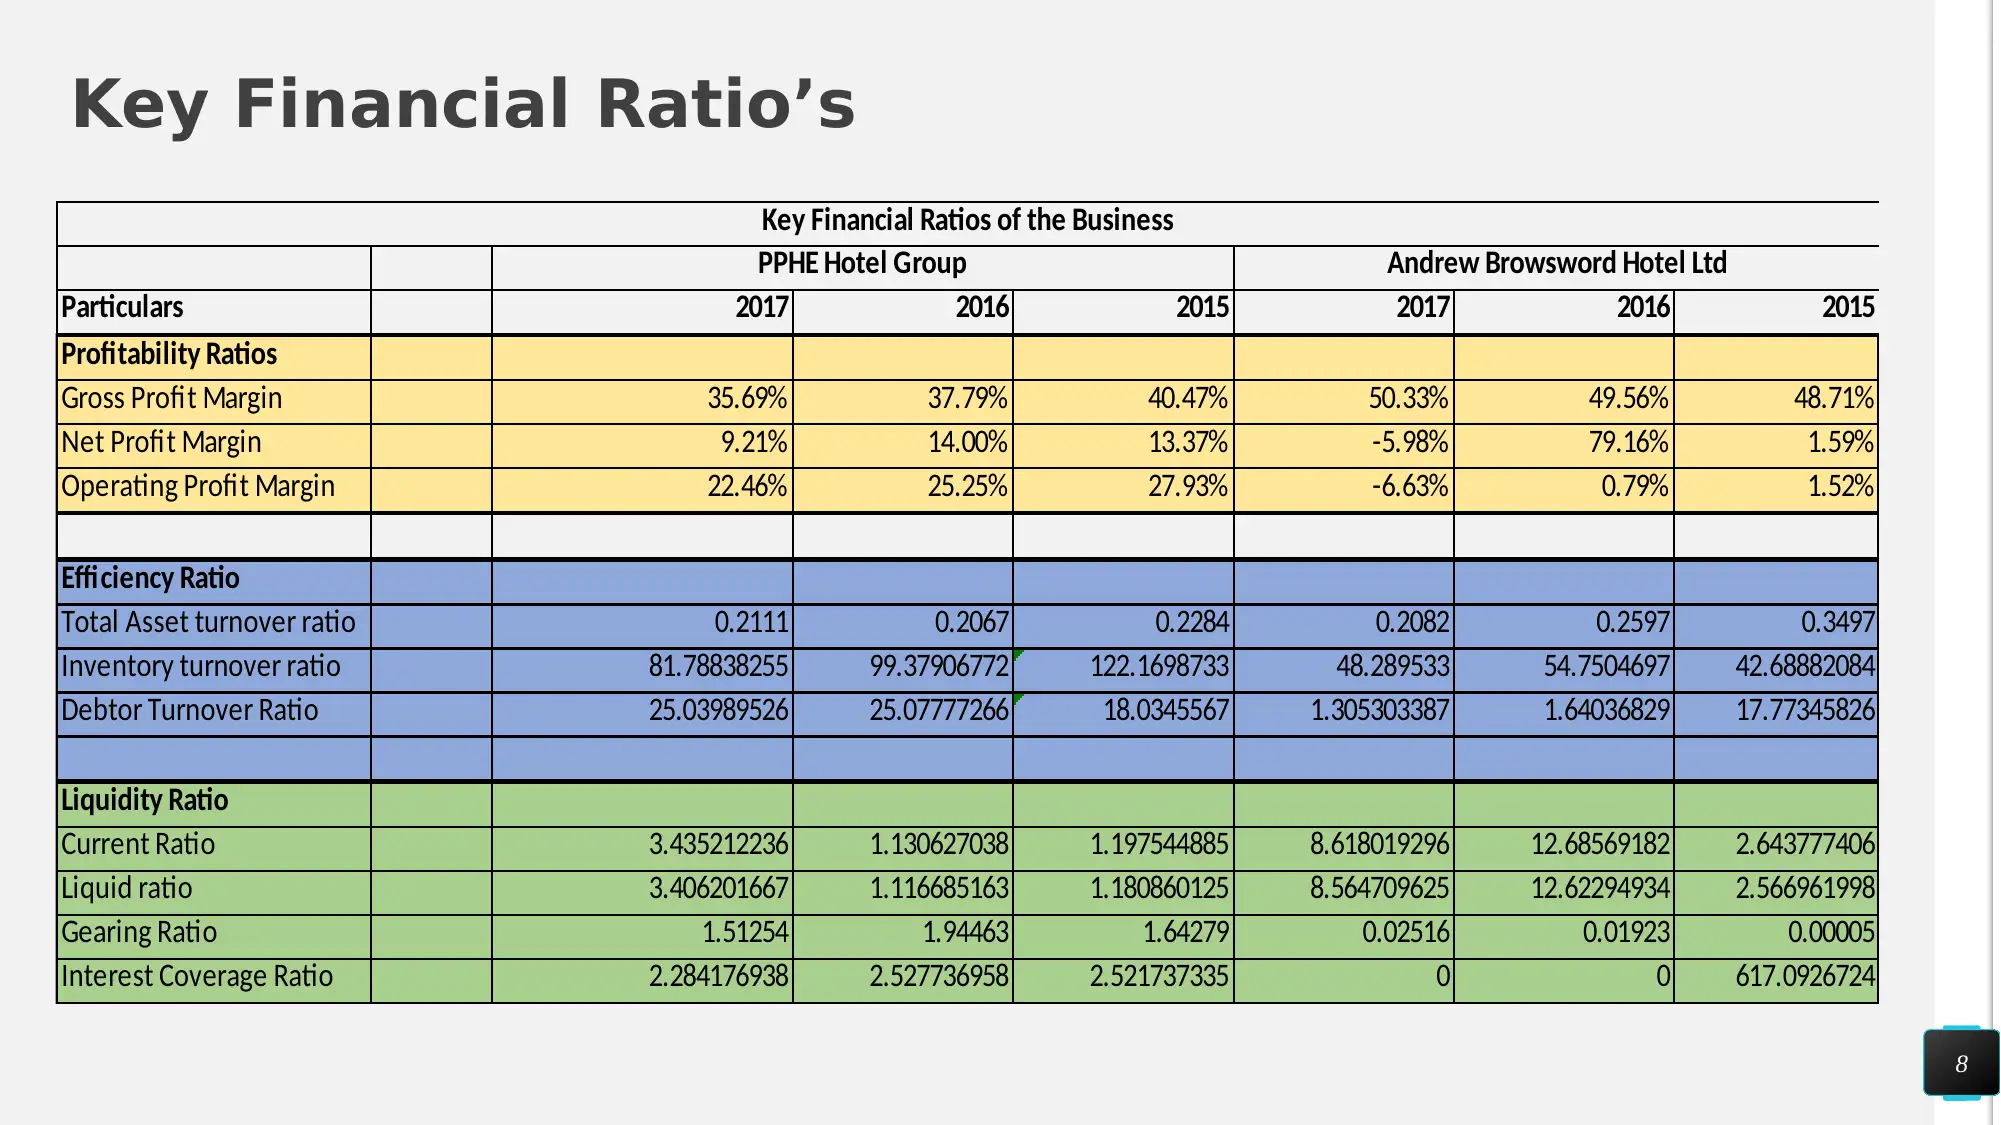
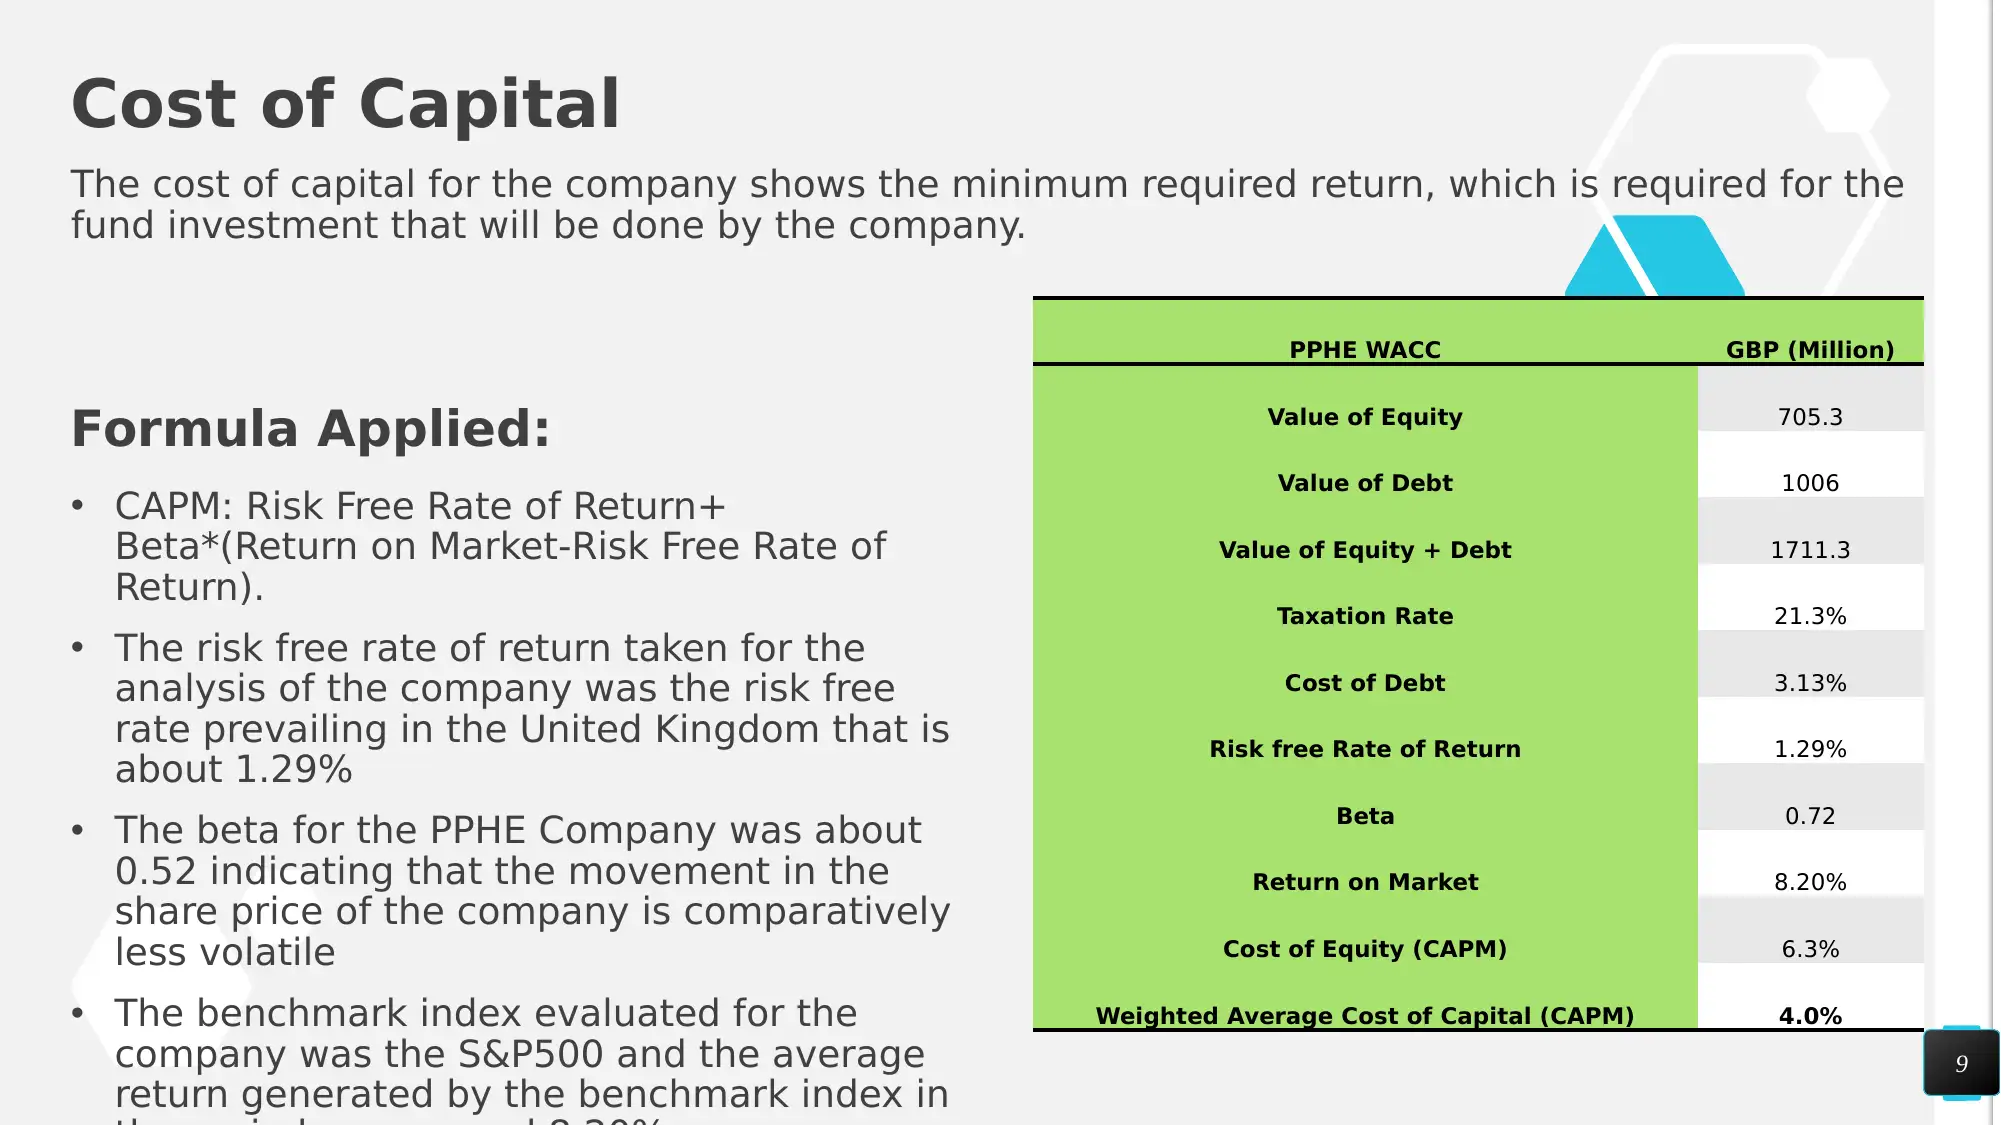
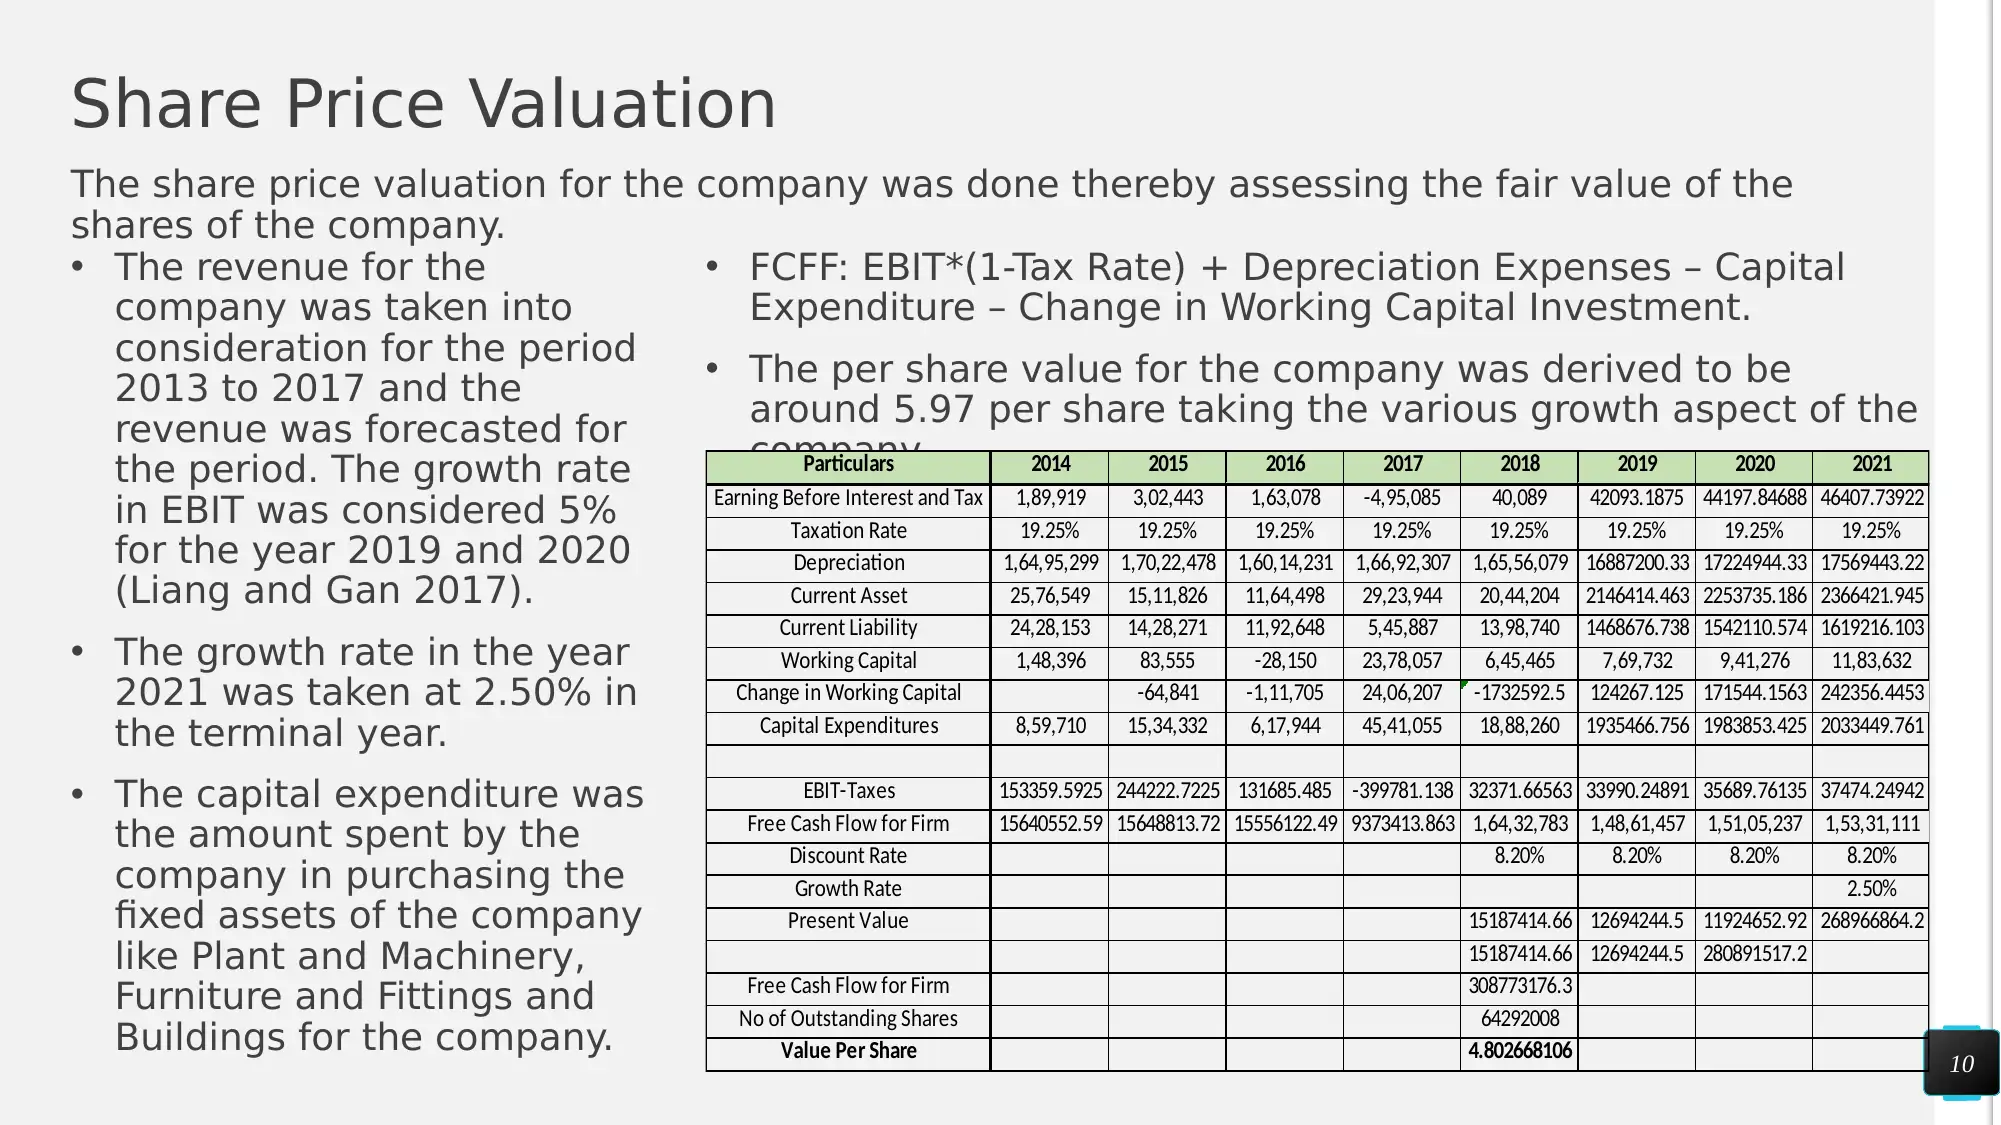
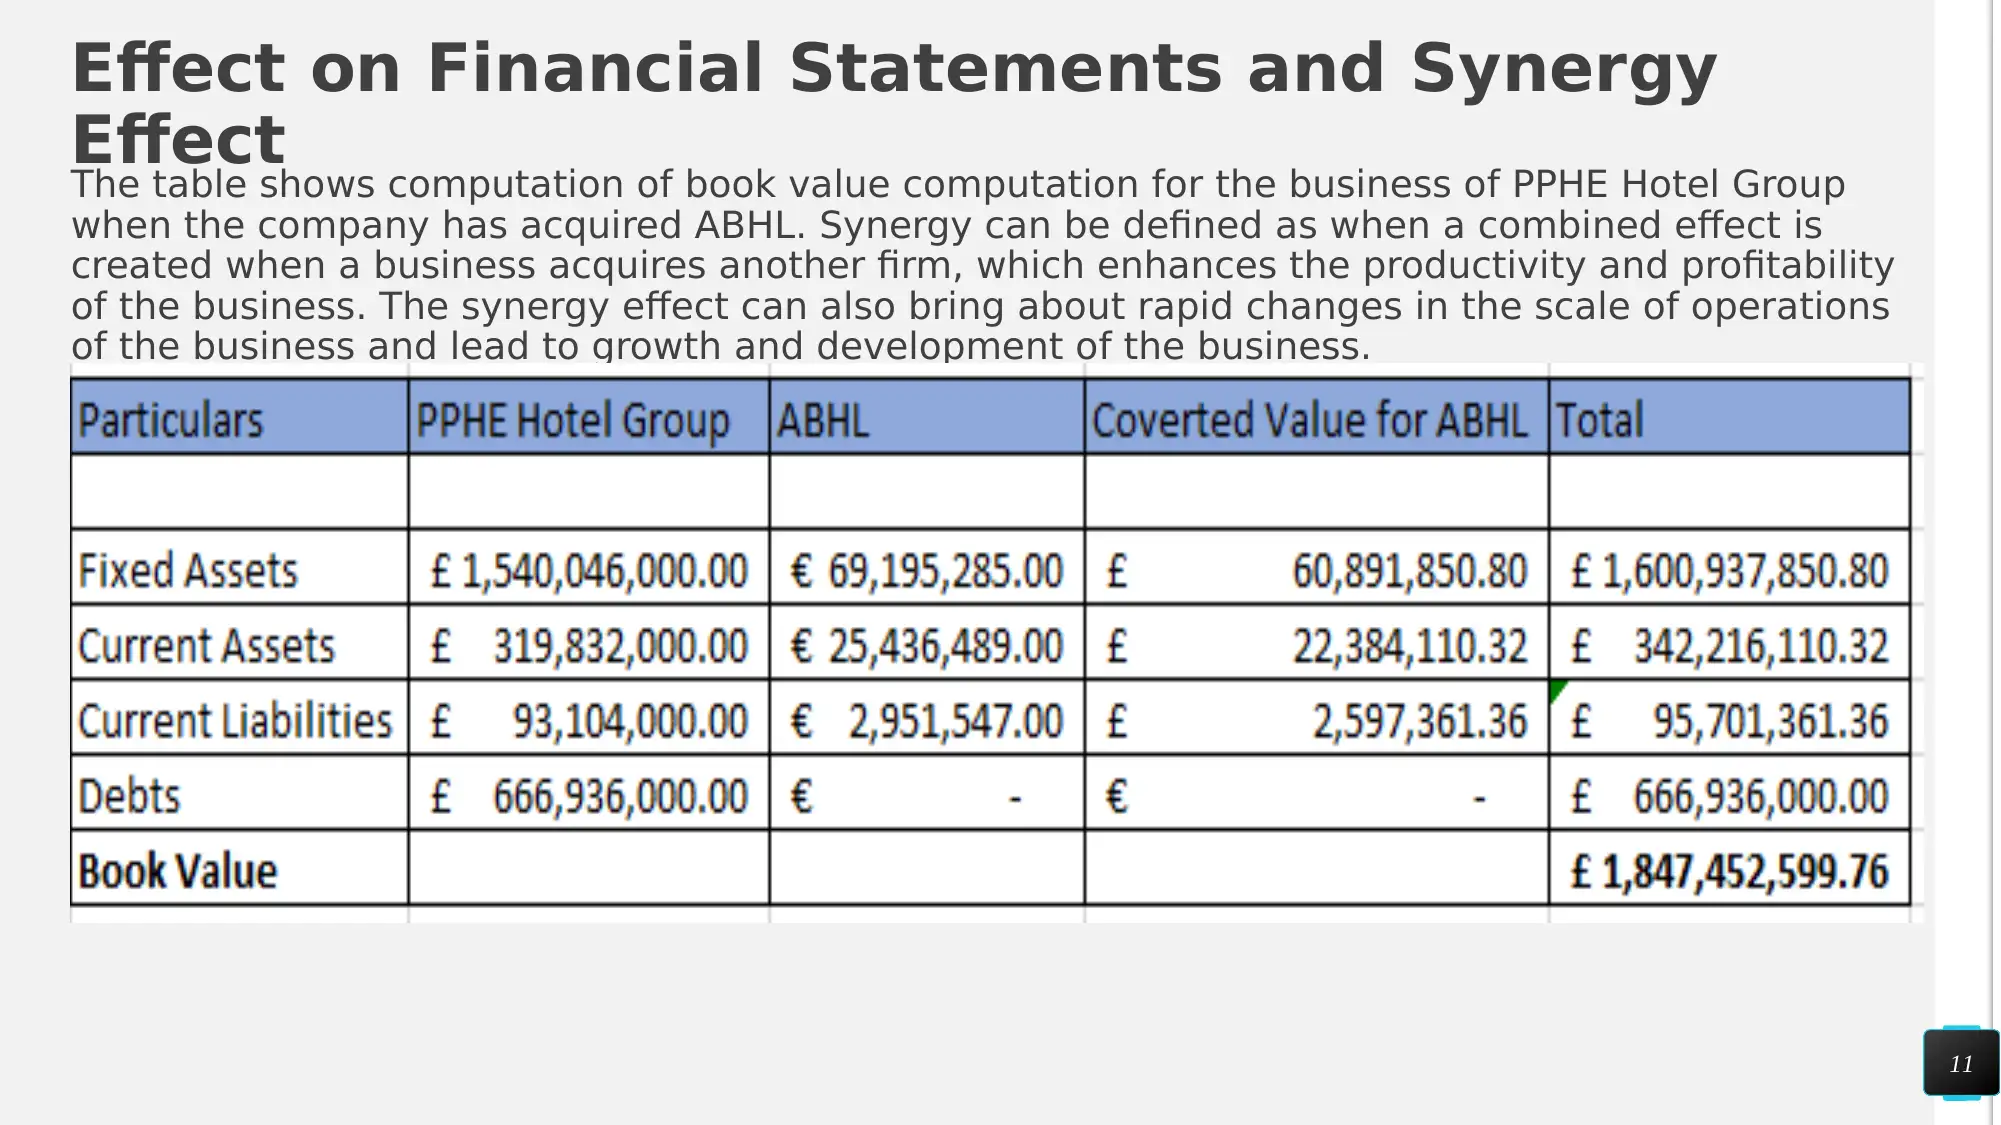
This report presents a financial analysis of PPHE Hotel Group Ltd (PPHE) and Andrew Brownsword Hotels Ltd (ABHL), both operating within the hotel and restaurant industry. The analysis compares their financial performance, focusing on profitability, liquidity, and efficiency, using data from 2017 and 2018. It examines the impact of rising expenses on PPHE's profitability and the decline in ABHL's turnover. Key financial ratios are computed for both companies over a three-year period (2015-2017) to assess their financial health. The report also includes a cost of capital analysis for PPHE, utilizing the Weighted Average Cost of Capital (WACC) and Capital Asset Pricing Model (CAPM). Furthermore, a share price valuation is conducted for PPHE, forecasting revenue and EBIT growth to determine a fair value per share. The report concludes with a discussion of the potential synergy effects of PPHE acquiring ABHL, the impact of Brexit on PPHE's market, and recommendations for the company's strategic direction, including a proposed acquisition based on valuation and expected cash flows.

Financial
Analysis
PPHE Hotel Group Ltd and
Andrew Brownsword
Hotels Ltd
Analysis
PPHE Hotel Group Ltd and
Andrew Brownsword
Hotels Ltd
Paraphrase This Document
Need a fresh take? Get an instant paraphrase of this document with our AI Paraphraser

Park Plaza
Hotels
EuropeAn Internal Hospitality Real
Estate Group having its
operation in the major
leading states of Europe with
a £ 1.6 billion property
portfolio as its Asset.
2
Hotels
EuropeAn Internal Hospitality Real
Estate Group having its
operation in the major
leading states of Europe with
a £ 1.6 billion property
portfolio as its Asset.
2

Andrew
Brownsword
Hotel Ltd.
The company has its
operations primarily in the
Hotel and Restaurant Industry.
Providing Accommodation and
Restaurant Services is the key
area.
3
Brownsword
Hotel Ltd.
The company has its
operations primarily in the
Hotel and Restaurant Industry.
Providing Accommodation and
Restaurant Services is the key
area.
3
⊘ This is a preview!⊘
Do you want full access?
Subscribe today to unlock all pages.

Trusted by 1+ million students worldwide

Financial Analysis
The assessment considers the business of
PPHE hotels ltd and ABHL which are engaged in
the same industry and offer similar services to
the customers of the business
• The market of hotel industry is highly
competitive and due to the increase in
tourism which had to the overall growth and
development of a business.
• The business of PPHE hotels follows an
effective strategy for the purpose of
ensuring that there is constant growth in the
revenue which is generated by the company.
• The analysis considers the period of 2017
and 2018 for the purpose of measuring the
changes in financial statements.
4
Paraphrase This Document
Need a fresh take? Get an instant paraphrase of this document with our AI Paraphraser

Profitability Condition
The profit for the company was affected due to
rising expenses of PPHE Hotel Group which
increased significantly from previous year
analysis and affected the profitability of the
business.
The turnover of ABHL has
declined as the turnover of
the business has declined
from £17,909,655 in 2016 to
around £ 14,406,392 (Andrew
Brownsword Hotels. 2019).
This shows that the level of
business for the hotel has
declined over the year.
5
Insert or Drag & Drop Photo

Comparison
• In the case of PPHE hotel group, the turnover
of the business is shown to have increased
from previous year which is not the case for
ABHL as shown in the tables above.
• The horizontal analysis of the income
statement further shows that the expenses
of PPHE Hotel Group has increased
significantly from previous year analysis
which has affected the profitability of the
business while the expenses for ABHL has
declined in respect to last year.
• Vertical analysis considers a base which is
the highest value figure in the statement as
base on the basis of which percentage of
different items are computed. In this case,
the total revenue generated by both the
hotels are considered to be the base.
6
⊘ This is a preview!⊘
Do you want full access?
Subscribe today to unlock all pages.

Trusted by 1+ million students worldwide

Ratio Analysis
The key ratios of the business are computed
considering the financial statements of the
business and different area of performance for
the business. The different area of performance
of a business which are considered profitability,
liquidity, efficiency and investors relation.
• The key financial ratios which are computed
for both PPHE Hotel Group and ABHL for the
three years period from 2015- 2017.
• The table effectively shows that the ratios
which are computed deals with different
areas which needs to be considered for
decision making process of a business
7
Paraphrase This Document
Need a fresh take? Get an instant paraphrase of this document with our AI Paraphraser

Key Financial Ratio’s
8
Particulars 2017 2016 2015 2017 2016 2015
Profitability Ratios
Gross Profit Margin 35.69% 37.79% 40.47% 50.33% 49.56% 48.71%
Net Profit Margin 9.21% 14.00% 13.37% -5.98% 79.16% 1.59%
Operating Profit Margin 22.46% 25.25% 27.93% -6.63% 0.79% 1.52%
Efficiency Ratio
Total Asset turnover ratio 0.2111 0.2067 0.2284 0.2082 0.2597 0.3497
Inventory turnover ratio 81.78838255 99.37906772 122.1698733 48.289533 54.7504697 42.68882084
Debtor Turnover Ratio 25.03989526 25.07777266 18.0345567 1.305303387 1.64036829 17.77345826
Liquidity Ratio
Current Ratio 3.435212236 1.130627038 1.197544885 8.618019296 12.68569182 2.643777406
Liquid ratio 3.406201667 1.116685163 1.180860125 8.564709625 12.62294934 2.566961998
Gearing Ratio 1.51254 1.94463 1.64279 0.02516 0.01923 0.00005
Interest Coverage Ratio 2.284176938 2.527736958 2.521737335 0 0 617.0926724
Key Financial Ratios of the Business
PPHE Hotel Group Andrew Browsword Hotel Ltd

Cost of Capital
The cost of capital for the company shows the minimum required return, which is required for the
fund investment that will be done by the company.
Formula Applied:
• CAPM: Risk Free Rate of Return+
Beta*(Return on Market-Risk Free Rate of
Return).
• The risk free rate of return taken for the
analysis of the company was the risk free
rate prevailing in the United Kingdom that is
about 1.29%
• The beta for the PPHE Company was about
0.52 indicating that the movement in the
share price of the company is comparatively
less volatile
• The benchmark index evaluated for the
company was the S&P500 and the average
return generated by the benchmark index in
Competitive Service
9
PPHE WACC GBP (Million)
Value of Equity 705.3
Value of Debt 1006
Value of Equity + Debt 1711.3
Taxation Rate 21.3%
Cost of Debt 3.13%
Risk free Rate of Return 1.29%
Beta 0.72
Return on Market 8.20%
Cost of Equity (CAPM) 6.3%
Weighted Average Cost of Capital (CAPM) 4.0%
⊘ This is a preview!⊘
Do you want full access?
Subscribe today to unlock all pages.

Trusted by 1+ million students worldwide

Share Price Valuation
The share price valuation for the company was done thereby assessing the fair value of the
shares of the company.
10
• The revenue for the
company was taken into
consideration for the period
2013 to 2017 and the
revenue was forecasted for
the period. The growth rate
in EBIT was considered 5%
for the year 2019 and 2020
(Liang and Gan 2017).
• The growth rate in the year
2021 was taken at 2.50% in
the terminal year.
• The capital expenditure was
the amount spent by the
company in purchasing the
fixed assets of the company
like Plant and Machinery,
Furniture and Fittings and
Buildings for the company.
• FCFF: EBIT*(1-Tax Rate) + Depreciation Expenses – Capital
Expenditure – Change in Working Capital Investment.
• The per share value for the company was derived to be
around 5.97 per share taking the various growth aspect of the
company.Particulars 2014 2015 2016 2017 2018 2019 2020 2021
Earning Before Interest and Tax 1,89,919 3,02,443 1,63,078 -4,95,085 40,089 42093.1875 44197.84688 46407.73922
Taxation Rate 19.25% 19.25% 19.25% 19.25% 19.25% 19.25% 19.25% 19.25%
Depreciation 1,64,95,299 1,70,22,478 1,60,14,231 1,66,92,307 1,65,56,079 16887200.33 17224944.33 17569443.22
Current Asset 25,76,549 15,11,826 11,64,498 29,23,944 20,44,204 2146414.463 2253735.186 2366421.945
Current Liability 24,28,153 14,28,271 11,92,648 5,45,887 13,98,740 1468676.738 1542110.574 1619216.103
Working Capital 1,48,396 83,555 -28,150 23,78,057 6,45,465 7,69,732 9,41,276 11,83,632
Change in Working Capital -64,841 -1,11,705 24,06,207 -1732592.5 124267.125 171544.1563 242356.4453
Capital Expenditures 8,59,710 15,34,332 6,17,944 45,41,055 18,88,260 1935466.756 1983853.425 2033449.761
EBIT-Taxes 153359.5925 244222.7225 131685.485 -399781.138 32371.66563 33990.24891 35689.76135 37474.24942
Free Cash Flow for Firm 15640552.59 15648813.72 15556122.49 9373413.863 1,64,32,783 1,48,61,457 1,51,05,237 1,53,31,111
Discount Rate 8.20% 8.20% 8.20% 8.20%
Growth Rate 2.50%
Present Value 15187414.66 12694244.5 11924652.92 268966864.2
15187414.66 12694244.5 280891517.2
Free Cash Flow for Firm 308773176.3
No of Outstanding Shares 64292008
Value Per Share 4.802668106
Paraphrase This Document
Need a fresh take? Get an instant paraphrase of this document with our AI Paraphraser

Effect on Financial Statements and Synergy
Effect
The table shows computation of book value computation for the business of PPHE Hotel Group
when the company has acquired ABHL. Synergy can be defined as when a combined effect is
created when a business acquires another firm, which enhances the productivity and profitability
of the business. The synergy effect can also bring about rapid changes in the scale of operations
of the business and lead to growth and development of the business.
11

Insert or Drag & Drop Photo
Share Price Movements
• The share price movements are depicted by the values which are shown in the
valuation of the shares prices.
• The acquisition of ABHL would help the management of PPHE Hotel Group to
enhance the scale of operations of the business.
• The share price of the company has been less volatile and has shown a growth
trend in the trend period analysed for the company.
• Brexit is acronym of Britain and exit, from the European Union which was done as
a voting which was carried out and the vote for Brexit won comfortably and
therefore led to the exit of Britain from the European.
• The market would be affected adversely and it is anticipated that the sales for
PPHE Group Hotels would fall after Britain leaves the European Union. In addition
to this, it is also anticipated that the share prices of the business would also fall as
the market would be facing an initial crisis and restriction in trade.
⊘ This is a preview!⊘
Do you want full access?
Subscribe today to unlock all pages.

Trusted by 1+ million students worldwide
1 out of 16
Related Documents

Your All-in-One AI-Powered Toolkit for Academic Success.
+13062052269
info@desklib.com
Available 24*7 on WhatsApp / Email
Unlock your academic potential
Copyright © 2020–2025 A2Z Services. All Rights Reserved. Developed and managed by ZUCOL.