PPMP20009: Leading Lean Projects - Conflict, Quality, Risk Analysis
VerifiedAdded on 2022/09/28
|20
|4763
|24
Report
AI Summary
This report delves into the critical aspects of leading lean projects, focusing on conflict management strategies between stakeholders like partners and builders, emphasizing accommodation, avoidance, collaboration, compromising, and competing approaches. It advocates for a transformational leadership style to motivate builders and foster a collaborative environment. The report elucidates the application of seven quality control tools—stratification, histogram, check sheet, fishbone diagram, Pareto chart, scatter diagram, and control chart—to manage project quality and efficiency. Furthermore, it outlines a comprehensive risk management strategy, covering risk identification, qualitative and quantitative analysis, response planning, implementation, and monitoring, ensuring project objectives are met effectively. This detailed analysis provides a robust framework for managing complex projects with lean principles.

Running head: LEADING LEAN PROJECTS
Leading Lean Projects
Name of the Student
Name of the University
Author Note
Leading Lean Projects
Name of the Student
Name of the University
Author Note
Paraphrase This Document
Need a fresh take? Get an instant paraphrase of this document with our AI Paraphraser
1
LEADING LEAN PROJECTS
Table of Contents
Discussion of handling the conflicts 2
Selection of a leadership style 3
Explanation of 7 quality control tools and techniques 5
Risk management strategy 9
References 12
LEADING LEAN PROJECTS
Table of Contents
Discussion of handling the conflicts 2
Selection of a leadership style 3
Explanation of 7 quality control tools and techniques 5
Risk management strategy 9
References 12
2
LEADING LEAN PROJECTS
Discussion of handling the conflicts
a) Partner: The reason behind the occurrence of various conflicts between the person
who has got a job in Western Australia and his partner are the issues regarding the
design of their dream home. The employee wants the a one-storied dream house
with a huge terrace but his partner wants their dream home to be three-storied
along with two rooms in each floor (Alkassabi et al., 2015). The conflict
management strategies consists of accommodation, avoidance, collaboration,
compromising and competing (Aqqad et al., 2019). The accommodation strategy
involves giving the liberty to the opposite side regarding its demands. The
utilization of this strategy frequently takes place whenever one of the two parties
desires to maintain peace and in turn perceives the demands of the opposite party
to be a minor issue. The conflict can be managed if the employee accommodates a
two-storied dream home with a huge terrace by avoiding the construction of a
one-storied dream home. The employee should collaborate with his partner
regarding the idea of a luxurious kitchen comprising of all the modern kitchen
supplies. The next strategy is the avoidance strategy which includes to put off all
sorts of the conflicts. The avoider thinks by creating a delay in the conflict or by
ignoring the conflict, the occurred problems resolves within itself without making
any sort of confrontation. The people who avoid various conflicts more often
possess low esteem or a position of a lower power is held by them (Liu et al.,
2015). The avoidance of conflicts can be a profitable method for the management
of the conflicts. The employee should accommodate all the advanced electrical
appliances for his dream home like the air conditioners, refrigerator, designer
lamps to name a few and compromise some of budget to collaborate with his
partner for the glass flooring instead of a mosaic flooring.
⊘ This is a preview!⊘
Do you want full access?
Subscribe today to unlock all pages.
Trusted by 1+ million students worldwide
3
LEADING LEAN PROJECTS
b) Builder: The conflict between the builder and the employee occurred due to the
delay of the decision-making process of the employee regarding the estimation of
costs which is an essential part of the construction of a dream home. The next
strategy is the avoidance strategy which includes to put off all sorts of the
conflicts. The avoider thinks by creating a delay in the conflict or by ignoring the
conflict, the occurred problems resolves within itself without making any sort of
confrontation. The people who avoid various conflicts more often possess low
esteem or a position of a lower power is held by them (Liu et al., 2015). The
avoidance of conflicts can be a profitable method for the management of the
conflicts. Next is the collaboration strategy which is executed by the integration of
the several ideas of numerous people. The main objective of the collaboration
strategy lies behind the finding of good solution is in turn is acceptable by
everybody like the employee should collaborate with the builders of his dream
house for the estimation of costs as well as designing of the house. Next is the
compromising strategy which involves both the sides of a certain conflict for
giving up the elements of their position for the establishment of solution which is
both agreeable as well as acceptable (Mitra, 2016). This strategy is present where
equivalent power is held by the parties. Compromise is often employed where
parties may lose valuable things like a good service. The conflict management
strategy would be the employee should collaborate with the builders of the dream
house and take the advantage of their recent promotion of a free solar energy
system of 5kW. The employee should also accommodate some of the layout in the
designing of the dream house that is provided by the builders. The person who got
the job must collaborate with the builders for solving the budget issues so that the
builders could proceed with their work. The employee should compromise on
Paraphrase This Document
Need a fresh take? Get an instant paraphrase of this document with our AI Paraphraser
4
LEADING LEAN PROJECTS
some of his budget so that some other systems could be included as advised by the
builders (Aqqad et al., 2019). The employee or the person who got the job must
avoid taking time-consuming decisions so that their dream home can be
constructed on time without more wastage of money.Last but not the least is the
competing strategy which functions in the form of a zero-sum game where one
party wins and the other party loses. This conflict management strategy leads to
the assertive personalities to fall back during the competition. It can be executed
smoothly if there are less number of conflicts like certain situations of emergency.
Selection of a leadership style
The employee should have the capability to with the new changes and listen to
various ideas presented to him by the builders of his dream house. Extra money should be
provided by the employee to the builders of his dream house for working for extra hours
(Bittremieux et al., 2017). Another initiative that can be taken by the employee towards the
The person who got the job in Western Australia needs to be a transformational leader and
behave like a transformational leader to the builders of his dream house. The employee can
allow the builders of his dream house to share their viewpoints regarding the designing of his
dream house.
The employee should also motivate the builders of his dream house in estimating the
costs required for the construction of his dream house so that all the builders of his dream
house get encouraged to work in own way. By this, the builders of their dream house can
work in a satisfied way and give their hundred percent efforts and inputs regarding the
construction of the dream house (Beitler et al., 2016). The person whose dream is under the
process of construction should not show his ego to the builders also should keep a check on
their egos.
5
LEADING LEAN PROJECTS
No pressure should be applied on the builders of the dream house by the employee
which can ruin their quality of work and mental peace (Zhang et al., 2015).
Explanation of 7 quality control tools and techniques
The seven quality control tools and techniques are as follows:
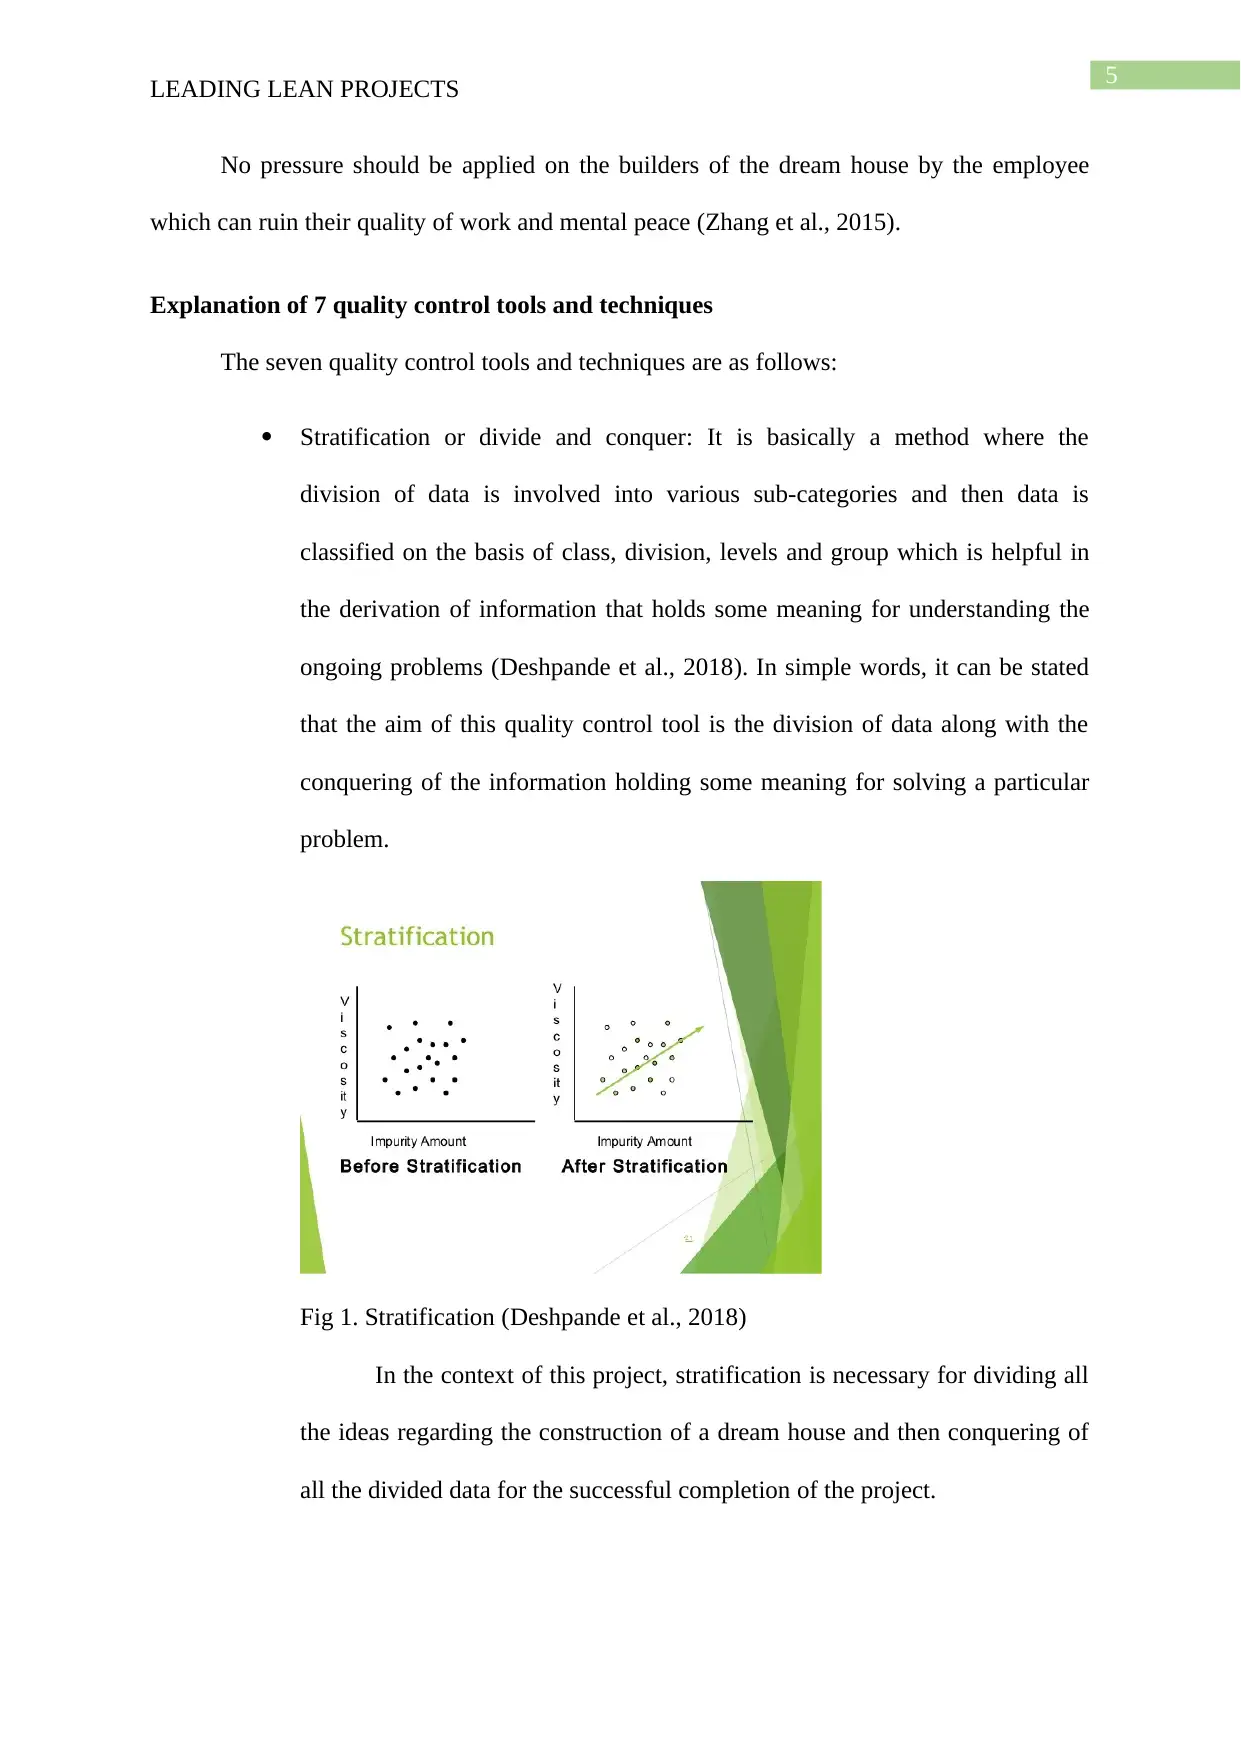
Stratification or divide and conquer: It is basically a method where the
division of data is involved into various sub-categories and then data is
classified on the basis of class, division, levels and group which is helpful in
the derivation of information that holds some meaning for understanding the
ongoing problems (Deshpande et al., 2018). In simple words, it can be stated
that the aim of this quality control tool is the division of data along with the
conquering of the information holding some meaning for solving a particular
problem.
Fig 1. Stratification (Deshpande et al., 2018)
In the context of this project, stratification is necessary for dividing all
the ideas regarding the construction of a dream house and then conquering of
all the divided data for the successful completion of the project.
LEADING LEAN PROJECTS
No pressure should be applied on the builders of the dream house by the employee
which can ruin their quality of work and mental peace (Zhang et al., 2015).
Explanation of 7 quality control tools and techniques
The seven quality control tools and techniques are as follows:
Stratification or divide and conquer: It is basically a method where the
division of data is involved into various sub-categories and then data is
classified on the basis of class, division, levels and group which is helpful in
the derivation of information that holds some meaning for understanding the
ongoing problems (Deshpande et al., 2018). In simple words, it can be stated
that the aim of this quality control tool is the division of data along with the
conquering of the information holding some meaning for solving a particular
problem.
Fig 1. Stratification (Deshpande et al., 2018)
In the context of this project, stratification is necessary for dividing all
the ideas regarding the construction of a dream house and then conquering of
all the divided data for the successful completion of the project.
⊘ This is a preview!⊘
Do you want full access?
Subscribe today to unlock all pages.
Trusted by 1+ million students worldwide
6
LEADING LEAN PROJECTS
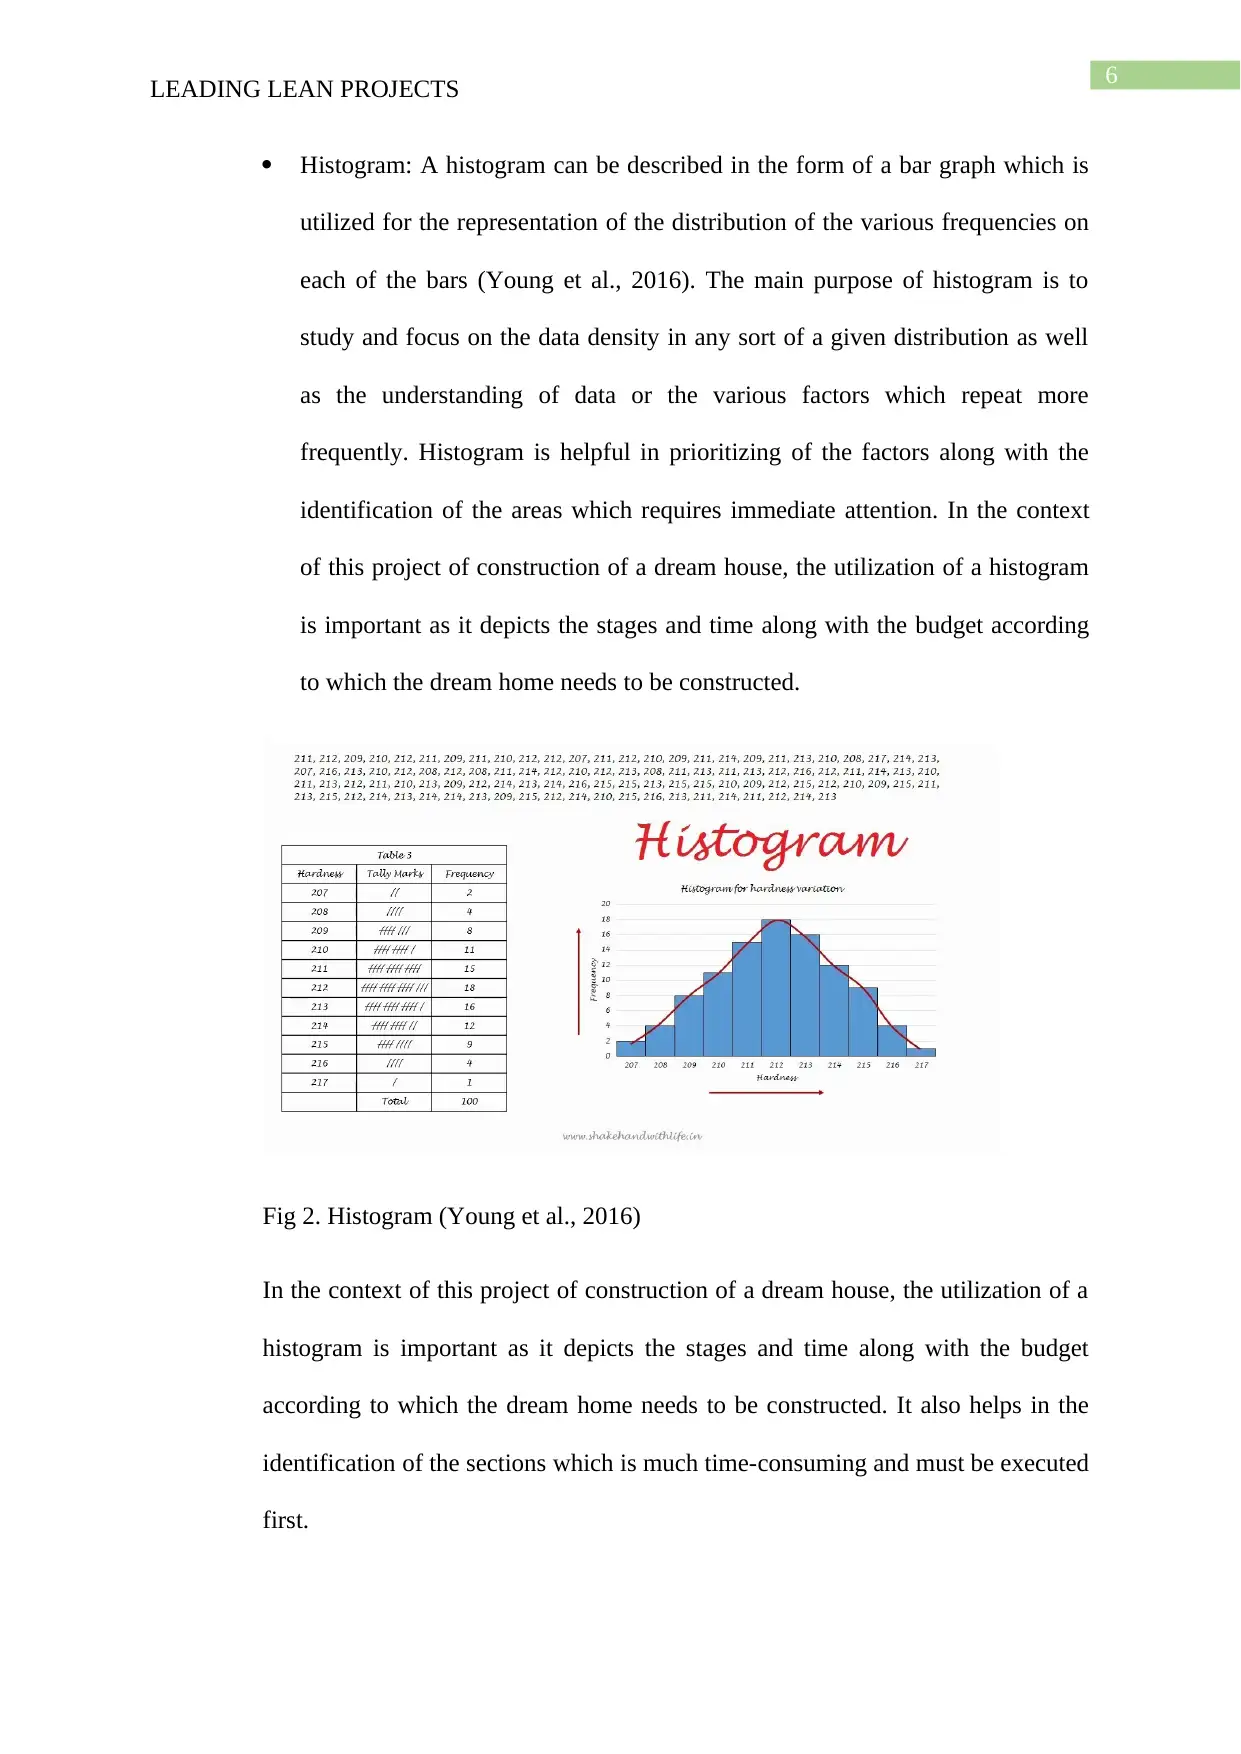
Histogram: A histogram can be described in the form of a bar graph which is
utilized for the representation of the distribution of the various frequencies on
each of the bars (Young et al., 2016). The main purpose of histogram is to
study and focus on the data density in any sort of a given distribution as well
as the understanding of data or the various factors which repeat more
frequently. Histogram is helpful in prioritizing of the factors along with the
identification of the areas which requires immediate attention. In the context
of this project of construction of a dream house, the utilization of a histogram
is important as it depicts the stages and time along with the budget according
to which the dream home needs to be constructed.
Fig 2. Histogram (Young et al., 2016)
In the context of this project of construction of a dream house, the utilization of a
histogram is important as it depicts the stages and time along with the budget
according to which the dream home needs to be constructed. It also helps in the
identification of the sections which is much time-consuming and must be executed
first.
LEADING LEAN PROJECTS
Histogram: A histogram can be described in the form of a bar graph which is
utilized for the representation of the distribution of the various frequencies on
each of the bars (Young et al., 2016). The main purpose of histogram is to
study and focus on the data density in any sort of a given distribution as well
as the understanding of data or the various factors which repeat more
frequently. Histogram is helpful in prioritizing of the factors along with the
identification of the areas which requires immediate attention. In the context
of this project of construction of a dream house, the utilization of a histogram
is important as it depicts the stages and time along with the budget according
to which the dream home needs to be constructed.
Fig 2. Histogram (Young et al., 2016)
In the context of this project of construction of a dream house, the utilization of a
histogram is important as it depicts the stages and time along with the budget
according to which the dream home needs to be constructed. It also helps in the
identification of the sections which is much time-consuming and must be executed
first.
Paraphrase This Document
Need a fresh take? Get an instant paraphrase of this document with our AI Paraphraser
7
LEADING LEAN PROJECTS
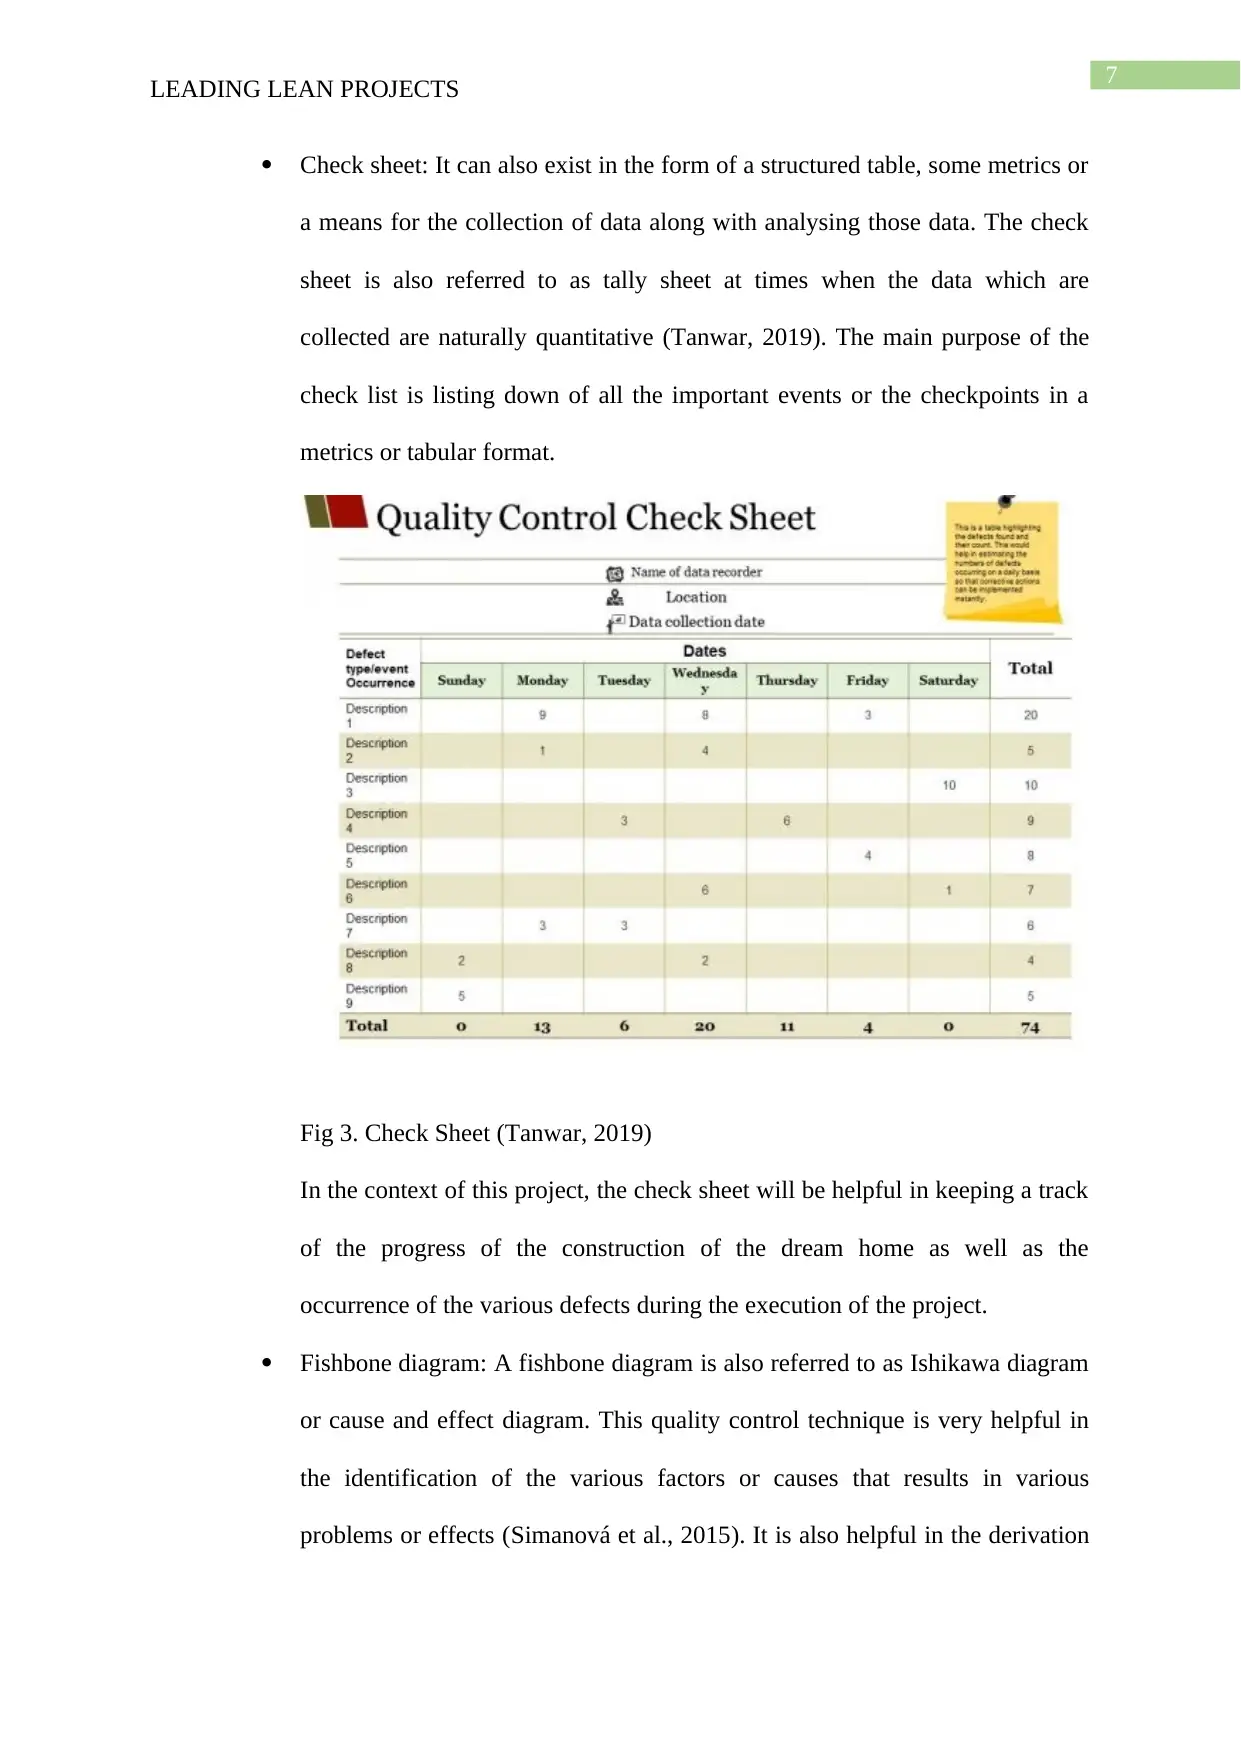
Check sheet: It can also exist in the form of a structured table, some metrics or
a means for the collection of data along with analysing those data. The check
sheet is also referred to as tally sheet at times when the data which are
collected are naturally quantitative (Tanwar, 2019). The main purpose of the
check list is listing down of all the important events or the checkpoints in a
metrics or tabular format.
Fig 3. Check Sheet (Tanwar, 2019)
In the context of this project, the check sheet will be helpful in keeping a track
of the progress of the construction of the dream home as well as the
occurrence of the various defects during the execution of the project.
Fishbone diagram: A fishbone diagram is also referred to as Ishikawa diagram
or cause and effect diagram. This quality control technique is very helpful in
the identification of the various factors or causes that results in various
problems or effects (Simanová et al., 2015). It is also helpful in the derivation
LEADING LEAN PROJECTS
Check sheet: It can also exist in the form of a structured table, some metrics or
a means for the collection of data along with analysing those data. The check
sheet is also referred to as tally sheet at times when the data which are
collected are naturally quantitative (Tanwar, 2019). The main purpose of the
check list is listing down of all the important events or the checkpoints in a
metrics or tabular format.
Fig 3. Check Sheet (Tanwar, 2019)
In the context of this project, the check sheet will be helpful in keeping a track
of the progress of the construction of the dream home as well as the
occurrence of the various defects during the execution of the project.
Fishbone diagram: A fishbone diagram is also referred to as Ishikawa diagram
or cause and effect diagram. This quality control technique is very helpful in
the identification of the various factors or causes that results in various
problems or effects (Simanová et al., 2015). It is also helpful in the derivation
8
LEADING LEAN PROJECTS
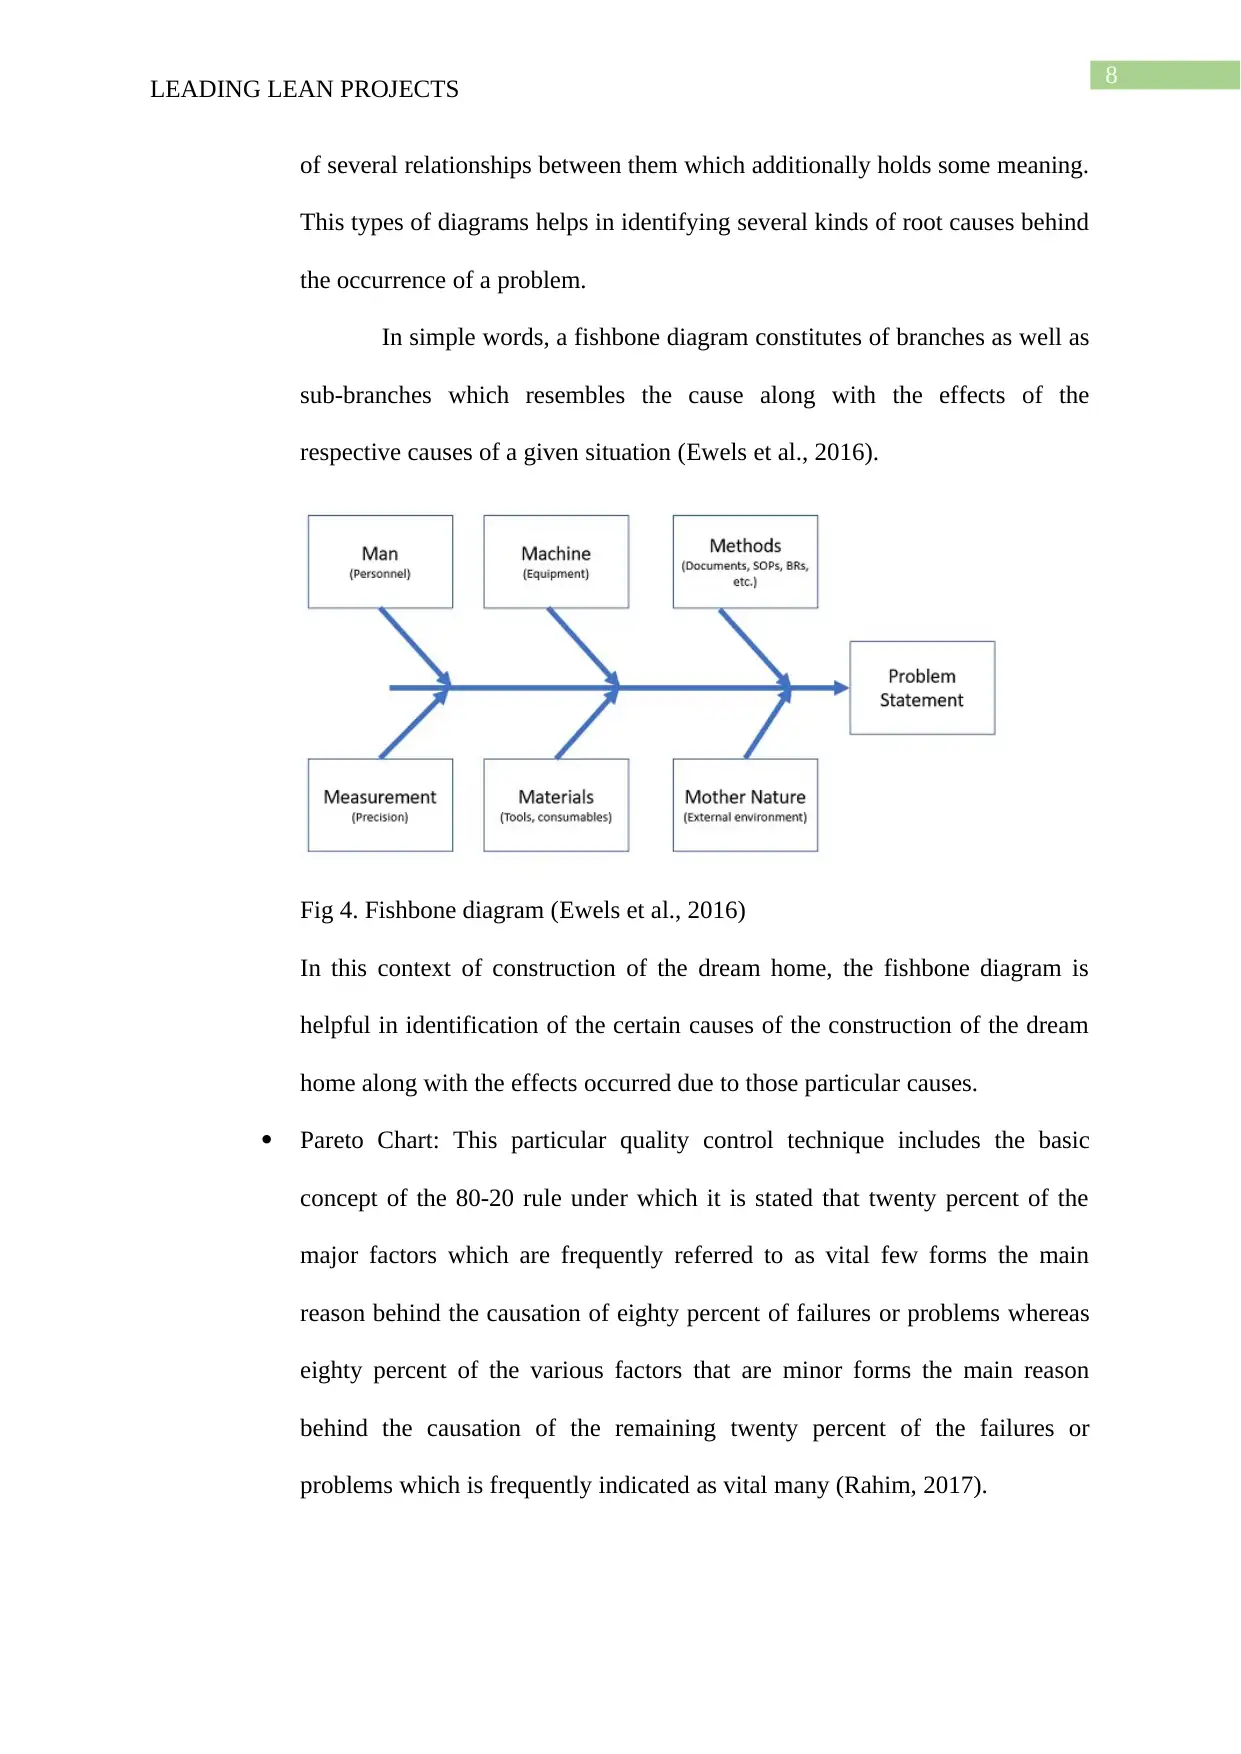
of several relationships between them which additionally holds some meaning.
This types of diagrams helps in identifying several kinds of root causes behind
the occurrence of a problem.
In simple words, a fishbone diagram constitutes of branches as well as
sub-branches which resembles the cause along with the effects of the
respective causes of a given situation (Ewels et al., 2016).
Fig 4. Fishbone diagram (Ewels et al., 2016)
In this context of construction of the dream home, the fishbone diagram is
helpful in identification of the certain causes of the construction of the dream
home along with the effects occurred due to those particular causes.
Pareto Chart: This particular quality control technique includes the basic
concept of the 80-20 rule under which it is stated that twenty percent of the
major factors which are frequently referred to as vital few forms the main
reason behind the causation of eighty percent of failures or problems whereas
eighty percent of the various factors that are minor forms the main reason
behind the causation of the remaining twenty percent of the failures or
problems which is frequently indicated as vital many (Rahim, 2017).
LEADING LEAN PROJECTS
of several relationships between them which additionally holds some meaning.
This types of diagrams helps in identifying several kinds of root causes behind
the occurrence of a problem.
In simple words, a fishbone diagram constitutes of branches as well as
sub-branches which resembles the cause along with the effects of the
respective causes of a given situation (Ewels et al., 2016).
Fig 4. Fishbone diagram (Ewels et al., 2016)
In this context of construction of the dream home, the fishbone diagram is
helpful in identification of the certain causes of the construction of the dream
home along with the effects occurred due to those particular causes.
Pareto Chart: This particular quality control technique includes the basic
concept of the 80-20 rule under which it is stated that twenty percent of the
major factors which are frequently referred to as vital few forms the main
reason behind the causation of eighty percent of failures or problems whereas
eighty percent of the various factors that are minor forms the main reason
behind the causation of the remaining twenty percent of the failures or
problems which is frequently indicated as vital many (Rahim, 2017).
⊘ This is a preview!⊘
Do you want full access?
Subscribe today to unlock all pages.
Trusted by 1+ million students worldwide
9
LEADING LEAN PROJECTS
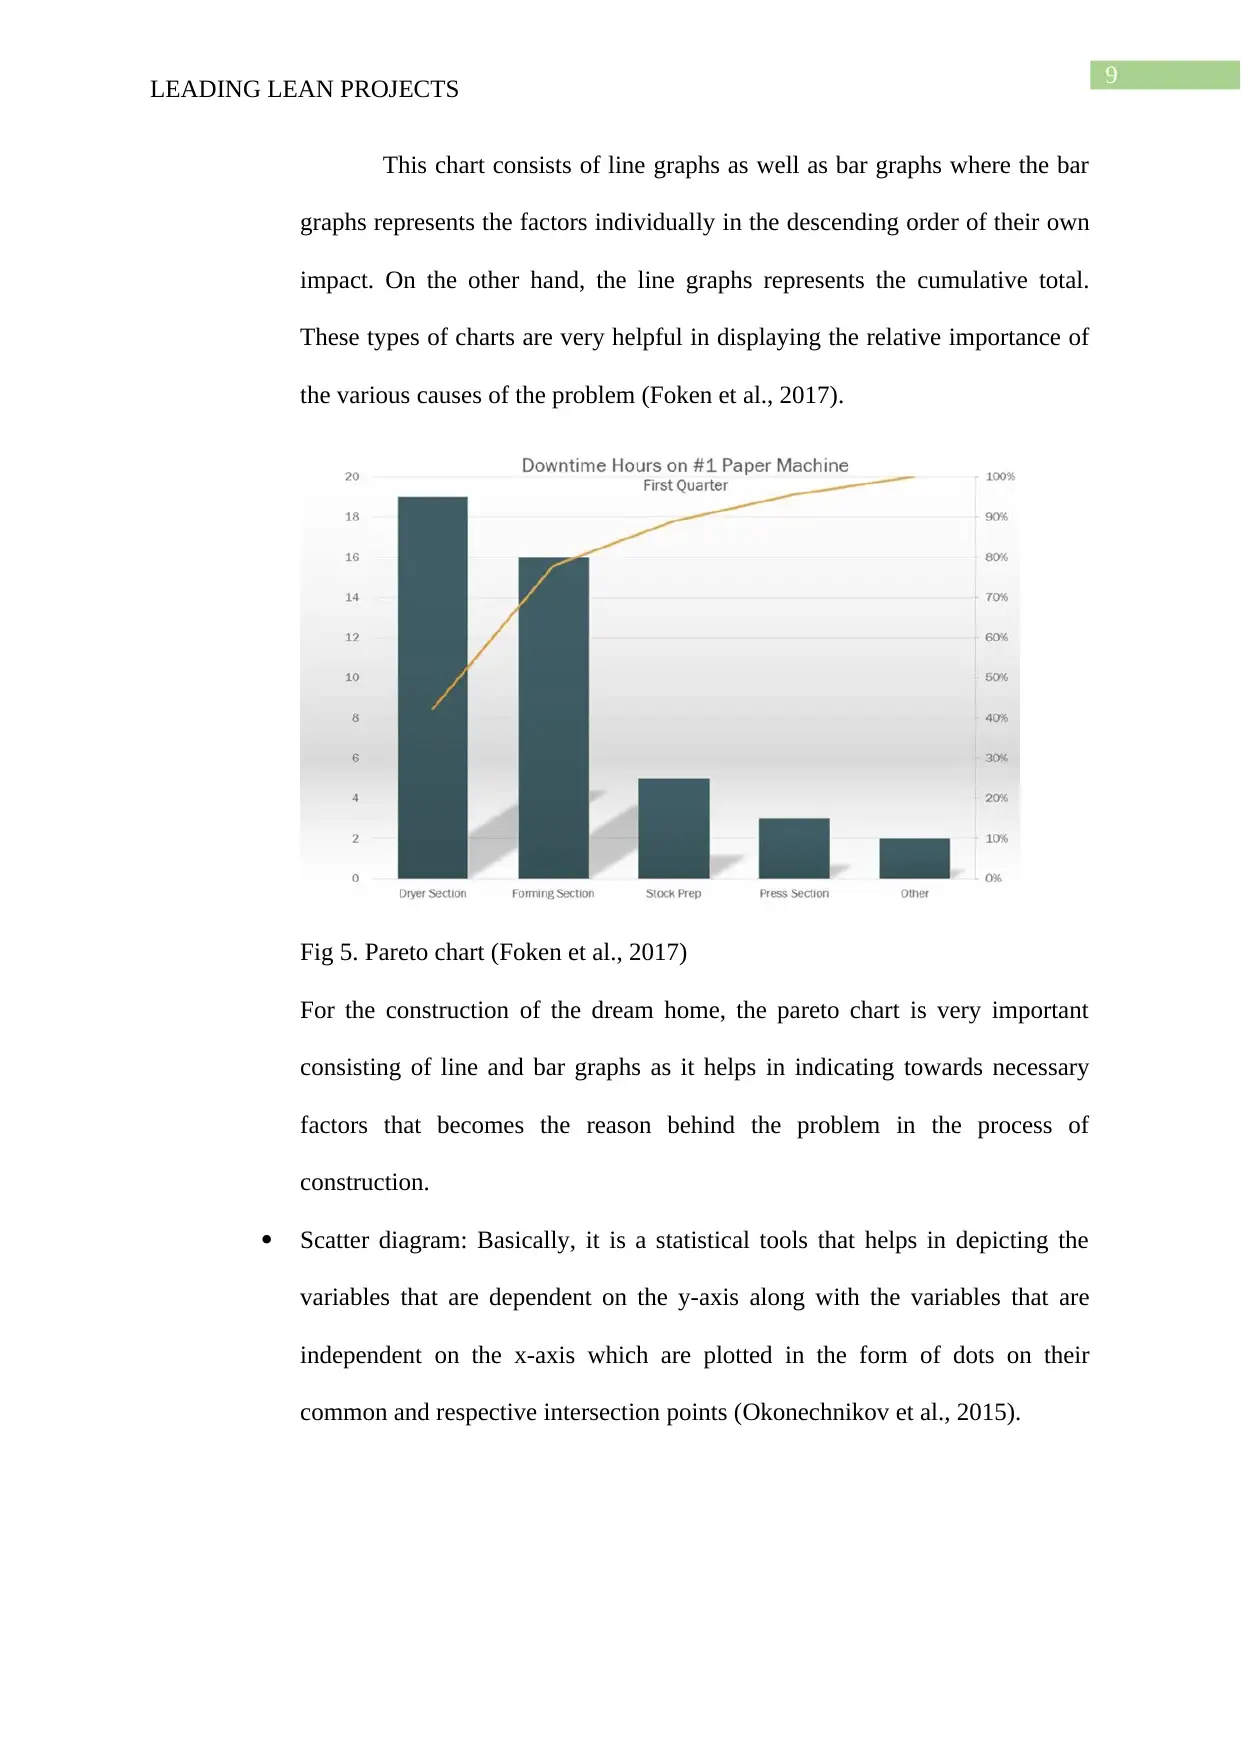
This chart consists of line graphs as well as bar graphs where the bar
graphs represents the factors individually in the descending order of their own
impact. On the other hand, the line graphs represents the cumulative total.
These types of charts are very helpful in displaying the relative importance of
the various causes of the problem (Foken et al., 2017).
Fig 5. Pareto chart (Foken et al., 2017)
For the construction of the dream home, the pareto chart is very important
consisting of line and bar graphs as it helps in indicating towards necessary
factors that becomes the reason behind the problem in the process of
construction.
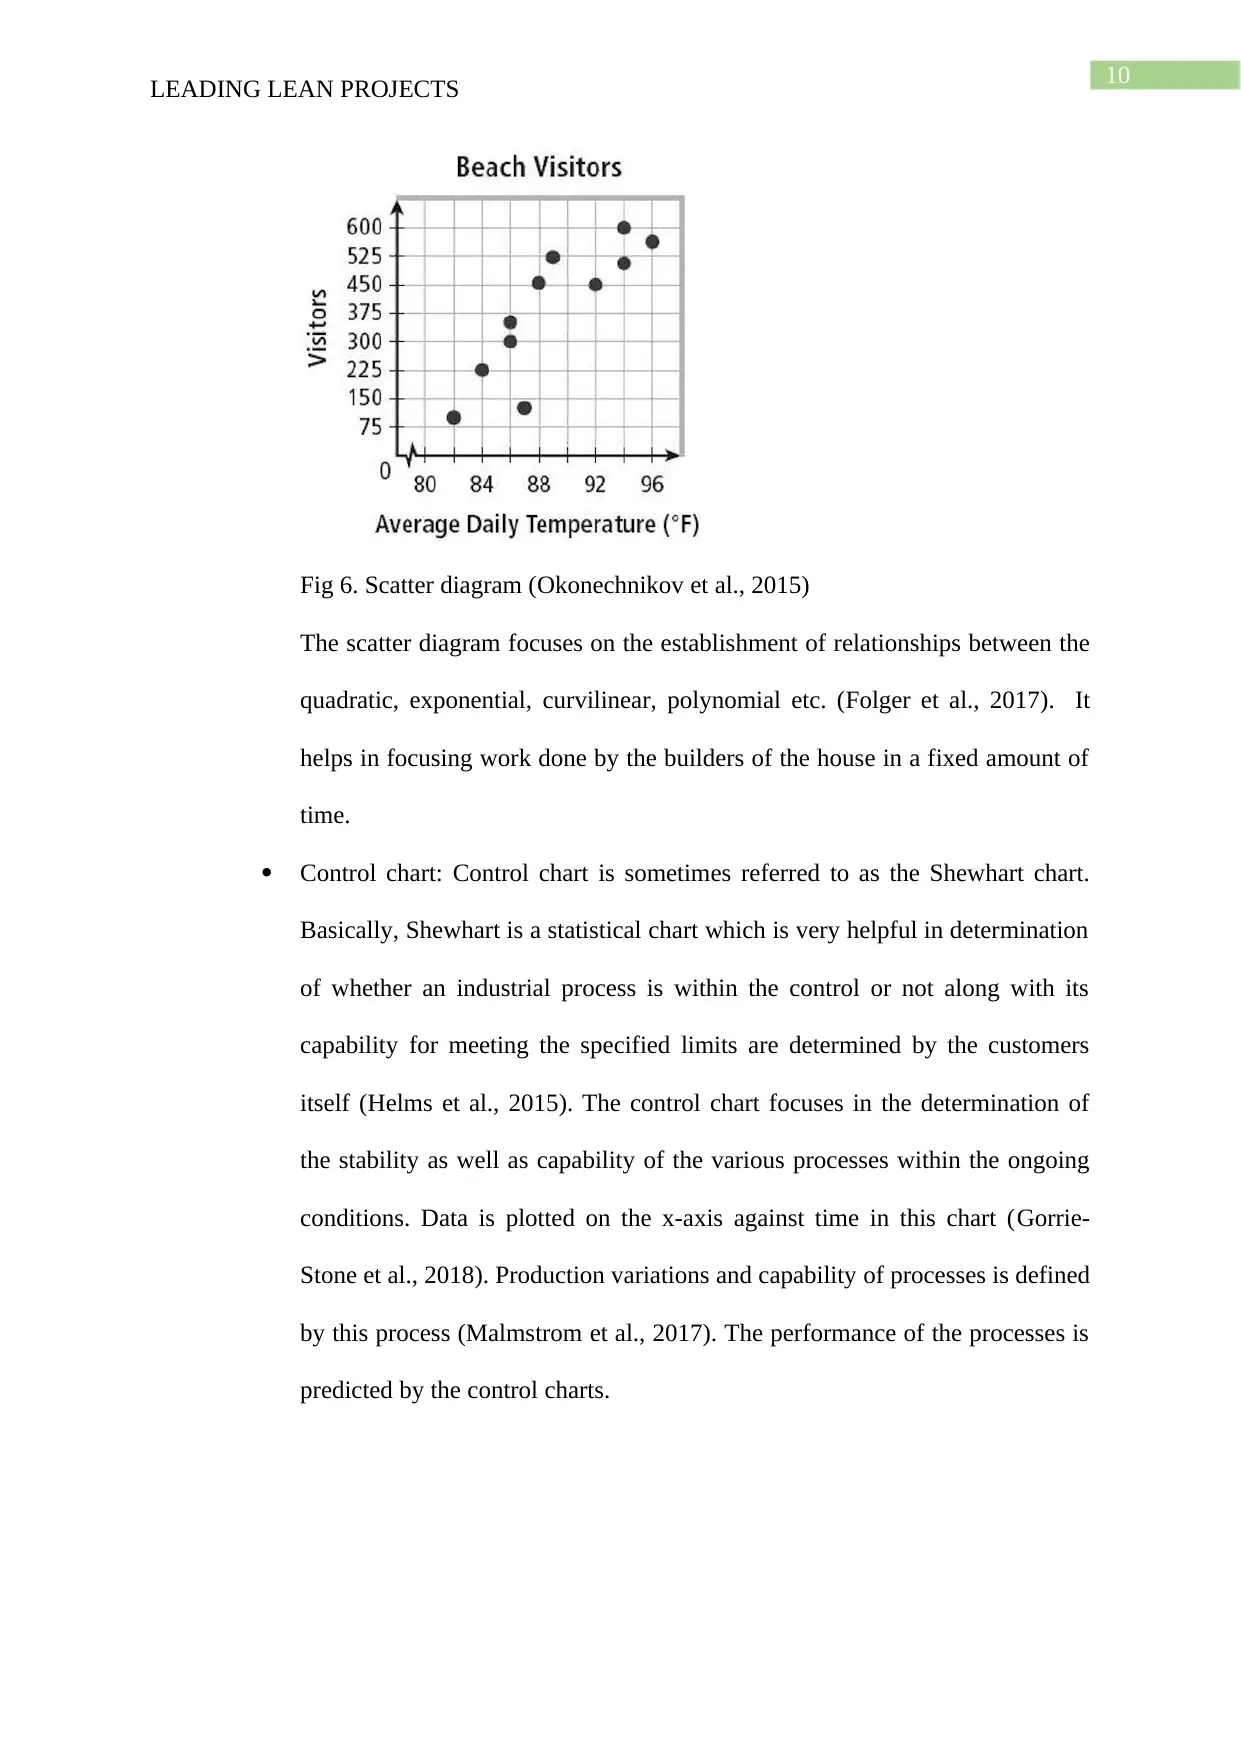
Scatter diagram: Basically, it is a statistical tools that helps in depicting the
variables that are dependent on the y-axis along with the variables that are
independent on the x-axis which are plotted in the form of dots on their
common and respective intersection points (Okonechnikov et al., 2015).
LEADING LEAN PROJECTS
This chart consists of line graphs as well as bar graphs where the bar
graphs represents the factors individually in the descending order of their own
impact. On the other hand, the line graphs represents the cumulative total.
These types of charts are very helpful in displaying the relative importance of
the various causes of the problem (Foken et al., 2017).
Fig 5. Pareto chart (Foken et al., 2017)
For the construction of the dream home, the pareto chart is very important
consisting of line and bar graphs as it helps in indicating towards necessary
factors that becomes the reason behind the problem in the process of
construction.
Scatter diagram: Basically, it is a statistical tools that helps in depicting the
variables that are dependent on the y-axis along with the variables that are
independent on the x-axis which are plotted in the form of dots on their
common and respective intersection points (Okonechnikov et al., 2015).
Paraphrase This Document
Need a fresh take? Get an instant paraphrase of this document with our AI Paraphraser
10
LEADING LEAN PROJECTS
Fig 6. Scatter diagram (Okonechnikov et al., 2015)
The scatter diagram focuses on the establishment of relationships between the
quadratic, exponential, curvilinear, polynomial etc. (Folger et al., 2017). It
helps in focusing work done by the builders of the house in a fixed amount of
time.
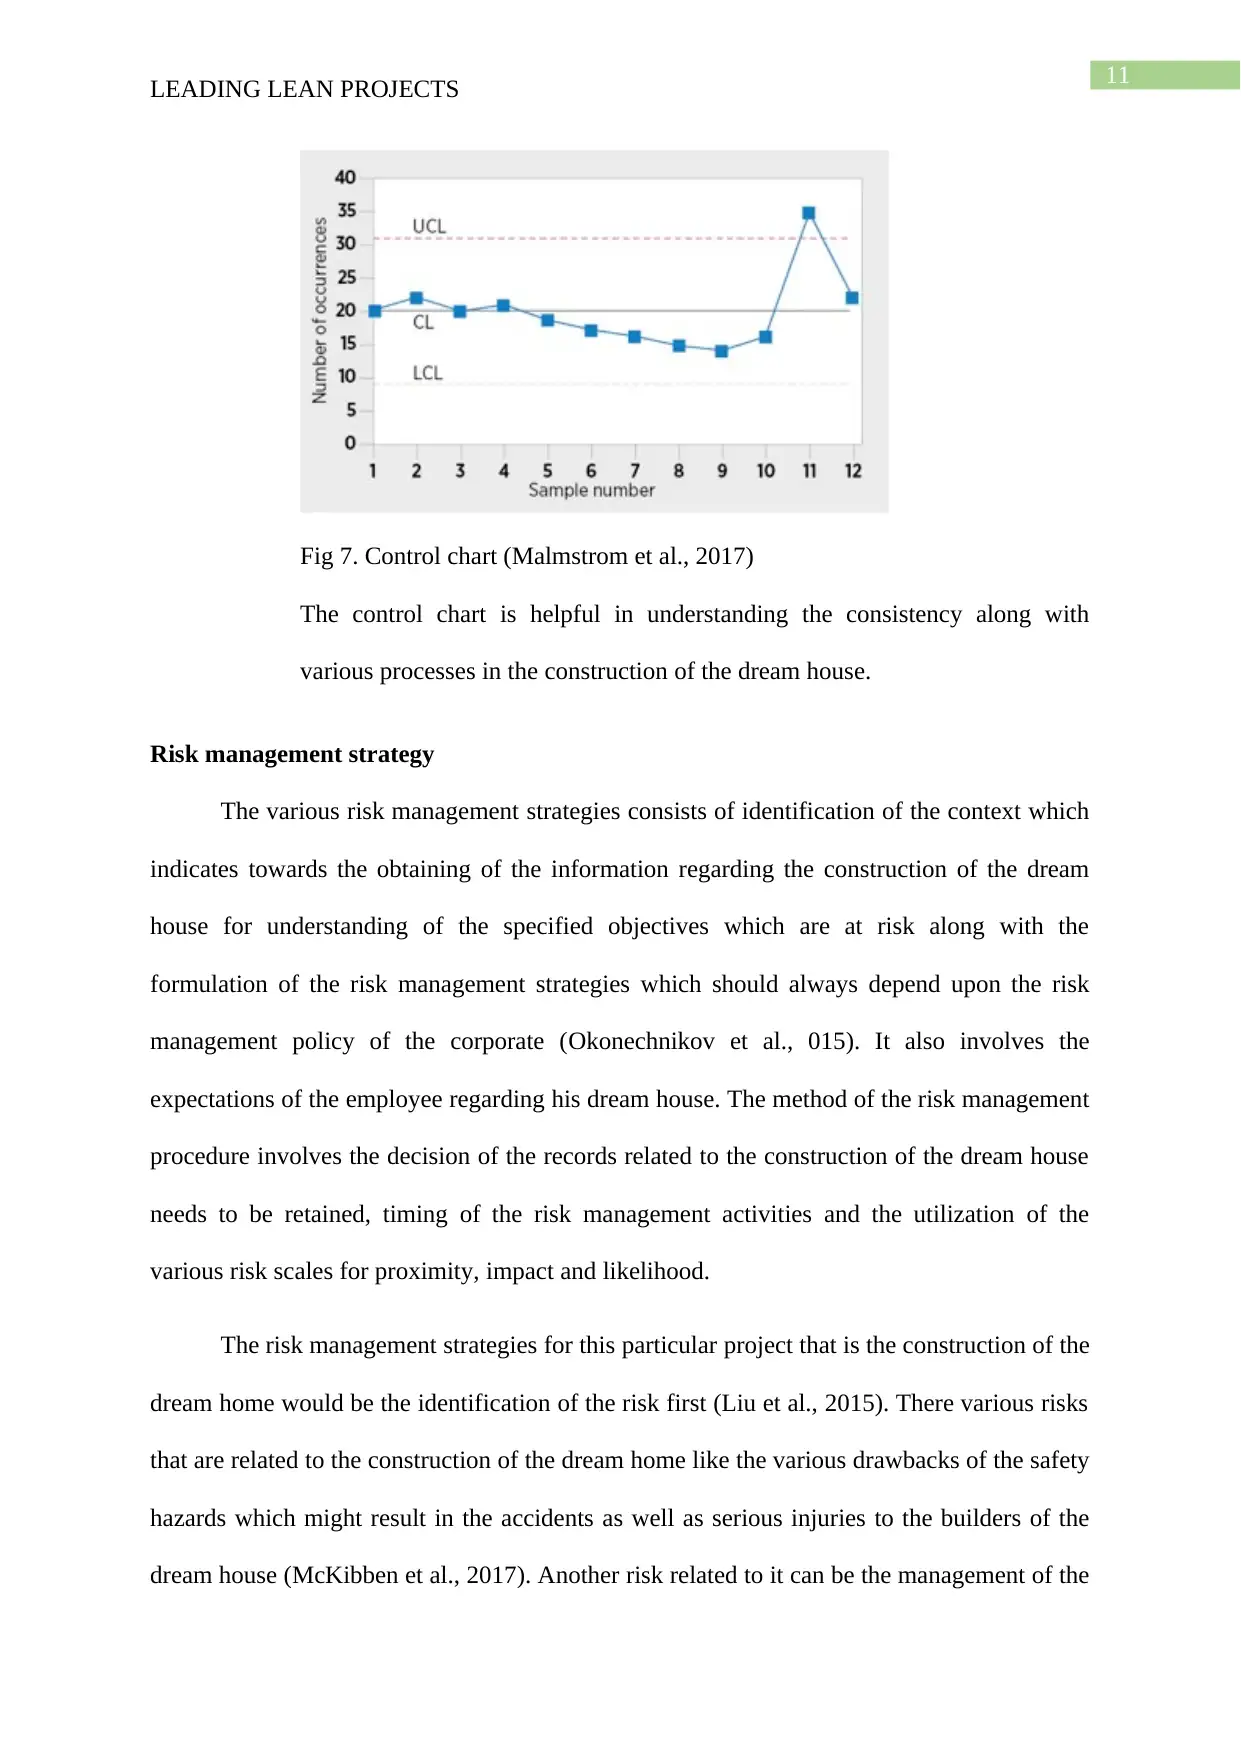
Control chart: Control chart is sometimes referred to as the Shewhart chart.
Basically, Shewhart is a statistical chart which is very helpful in determination
of whether an industrial process is within the control or not along with its
capability for meeting the specified limits are determined by the customers
itself (Helms et al., 2015). The control chart focuses in the determination of
the stability as well as capability of the various processes within the ongoing
conditions. Data is plotted on the x-axis against time in this chart (Gorrie-
Stone et al., 2018). Production variations and capability of processes is defined
by this process (Malmstrom et al., 2017). The performance of the processes is
predicted by the control charts.
LEADING LEAN PROJECTS
Fig 6. Scatter diagram (Okonechnikov et al., 2015)
The scatter diagram focuses on the establishment of relationships between the
quadratic, exponential, curvilinear, polynomial etc. (Folger et al., 2017). It
helps in focusing work done by the builders of the house in a fixed amount of
time.
Control chart: Control chart is sometimes referred to as the Shewhart chart.
Basically, Shewhart is a statistical chart which is very helpful in determination
of whether an industrial process is within the control or not along with its
capability for meeting the specified limits are determined by the customers
itself (Helms et al., 2015). The control chart focuses in the determination of
the stability as well as capability of the various processes within the ongoing
conditions. Data is plotted on the x-axis against time in this chart (Gorrie-
Stone et al., 2018). Production variations and capability of processes is defined
by this process (Malmstrom et al., 2017). The performance of the processes is
predicted by the control charts.
11
LEADING LEAN PROJECTS
Fig 7. Control chart (Malmstrom et al., 2017)
The control chart is helpful in understanding the consistency along with
various processes in the construction of the dream house.
Risk management strategy
The various risk management strategies consists of identification of the context which
indicates towards the obtaining of the information regarding the construction of the dream
house for understanding of the specified objectives which are at risk along with the
formulation of the risk management strategies which should always depend upon the risk
management policy of the corporate (Okonechnikov et al., 015). It also involves the
expectations of the employee regarding his dream house. The method of the risk management
procedure involves the decision of the records related to the construction of the dream house
needs to be retained, timing of the risk management activities and the utilization of the
various risk scales for proximity, impact and likelihood.
The risk management strategies for this particular project that is the construction of the
dream home would be the identification of the risk first (Liu et al., 2015). There various risks
that are related to the construction of the dream home like the various drawbacks of the safety
hazards which might result in the accidents as well as serious injuries to the builders of the
dream house (McKibben et al., 2017). Another risk related to it can be the management of the
⊘ This is a preview!⊘
Do you want full access?
Subscribe today to unlock all pages.
Trusted by 1+ million students worldwide
1 out of 20
Related Documents


Your All-in-One AI-Powered Toolkit for Academic Success.
+13062052269
info@desklib.com
Available 24*7 on WhatsApp / Email
![[object Object]](/_next/static/media/star-bottom.7253800d.svg)
Unlock your academic potential
Copyright © 2020–2026 A2Z Services. All Rights Reserved. Developed and managed by ZUCOL.