Statistics (STAT-490) Assignment 1: Data Analysis and Interpretation

Verified

Added on  2023/04/22

|5
|833
|198
Homework Assignment
AI Summary
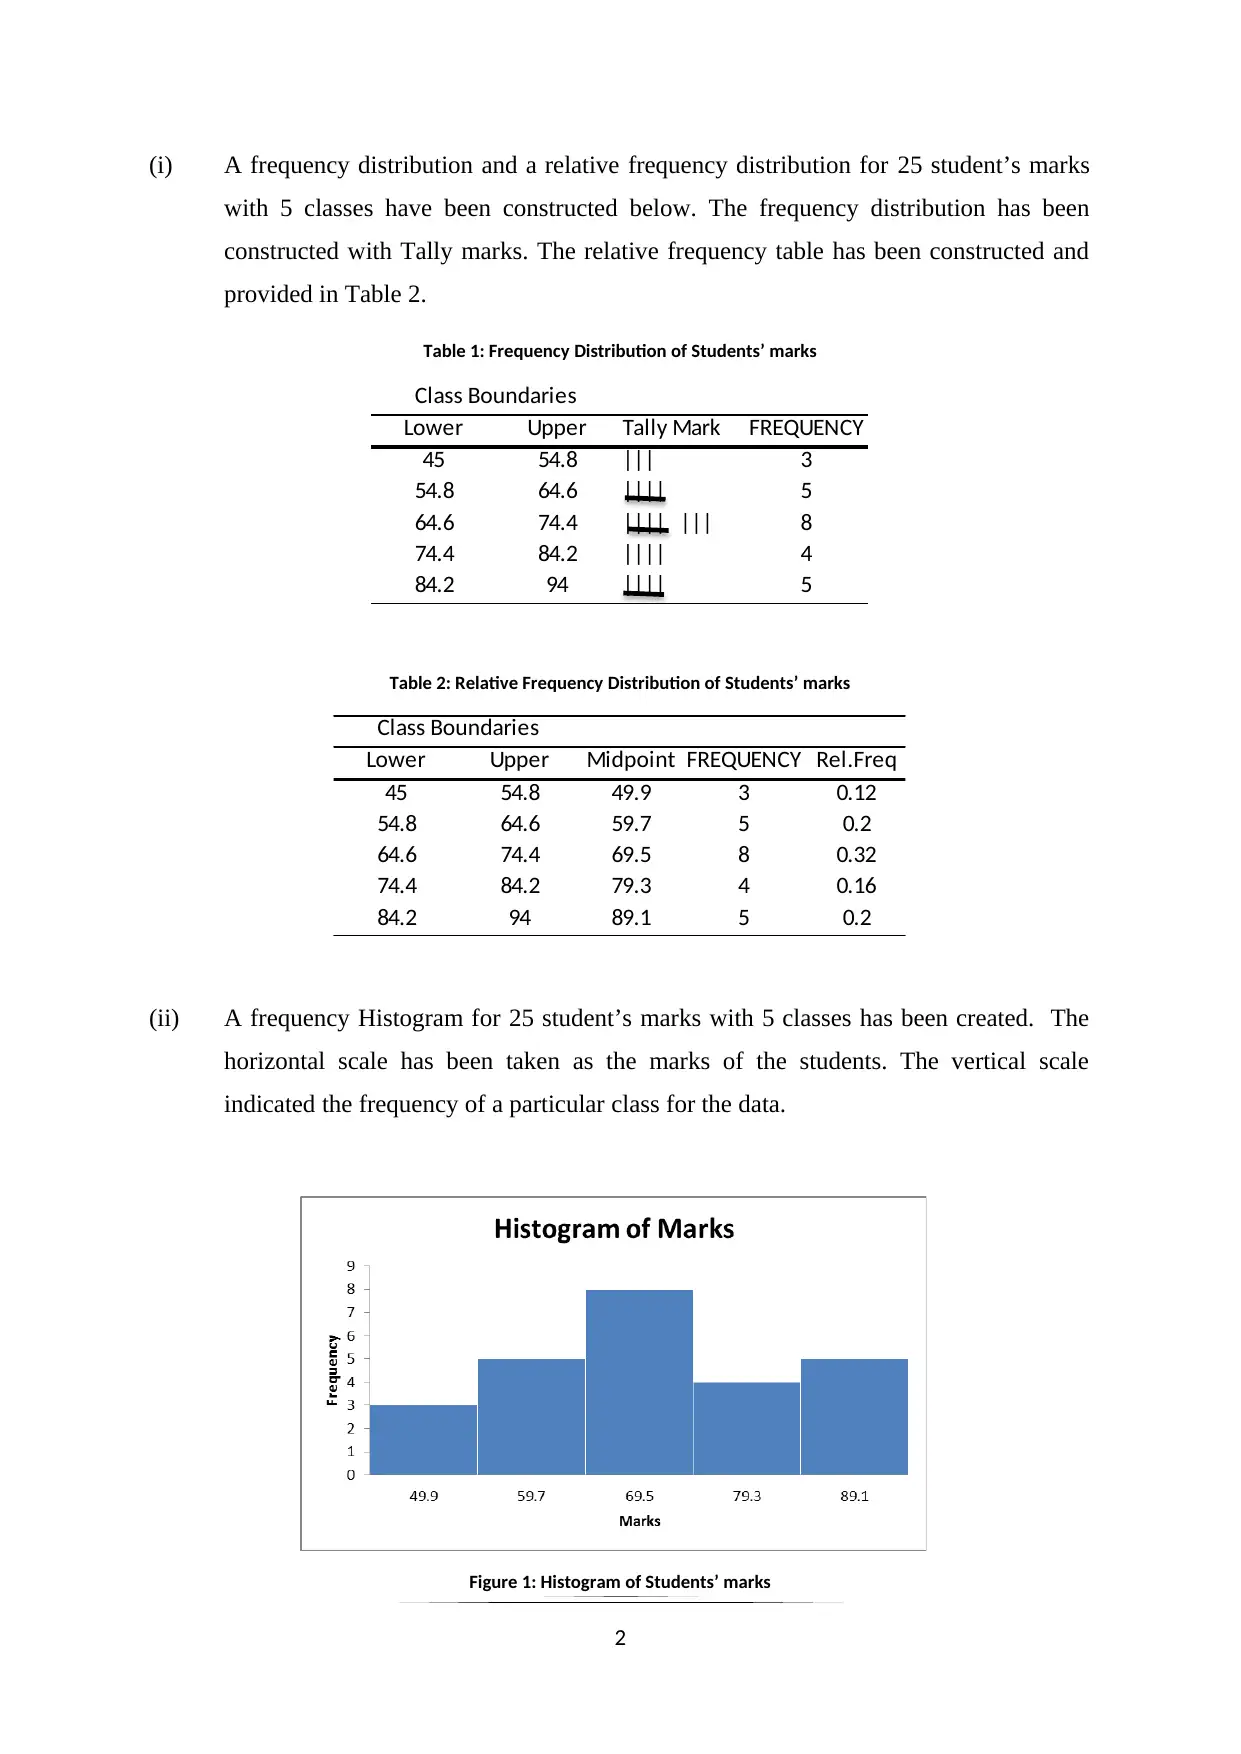
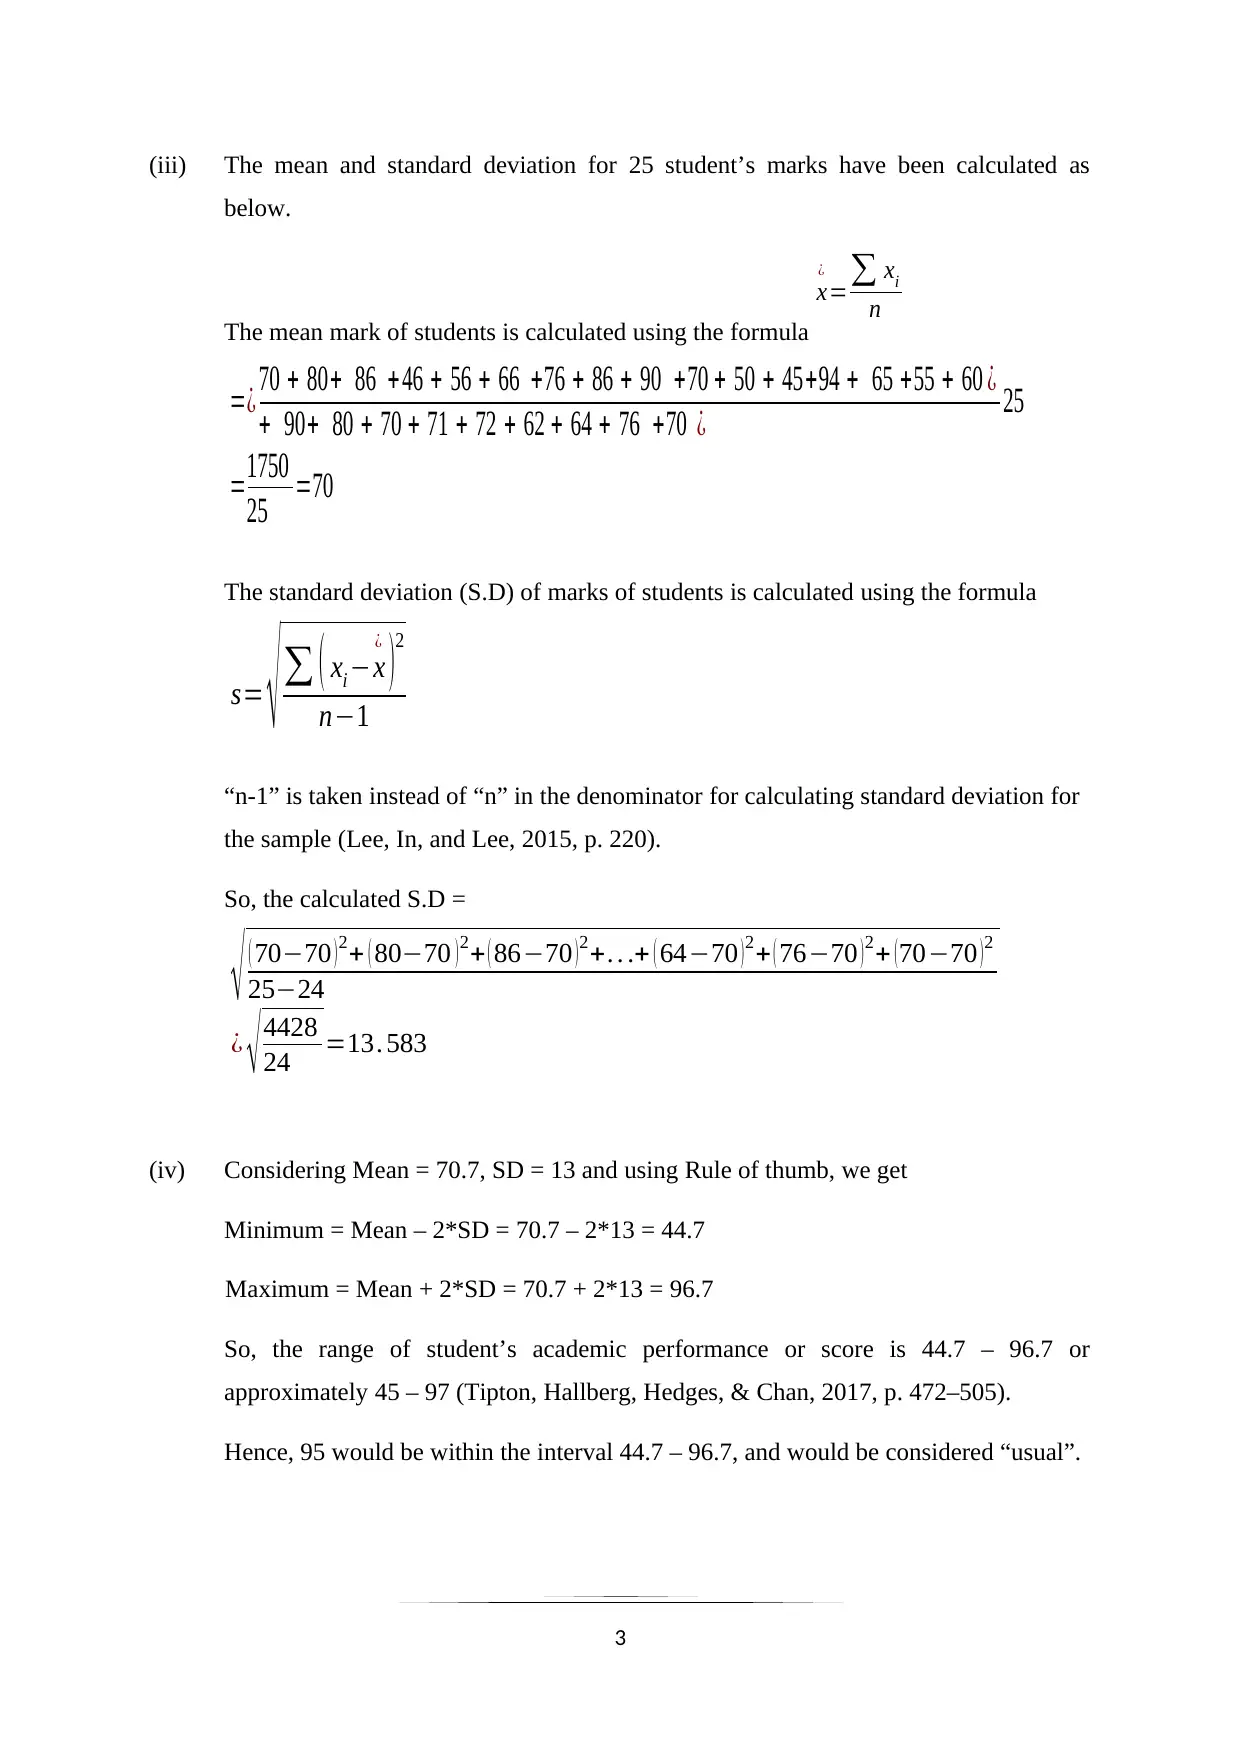
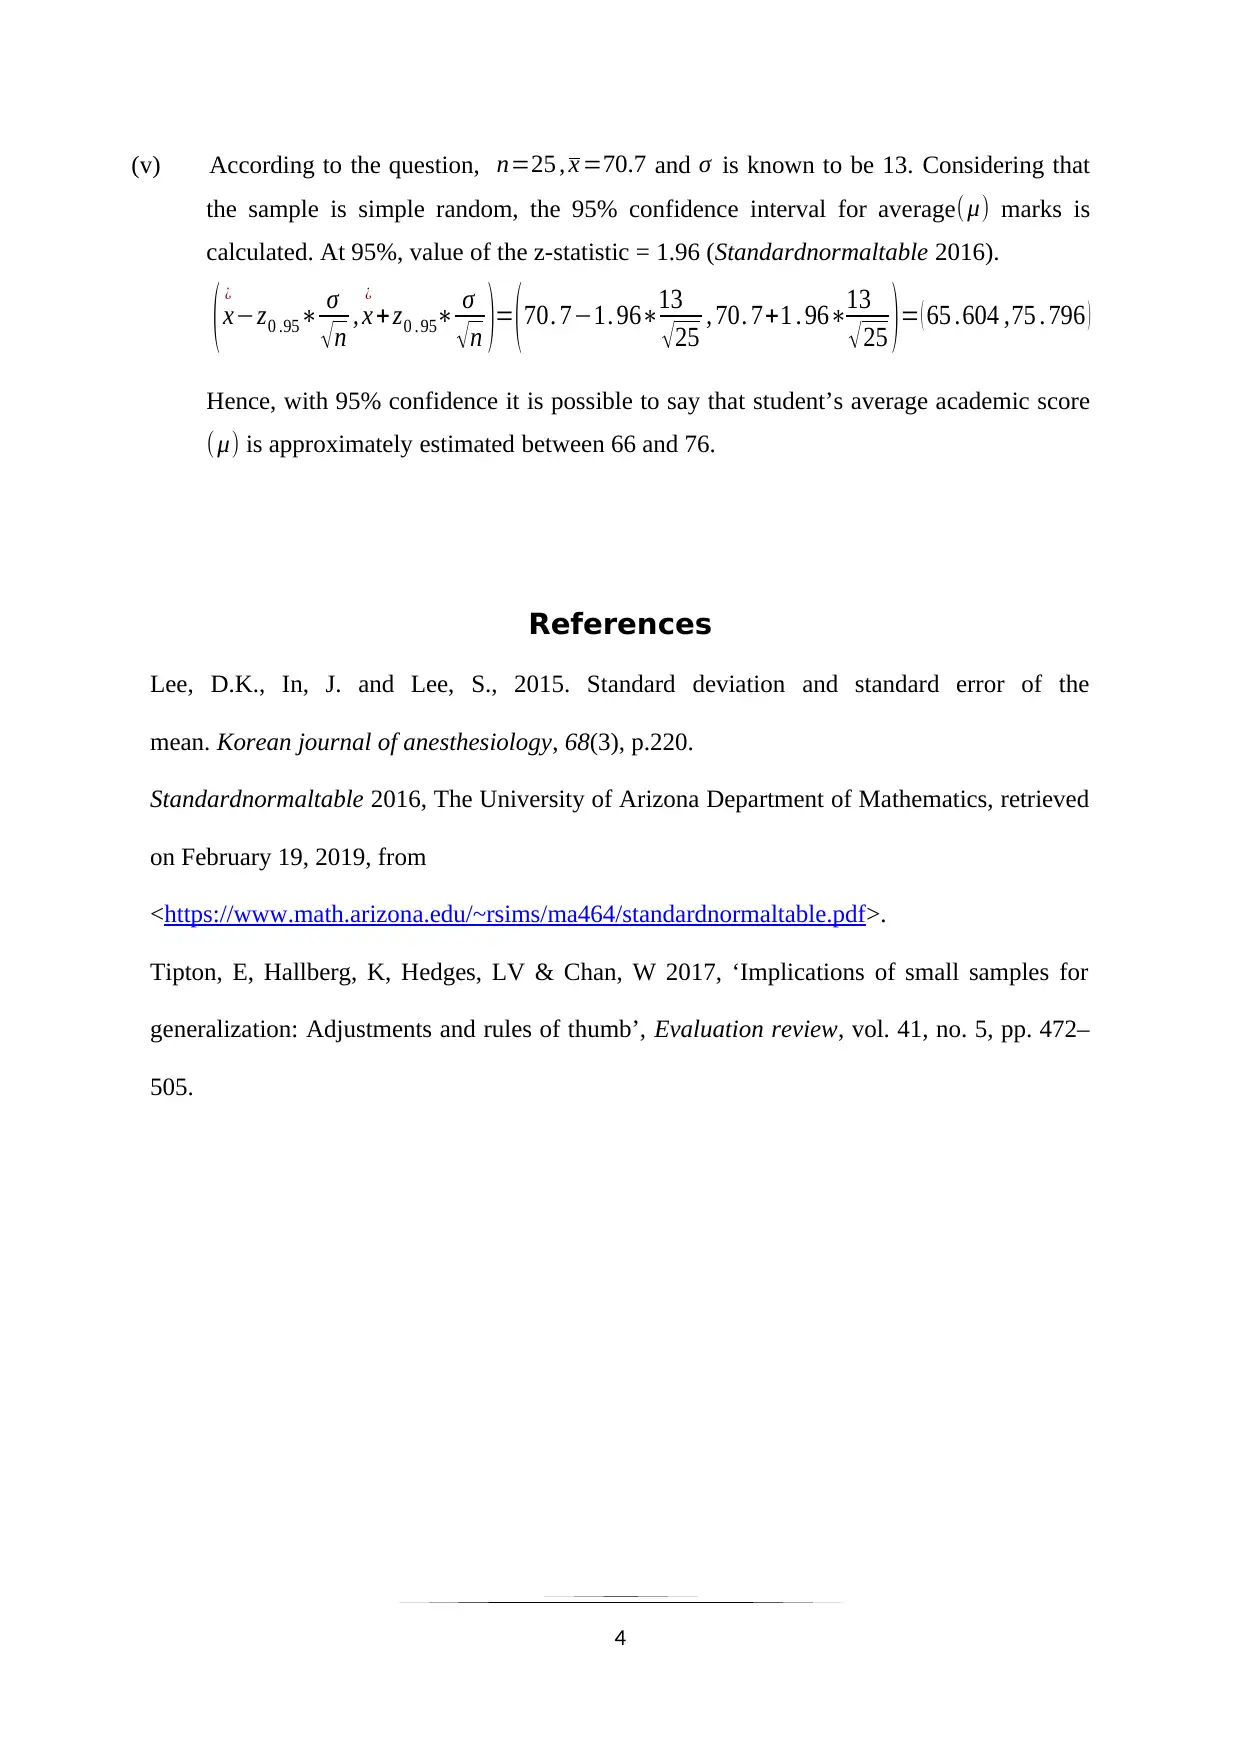
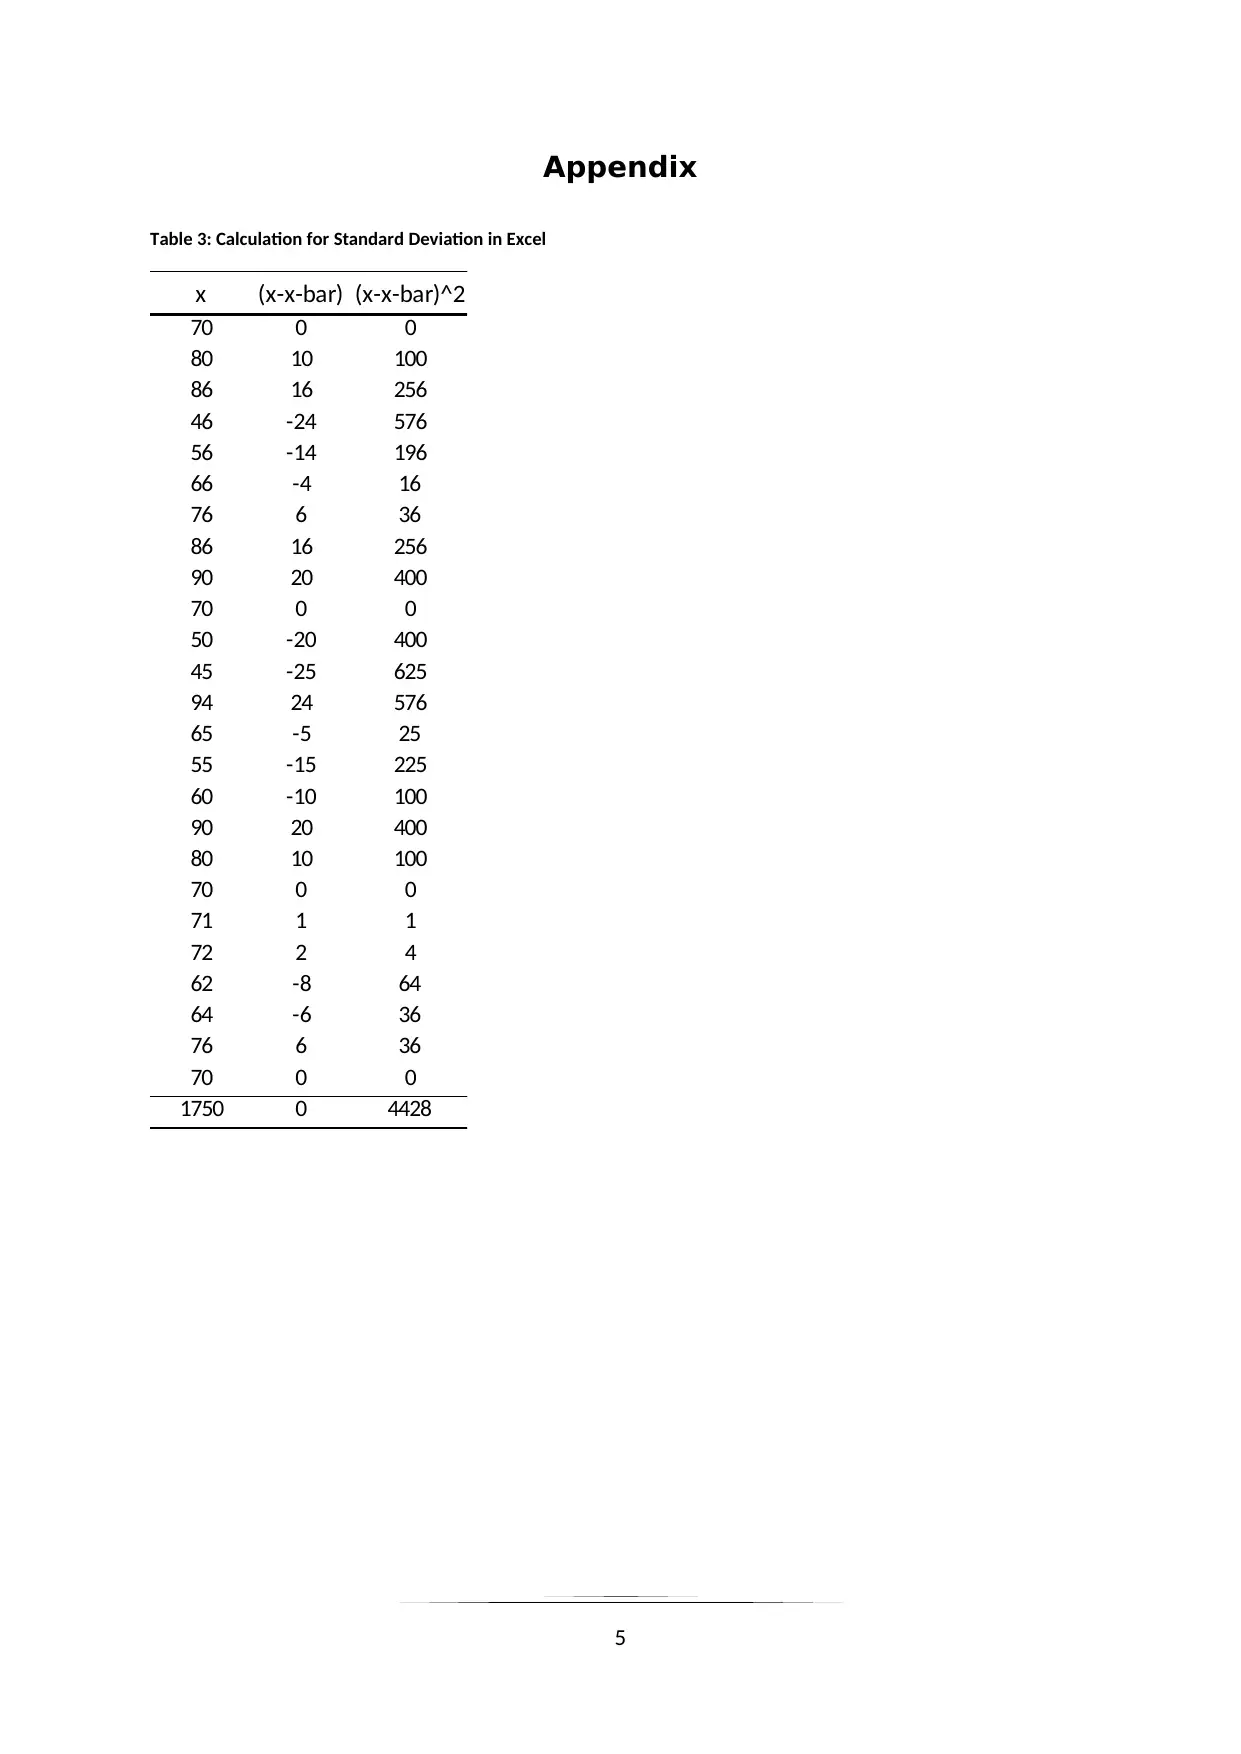
This document presents a complete solution to a statistics assignment (STAT-490) for a Pre-MBA student. The assignment focuses on descriptive statistics, starting with the construction of frequency and relative frequency distributions for a dataset of 25 student marks, using 5 classes. A frequency histogram is created to visualize the data. The solution includes the calculation of the mean and standard deviation for the marks, along with a detailed breakdown of the formulas used. Furthermore, the document applies the range rule to estimate the range of student academic performance. Finally, a 95% confidence interval for the average marks is calculated using the z-statistic, providing an estimated range for the students' average academic score, incorporating relevant references to support the calculations and interpretations.
Document Page
STATISTICS (STAT-490) Pre MBA
Student Full Name:
Student ID:
CRN No:
Branch:
tabler-icon-diamond-filled.svg

Paraphrase This Document

Need a fresh take? Get an instant paraphrase of this document with our AI Paraphraser
Document Page
(i) A frequency distribution and a relative frequency distribution for 25 student’s marks
with 5 classes have been constructed below. The frequency distribution has been
constructed with Tally marks. The relative frequency table has been constructed and
provided in Table 2.
Table 1: Frequency Distribution of Students’ marks
Lower Upper Tally Mark FREQUENCY
45 54.8 ||| 3
54.8 64.6 |||| 5
64.6 74.4 |||| ||| 8
74.4 84.2 |||| 4
84.2 94 |||| 5
Class Boundaries
Table 2: Relative Frequency Distribution of Students’ marks
Lower Upper Midpoint FREQUENCY Rel.Freq
45 54.8 49.9 3 0.12
54.8 64.6 59.7 5 0.2
64.6 74.4 69.5 8 0.32
74.4 84.2 79.3 4 0.16
84.2 94 89.1 5 0.2
Class Boundaries
(ii) A frequency Histogram for 25 student’s marks with 5 classes has been created. The
horizontal scale has been taken as the marks of the students. The vertical scale
indicated the frequency of a particular class for the data.
Figure 1: Histogram of Students’ marks
2
Document Page
(iii) The mean and standard deviation for 25 student’s marks have been calculated as
below.
The mean mark of students is calculated using the formula
x
¿
= xi
n
=¿ 70 + 80+ 86 + 46 + 56 + 66 +76 + 86 + 90 +70 + 50 + 45+94 + 65 +55 + 60 ¿
+ 90+ 80 + 70 + 71 + 72 + 62 + 64 + 76 +70 ¿ 25
=1750
25 =70
The standard deviation (S.D) of marks of students is calculated using the formula
s= ( xi x
¿
)
2
n1
“n-1” is taken instead of “n” in the denominator for calculating standard deviation for
the sample (Lee, In, and Lee, 2015, p. 220).
So, the calculated S.D =
( 7070 ) 2+ ( 8070 ) 2+ ( 8670 ) 2+. . .+ ( 6470 ) 2+ ( 7670 ) 2+ ( 7070 ) 2
2524
¿ 4428
24 =13. 583
(iv) Considering Mean = 70.7, SD = 13 and using Rule of thumb, we get
Minimum = Mean – 2*SD = 70.7 – 2*13 = 44.7
Maximum = Mean + 2*SD = 70.7 + 2*13 = 96.7
So, the range of student’s academic performance or score is 44.7 96.7 or
approximately 45 – 97 (Tipton, Hallberg, Hedges, & Chan, 2017, p. 472–505).
Hence, 95 would be within the interval 44.7 – 96.7, and would be considered “usual”.
3
Document Page
(v) According to the question, n=25 , x =70.7 and σ is known to be 13. Considering that
the sample is simple random, the 95% confidence interval for average(μ) marks is
calculated. At 95%, value of the z-statistic = 1.96 (Standardnormaltable 2016).
( x
¿
z0 .95 σ
n , x
¿
+ z0 . 95 σ
n )= ( 70. 71. 9613
25 , 70. 7+1 . 9613
25 ) = ( 65 .604 ,75 . 796 )
Hence, with 95% confidence it is possible to say that student’s average academic score
(μ) is approximately estimated between 66 and 76.
References
Lee, D.K., In, J. and Lee, S., 2015. Standard deviation and standard error of the
mean. Korean journal of anesthesiology, 68(3), p.220.
Standardnormaltable 2016, The University of Arizona Department of Mathematics, retrieved
on February 19, 2019, from
<https://www.math.arizona.edu/~rsims/ma464/standardnormaltable.pdf>.
Tipton, E, Hallberg, K, Hedges, LV & Chan, W 2017, ‘Implications of small samples for
generalization: Adjustments and rules of thumb’, Evaluation review, vol. 41, no. 5, pp. 472–
505.
4
tabler-icon-diamond-filled.svg

Paraphrase This Document

Need a fresh take? Get an instant paraphrase of this document with our AI Paraphraser
Document Page
Appendix
Table 3: Calculation for Standard Deviation in Excel
x (x-x-bar) (x-x-bar)^2
70 0 0
80 10 100
86 16 256
46 -24 576
56 -14 196
66 -4 16
76 6 36
86 16 256
90 20 400
70 0 0
50 -20 400
45 -25 625
94 24 576
65 -5 25
55 -15 225
60 -10 100
90 20 400
80 10 100
70 0 0
71 1 1
72 2 4
62 -8 64
64 -6 36
76 6 36
70 0 0
1750 0 4428
5
chevron_up_icon
1 out of 5
circle_padding
hide_on_mobile
zoom_out_icon
[object Object]