Analytical Chemistry 1 Practical Report: Precision Analysis

Verified

Added on  2023/01/18

|3
|663
|47
Report
AI Summary
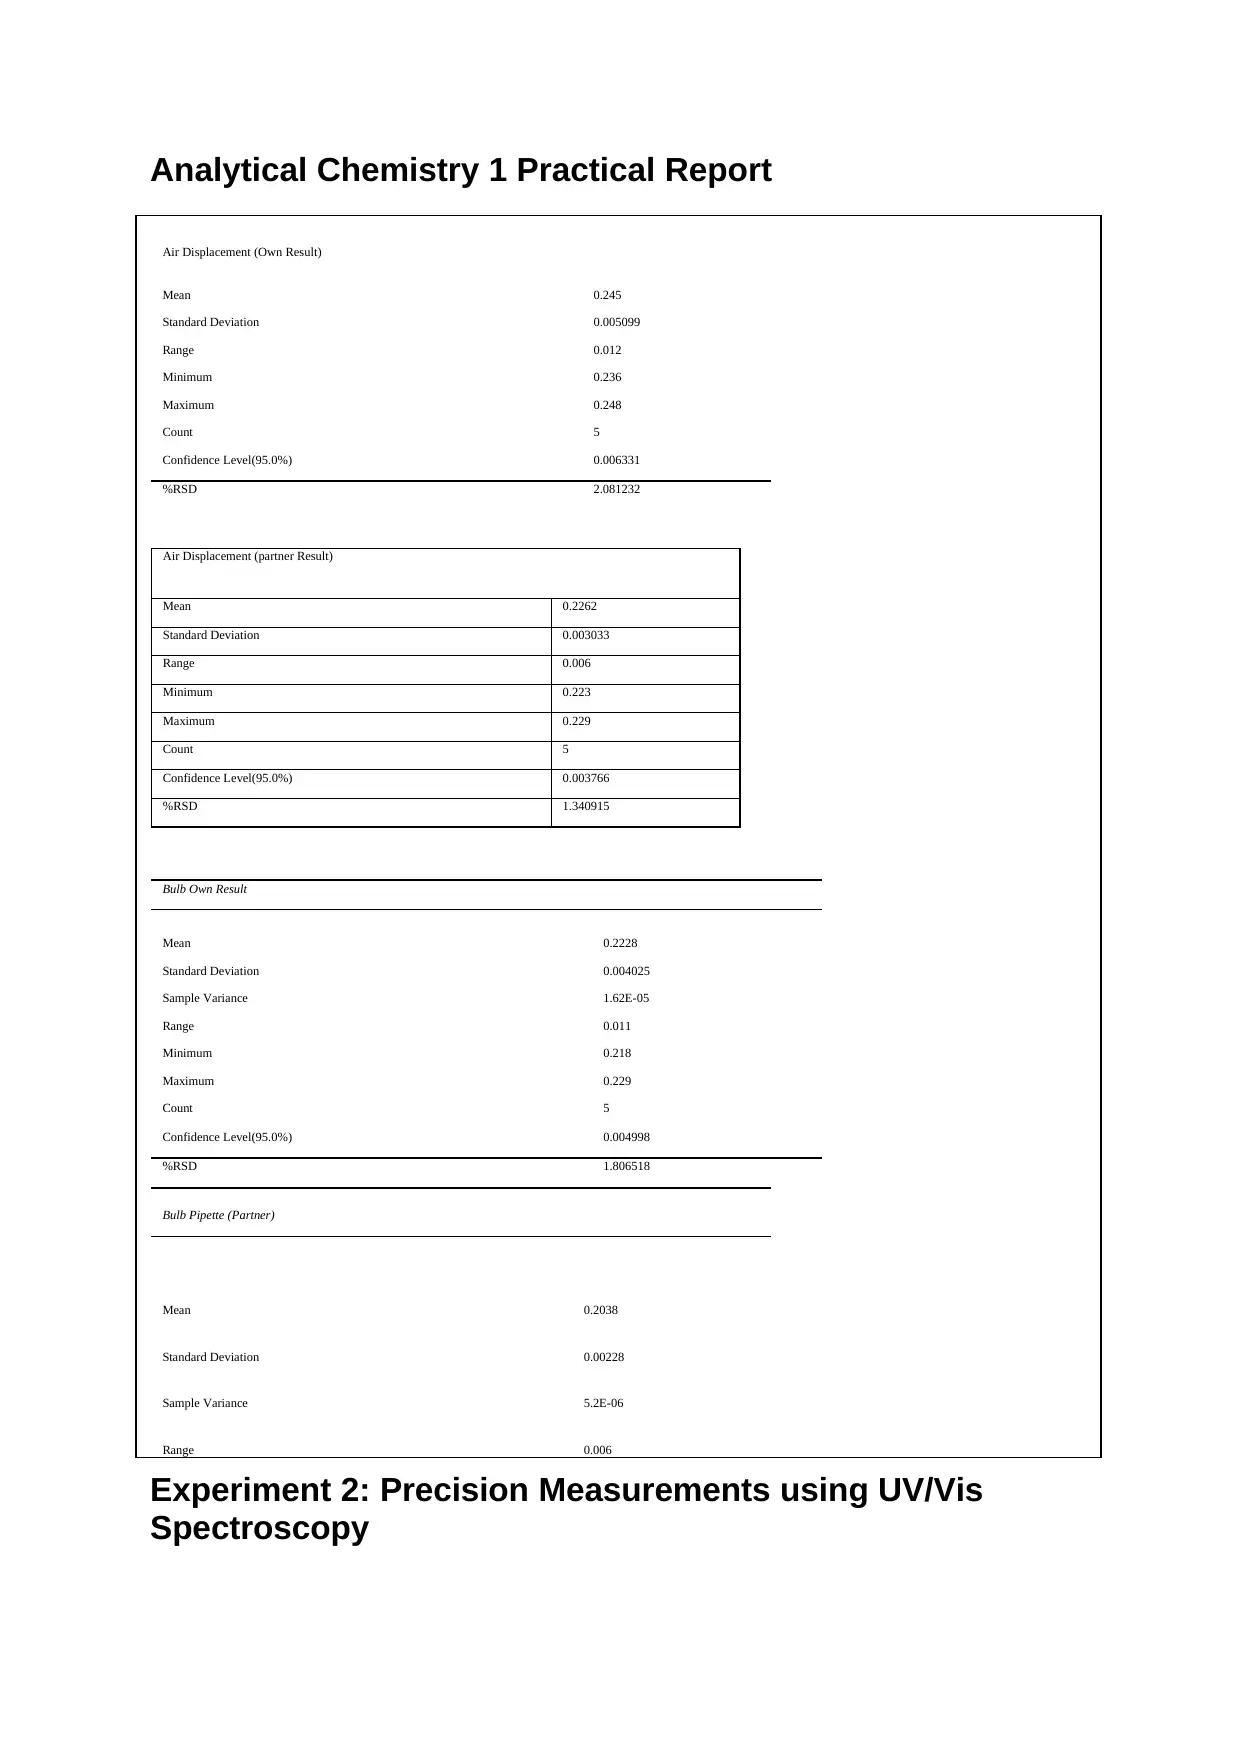
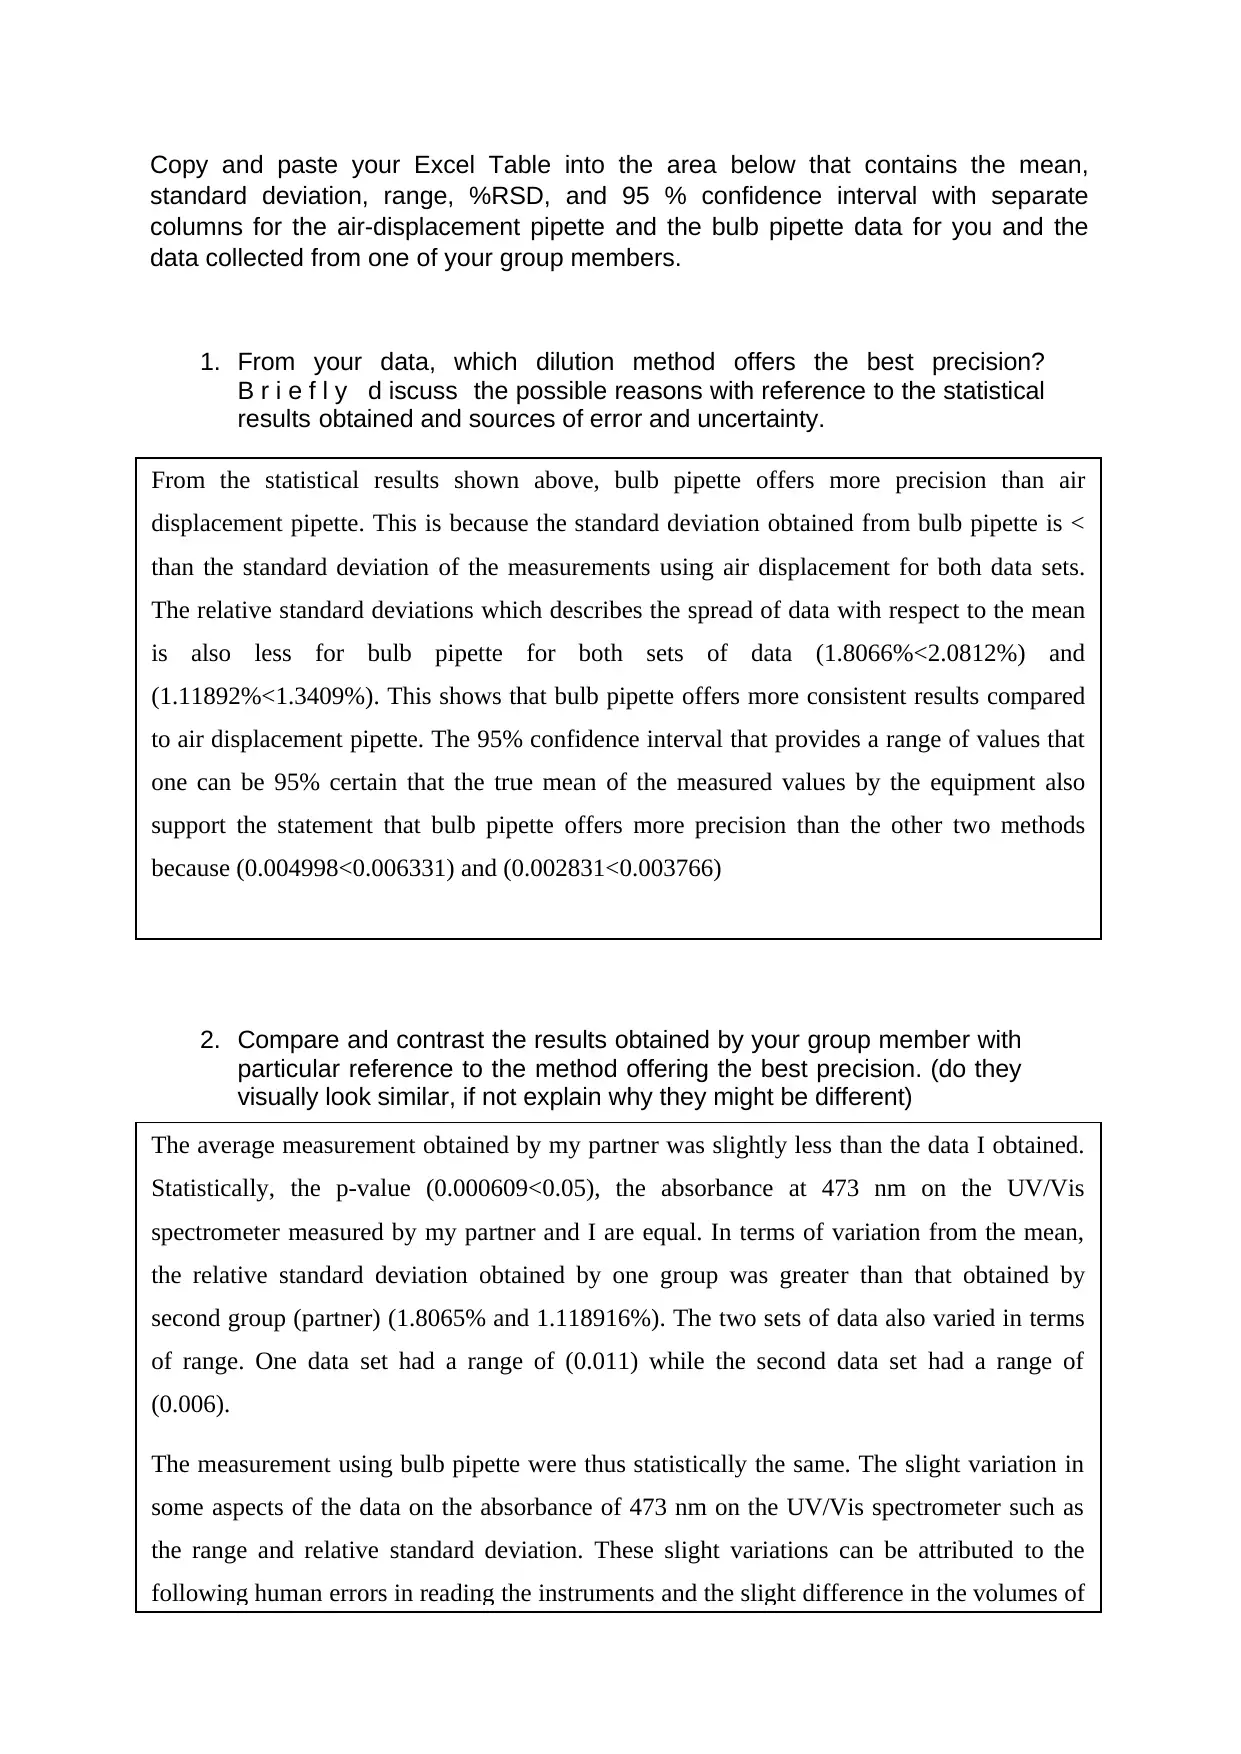
This report presents an analysis of pipetting precision in an analytical chemistry experiment. The student conducted precision measurements using air displacement and bulb pipettes, collecting data on absorbance using UV/Vis spectroscopy. Statistical analyses, including mean, standard deviation, range, %RSD, and confidence intervals, were performed to evaluate the precision of each method. The report compares the precision of the different pipetting techniques, with the bulb pipette demonstrating higher precision based on lower standard deviations and %RSD values. The student also compared their results with a partner's data, discussing similarities, differences, and potential sources of error, such as human error in reading instruments and slight volume variations. The importance of using the same pipette and glassware for repeat measurements to ensure consistency and accuracy is also highlighted. The report concludes by emphasizing the significance of statistical analysis in evaluating experimental results and identifying potential sources of error in analytical chemistry procedures.
Document Page
Analytical Chemistry 1 Practical Report
Experiment 2: Precision Measurements using UV/Vis
Spectroscopy
Air Displacement (Own Result)
Mean 0.245
Standard Deviation 0.005099
Range 0.012
Minimum 0.236
Maximum 0.248
Count 5
Confidence Level(95.0%) 0.006331
%RSD 2.081232
Air Displacement (partner Result)
Mean 0.2262
Standard Deviation 0.003033
Range 0.006
Minimum 0.223
Maximum 0.229
Count 5
Confidence Level(95.0%) 0.003766
%RSD 1.340915
Bulb Own Result
Mean 0.2228
Standard Deviation 0.004025
Sample Variance 1.62E-05
Range 0.011
Minimum 0.218
Maximum 0.229
Count 5
Confidence Level(95.0%) 0.004998
%RSD 1.806518
Bulb Pipette (Partner)
Mean 0.2038
Standard Deviation 0.00228
Sample Variance 5.2E-06
Range 0.006
tabler-icon-diamond-filled.svg

Paraphrase This Document

Need a fresh take? Get an instant paraphrase of this document with our AI Paraphraser
Document Page
Copy and paste your Excel Table into the area below that contains the mean,
standard deviation, range, %RSD, and 95 % confidence interval with separate
columns for the air-displacement pipette and the bulb pipette data for you and the
data collected from one of your group members.
1. From your data, which dilution method offers the best precision?
B r i e f l y d iscuss the possible reasons with reference to the statistical
results obtained and sources of error and uncertainty.
2. Compare and contrast the results obtained by your group member with
particular reference to the method offering the best precision. (do they
visually look similar, if not explain why they might be different)
From the statistical results shown above, bulb pipette offers more precision than air
displacement pipette. This is because the standard deviation obtained from bulb pipette is <
than the standard deviation of the measurements using air displacement for both data sets.
The relative standard deviations which describes the spread of data with respect to the mean
is also less for bulb pipette for both sets of data (1.8066%<2.0812%) and
(1.11892%<1.3409%). This shows that bulb pipette offers more consistent results compared
to air displacement pipette. The 95% confidence interval that provides a range of values that
one can be 95% certain that the true mean of the measured values by the equipment also
support the statement that bulb pipette offers more precision than the other two methods
because (0.004998<0.006331) and (0.002831<0.003766)
The average measurement obtained by my partner was slightly less than the data I obtained.
Statistically, the p-value (0.000609<0.05), the absorbance at 473 nm on the UV/Vis
spectrometer measured by my partner and I are equal. In terms of variation from the mean,
the relative standard deviation obtained by one group was greater than that obtained by
second group (partner) (1.8065% and 1.118916%). The two sets of data also varied in terms
of range. One data set had a range of (0.011) while the second data set had a range of
(0.006).
The measurement using bulb pipette were thus statistically the same. The slight variation in
some aspects of the data on the absorbance of 473 nm on the UV/Vis spectrometer such as
the range and relative standard deviation. These slight variations can be attributed to the
following human errors in reading the instruments and the slight difference in the volumes of
Document Page
3. Why is it important to use the same pipette and class of glassware when
completing the 5 repeat measurements for each solution?
Throughout the procedure, it is important to use the same pipette and glassware when
completing the 5 repeat measurement to improve precision and accuracy. This is because
despite similar calibration, no single set of two apparatus have the same measurements.
Using varied glassware and pipette would have led to inconsistency making comparison
implicit.
chevron_up_icon
1 out of 3
circle_padding
hide_on_mobile
zoom_out_icon
[object Object]