Bank Marketing Case Study: Data Analysis, Methods, and Algorithms

Verified

Added on  2022/11/26

|5
|1380
|165
Case Study
AI Summary
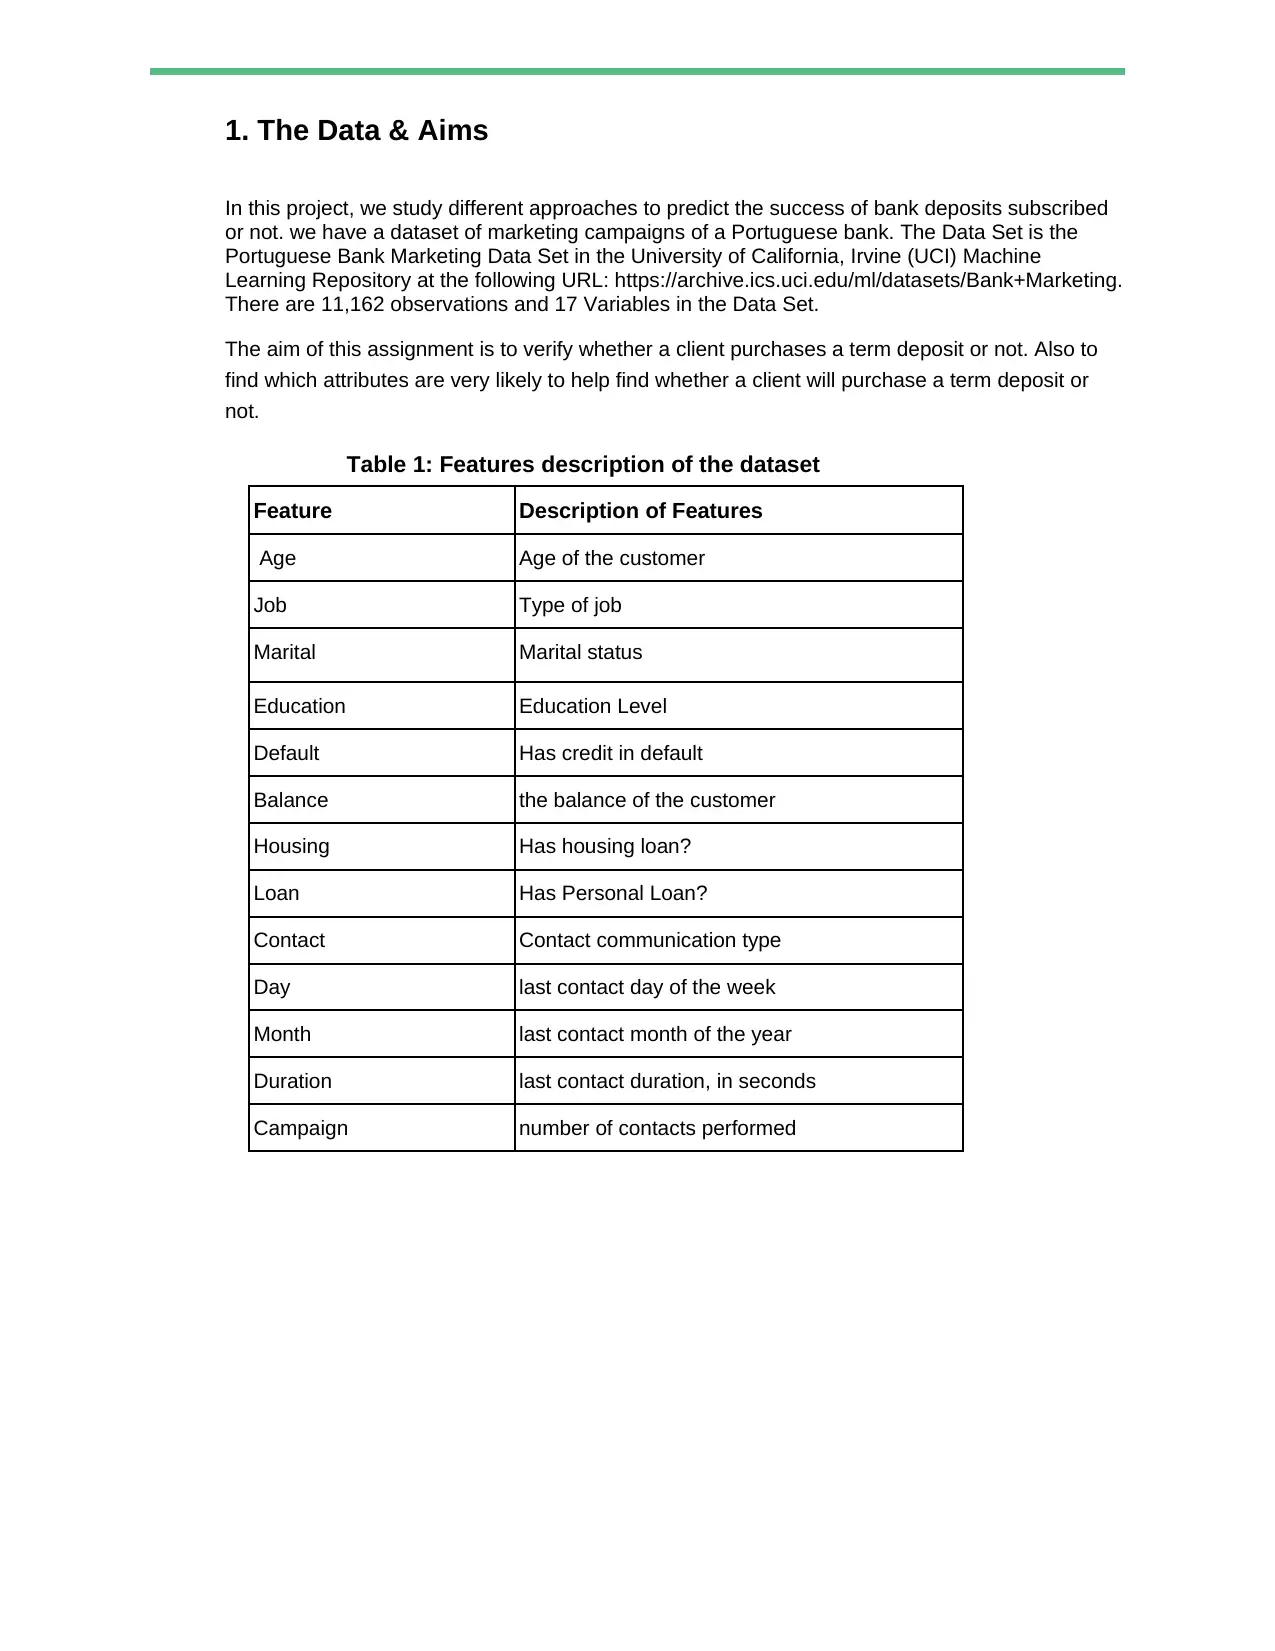
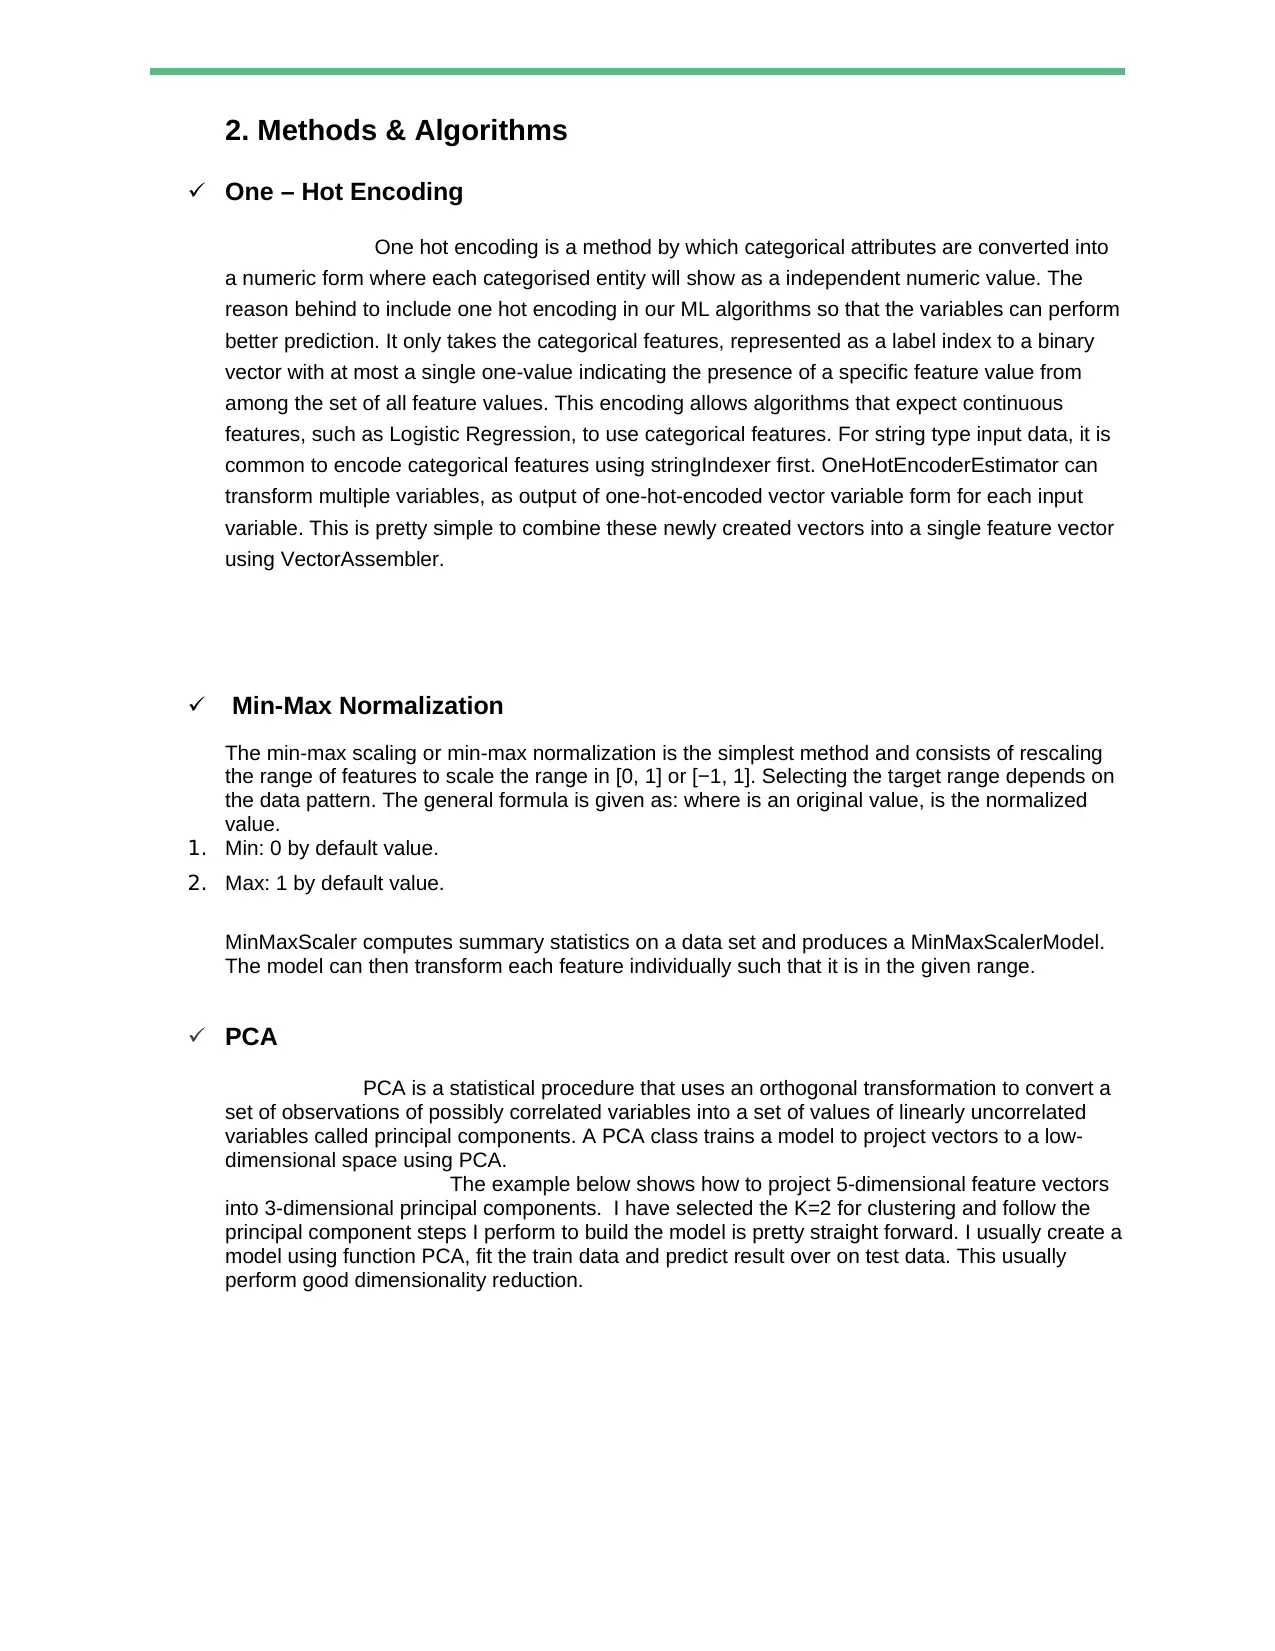
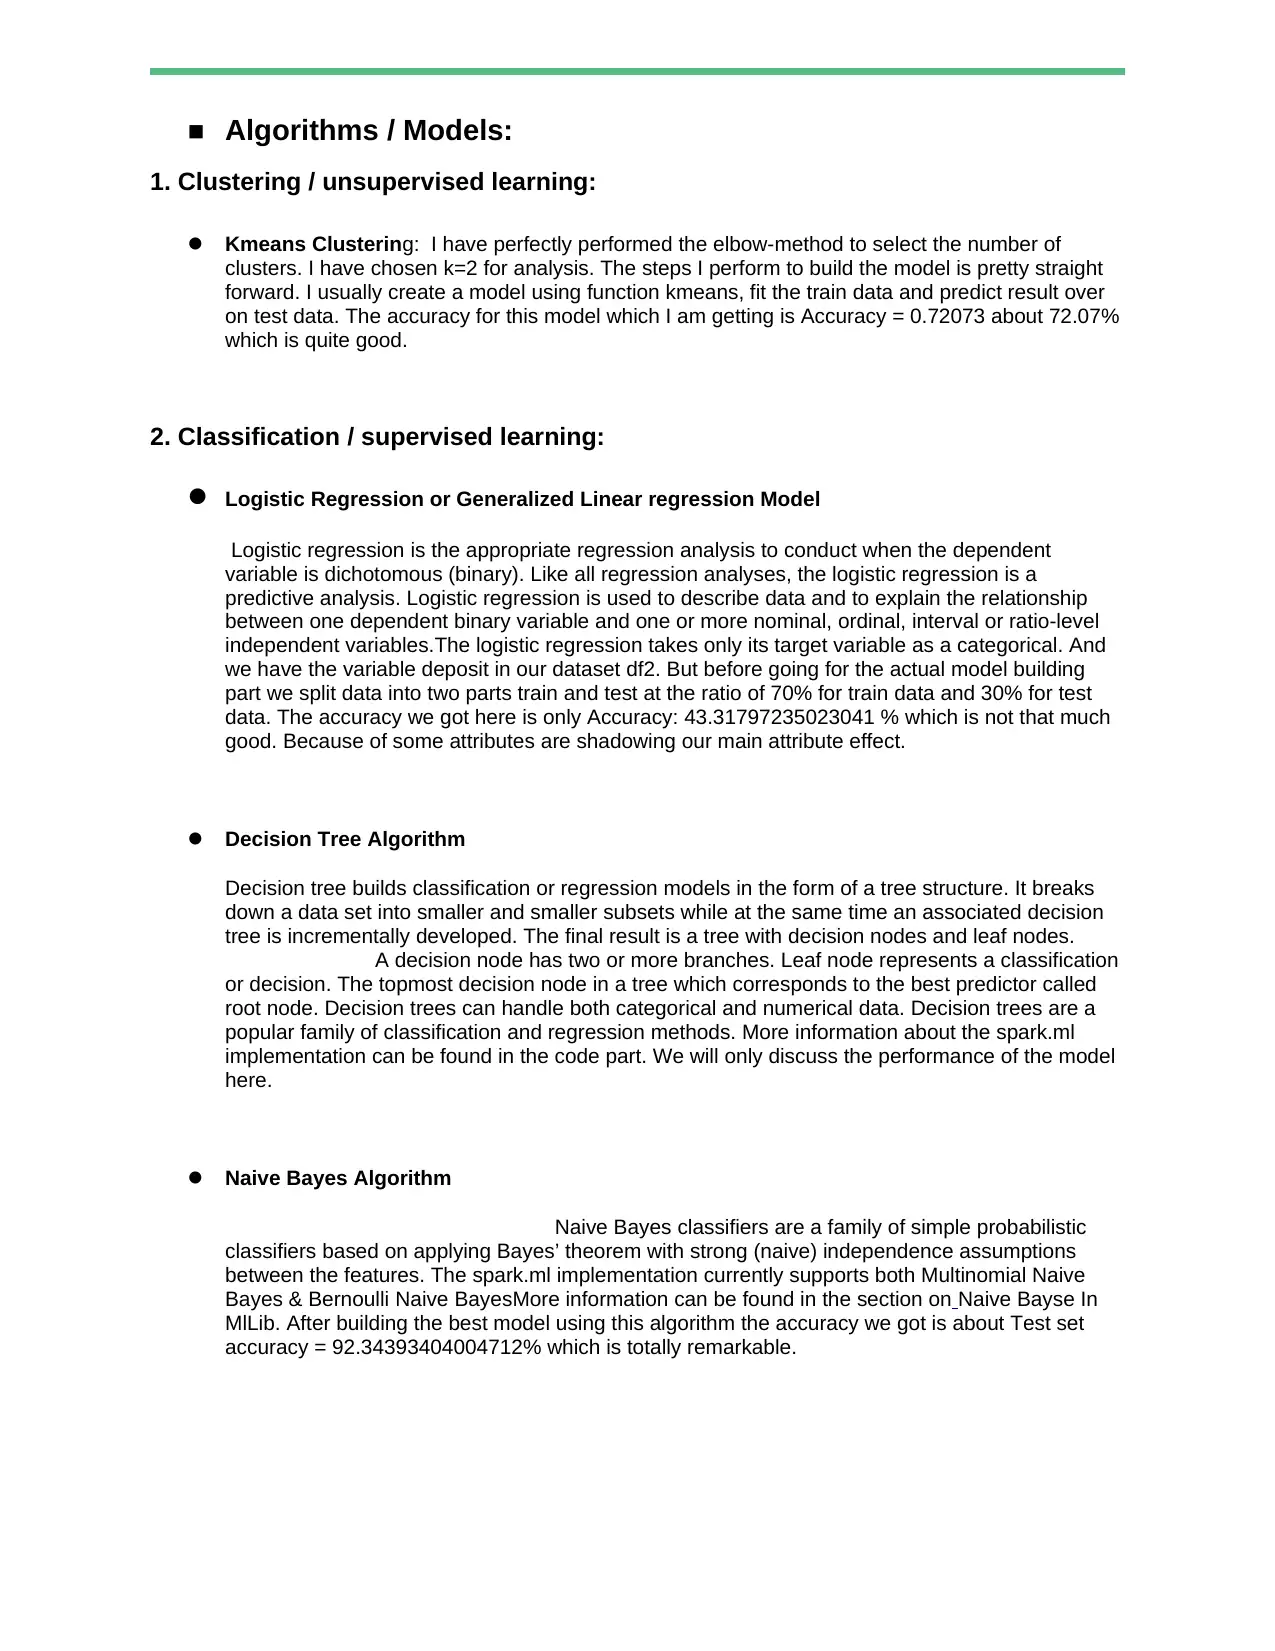
This case study analyzes a Portuguese bank's marketing campaigns to predict whether a client will subscribe to a term deposit. The study utilizes a dataset with 11,162 observations and 17 variables, employing various methods and algorithms, including one-hot encoding, min-max normalization, PCA, K-means clustering, logistic regression, decision trees, and Naive Bayes. The analysis identifies key features influencing term deposit purchases and discusses the performance of each model. The Naive Bayes algorithm achieved the highest accuracy. The study concludes by highlighting the importance of these variables for banks to target clients likely to purchase term deposits, offering insights into data analysis, machine learning, and practical applications in the banking sector.
tabler-icon-diamond-filled.svg

Contribute Materials

Your contribution can guide someone’s learning journey. Share your documents today.
Document Page
Case Study On Bank Marketing
We will certainly cover the following topics in this report part:
1. Data & Aims
2. Methods & Algorithms
3. The important features which affect the objective & Discuss the possible reasons for obtaining
analysis results and how to improve them
4. Conclusion
tabler-icon-diamond-filled.svg

Secure Best Marks with AI Grader

Need help grading? Try our AI Grader for instant feedback on your assignments.
Document Page
1. The Data & Aims
In this project, we study different approaches to predict the success of bank deposits subscribed
or not. we have a dataset of marketing campaigns of a Portuguese bank. The Data Set is the
Portuguese Bank Marketing Data Set in the University of California, Irvine (UCI) Machine
Learning Repository at the following URL: https://archive.ics.uci.edu/ml/datasets/Bank+Marketing.
There are 11,162 observations and 17 Variables in the Data Set.
The aim of this assignment is to verify whether a client purchases a term deposit or not. Also to
find which attributes are very likely to help find whether a client will purchase a term deposit or
not.
Table 1: Features description of the dataset
Feature Description of Features
Age Age of the customer
Job Type of job
Marital Marital status
Education Education Level
Default Has credit in default
Balance the balance of the customer
Housing Has housing loan?
Loan Has Personal Loan?
Contact Contact communication type
Day last contact day of the week
Month last contact month of the year
Duration last contact duration, in seconds
Campaign number of contacts performed
Document Page
2. Methods & Algorithms
One – Hot Encoding
One hot encoding is a method by which categorical attributes are converted into
a numeric form where each categorised entity will show as a independent numeric value. The
reason behind to include one hot encoding in our ML algorithms so that the variables can perform
better prediction. It only takes the categorical features, represented as a label index to a binary
vector with at most a single one-value indicating the presence of a specific feature value from
among the set of all feature values. This encoding allows algorithms that expect continuous
features, such as Logistic Regression, to use categorical features. For string type input data, it is
common to encode categorical features using stringIndexer first. OneHotEncoderEstimator can
transform multiple variables, as output of one-hot-encoded vector variable form for each input
variable. This is pretty simple to combine these newly created vectors into a single feature vector
using VectorAssembler.
Min-Max Normalization
The min-max scaling or min-max normalization is the simplest method and consists of rescaling
the range of features to scale the range in [0, 1] or [−1, 1]. Selecting the target range depends on
the data pattern. The general formula is given as: where is an original value, is the normalized
value.
1. Min: 0 by default value.
2. Max: 1 by default value.
MinMaxScaler computes summary statistics on a data set and produces a MinMaxScalerModel.
The model can then transform each feature individually such that it is in the given range.
PCA
PCA is a statistical procedure that uses an orthogonal transformation to convert a
set of observations of possibly correlated variables into a set of values of linearly uncorrelated
variables called principal components. A PCA class trains a model to project vectors to a low-
dimensional space using PCA.
The example below shows how to project 5-dimensional feature vectors
into 3-dimensional principal components. I have selected the K=2 for clustering and follow the
principal component steps I perform to build the model is pretty straight forward. I usually create a
model using function PCA, fit the train data and predict result over on test data. This usually
perform good dimensionality reduction.
Document Page
Algorithms / Models:
1. Clustering / unsupervised learning:
Kmeans Clustering: I have perfectly performed the elbow-method to select the number of
clusters. I have chosen k=2 for analysis. The steps I perform to build the model is pretty straight
forward. I usually create a model using function kmeans, fit the train data and predict result over
on test data. The accuracy for this model which I am getting is Accuracy = 0.72073 about 72.07%
which is quite good.
2. Classification / supervised learning:
Logistic Regression or Generalized Linear regression Model
Logistic regression is the appropriate regression analysis to conduct when the dependent
variable is dichotomous (binary). Like all regression analyses, the logistic regression is a
predictive analysis. Logistic regression is used to describe data and to explain the relationship
between one dependent binary variable and one or more nominal, ordinal, interval or ratio-level
independent variables.The logistic regression takes only its target variable as a categorical. And
we have the variable deposit in our dataset df2. But before going for the actual model building
part we split data into two parts train and test at the ratio of 70% for train data and 30% for test
data. The accuracy we got here is only Accuracy: 43.31797235023041 % which is not that much
good. Because of some attributes are shadowing our main attribute effect.
Decision Tree Algorithm
Decision tree builds classification or regression models in the form of a tree structure. It breaks
down a data set into smaller and smaller subsets while at the same time an associated decision
tree is incrementally developed. The final result is a tree with decision nodes and leaf nodes.
A decision node has two or more branches. Leaf node represents a classification
or decision. The topmost decision node in a tree which corresponds to the best predictor called
root node. Decision trees can handle both categorical and numerical data. Decision trees are a
popular family of classification and regression methods. More information about the spark.ml
implementation can be found in the code part. We will only discuss the performance of the model
here.
Naive Bayes Algorithm
Naive Bayes classifiers are a family of simple probabilistic
classifiers based on applying Bayes’ theorem with strong (naive) independence assumptions
between the features. The spark.ml implementation currently supports both Multinomial Naive
Bayes & Bernoulli Naive BayesMore information can be found in the section on Naive Bayse In
MlLib. After building the best model using this algorithm the accuracy we got is about Test set
accuracy = 92.34393404004712% which is totally remarkable.
tabler-icon-diamond-filled.svg

Secure Best Marks with AI Grader

Need help grading? Try our AI Grader for instant feedback on your assignments.
Document Page
3. The important features which affect the objective & Discuss the
possible reasons for obtaining analysis results and how to improve
them:
There are several features we needs to be consider for the analysis purpose. That actually affects the
performance of the few models. Basically, before going for any model building part, we need to apply the
feature selection methods like calculating the correlation of all variables so that we can decide the
significance of the variables, standard scalar method, Forward selection method, etc The hypothesis
testing would be the best result to solve or build any model and model selection method. The best model
performs at this level is only K-means Clustering and Naive Bayes Algorithm.
Result: To analyze the bank data to predict whether the client subscribed to a term deposit or not.
Performing numerous tasks and algorithms to understand to calculate and measure the best result and
the best model.
Conclusion :
The objective of this study was to analyze which attributes have the highest correlation
influences on to determine whether a client purchases a term deposit or not. A second aim was to
determine the levels of those variables that produce the most term deposit purchases. Through our study,
we discovered 17 variables that impact the decision of clients to purchase term deposits. So we can say
that the variables that provide the highest correlated form of success are important to a bank. A bank can
use these variables to target Clients that would most likely make term deposit purchases.
chevron_up_icon
1 out of 5
circle_padding
hide_on_mobile
zoom_out_icon
logo.png

Your All-in-One AI-Powered Toolkit for Academic Success.

Available 24*7 on WhatsApp / Email

[object Object]