Report: Predicting Share Prices of Colgate Palmolive Using Regression

Verified

Added on  2021/06/15

|13
|2122
|340
Report
AI Summary
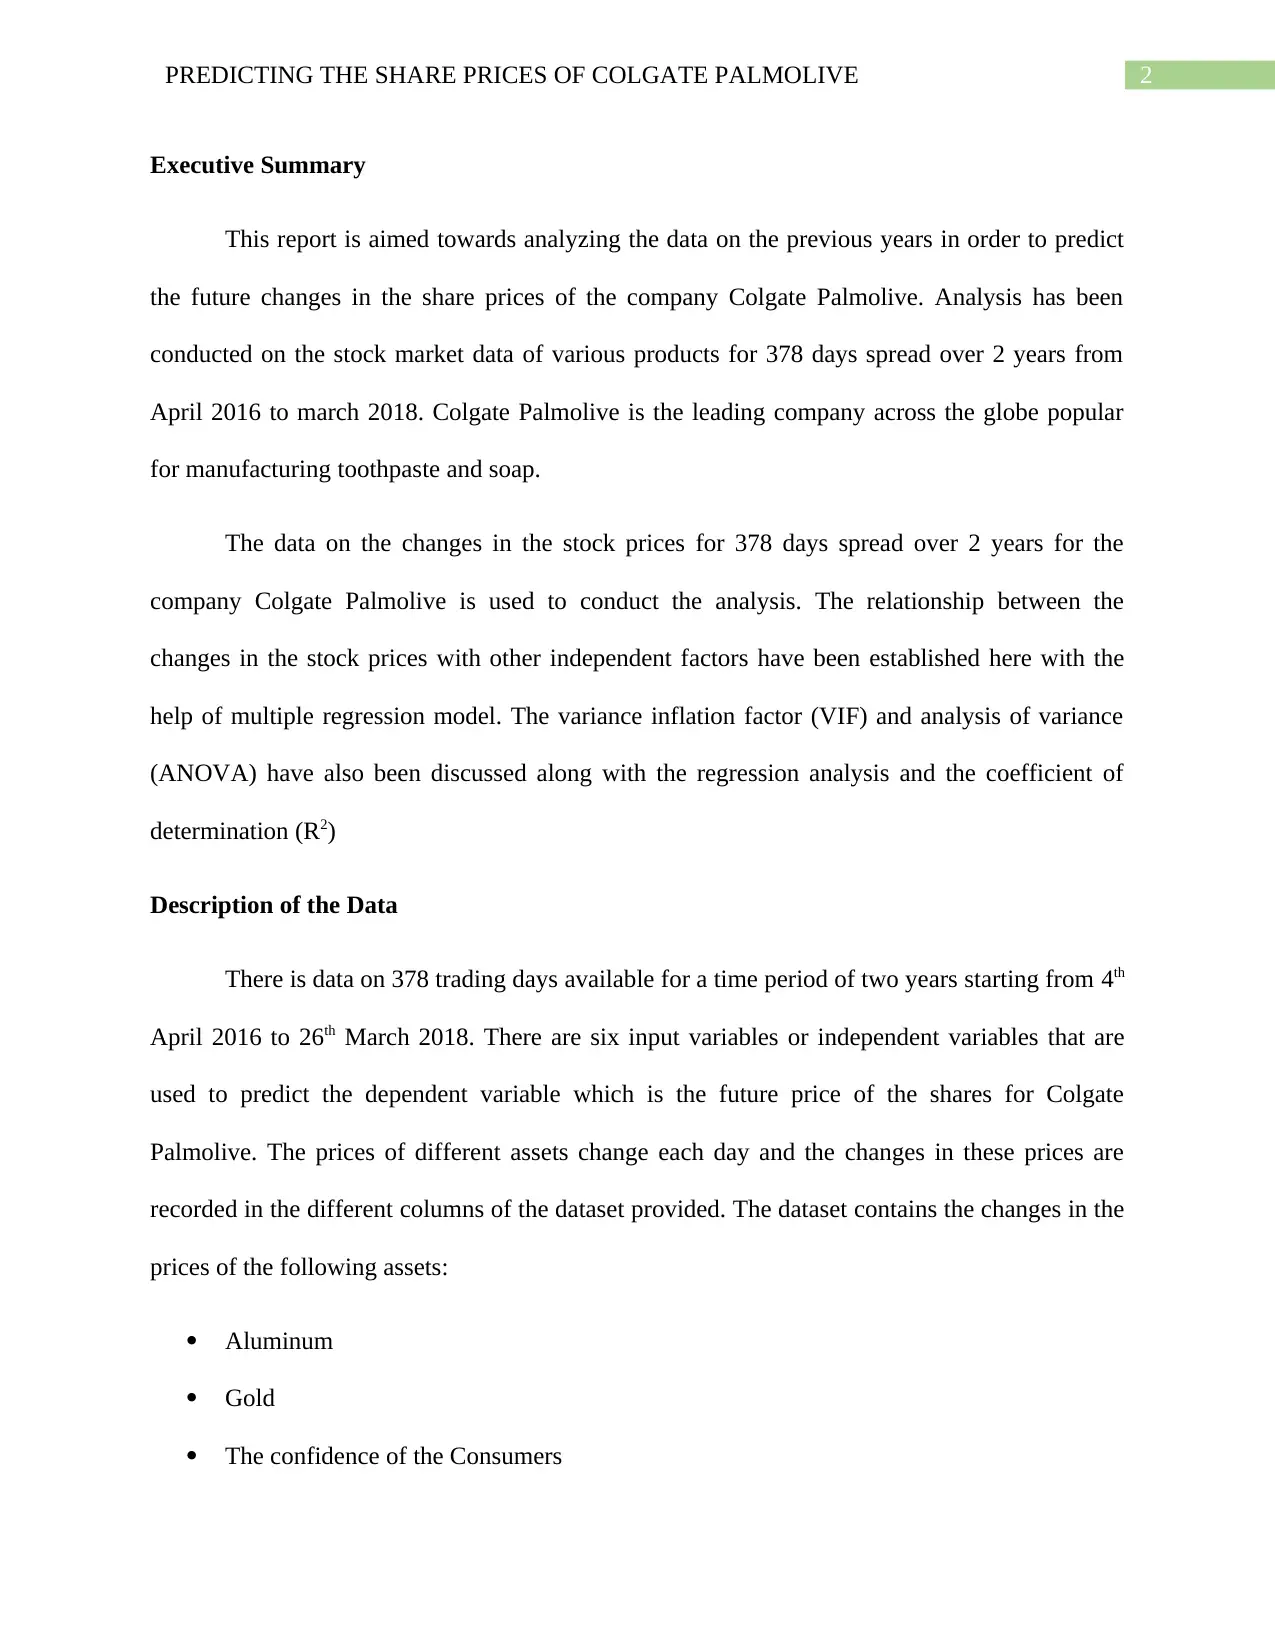
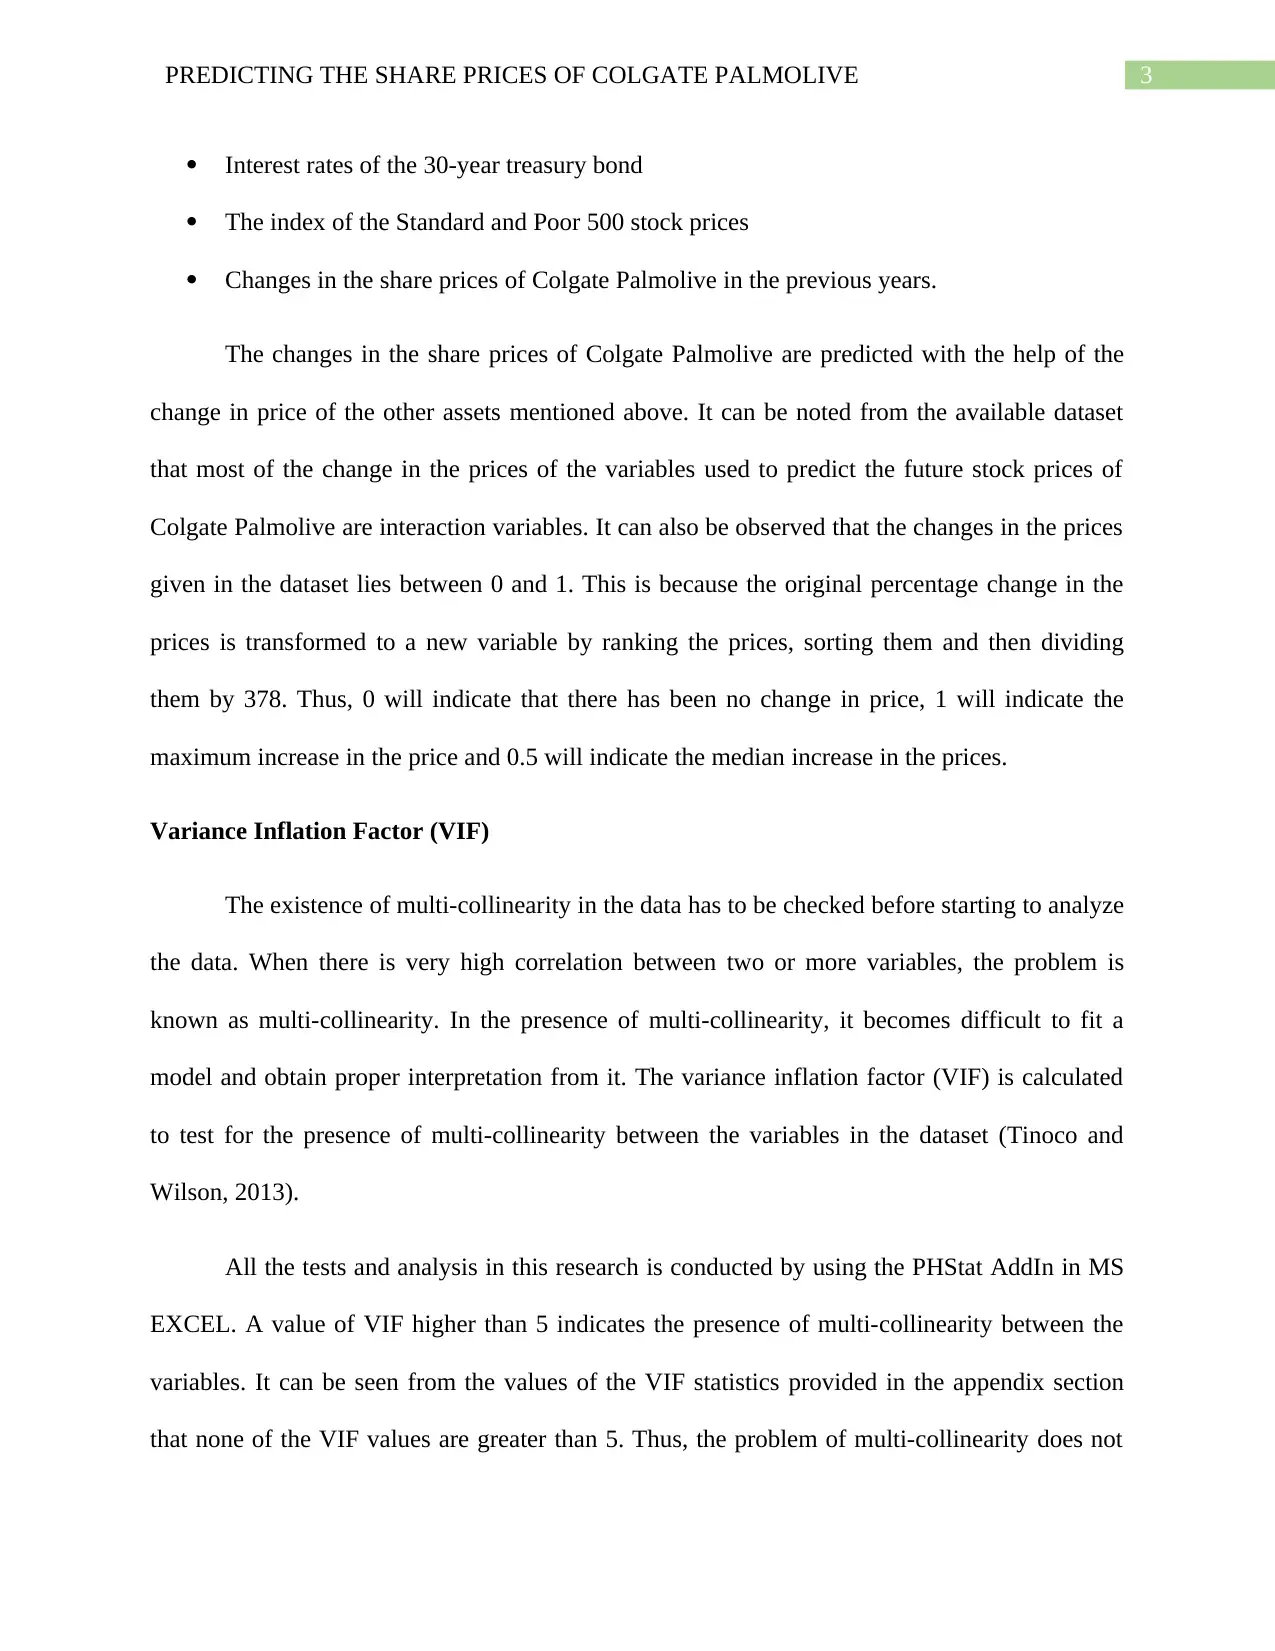
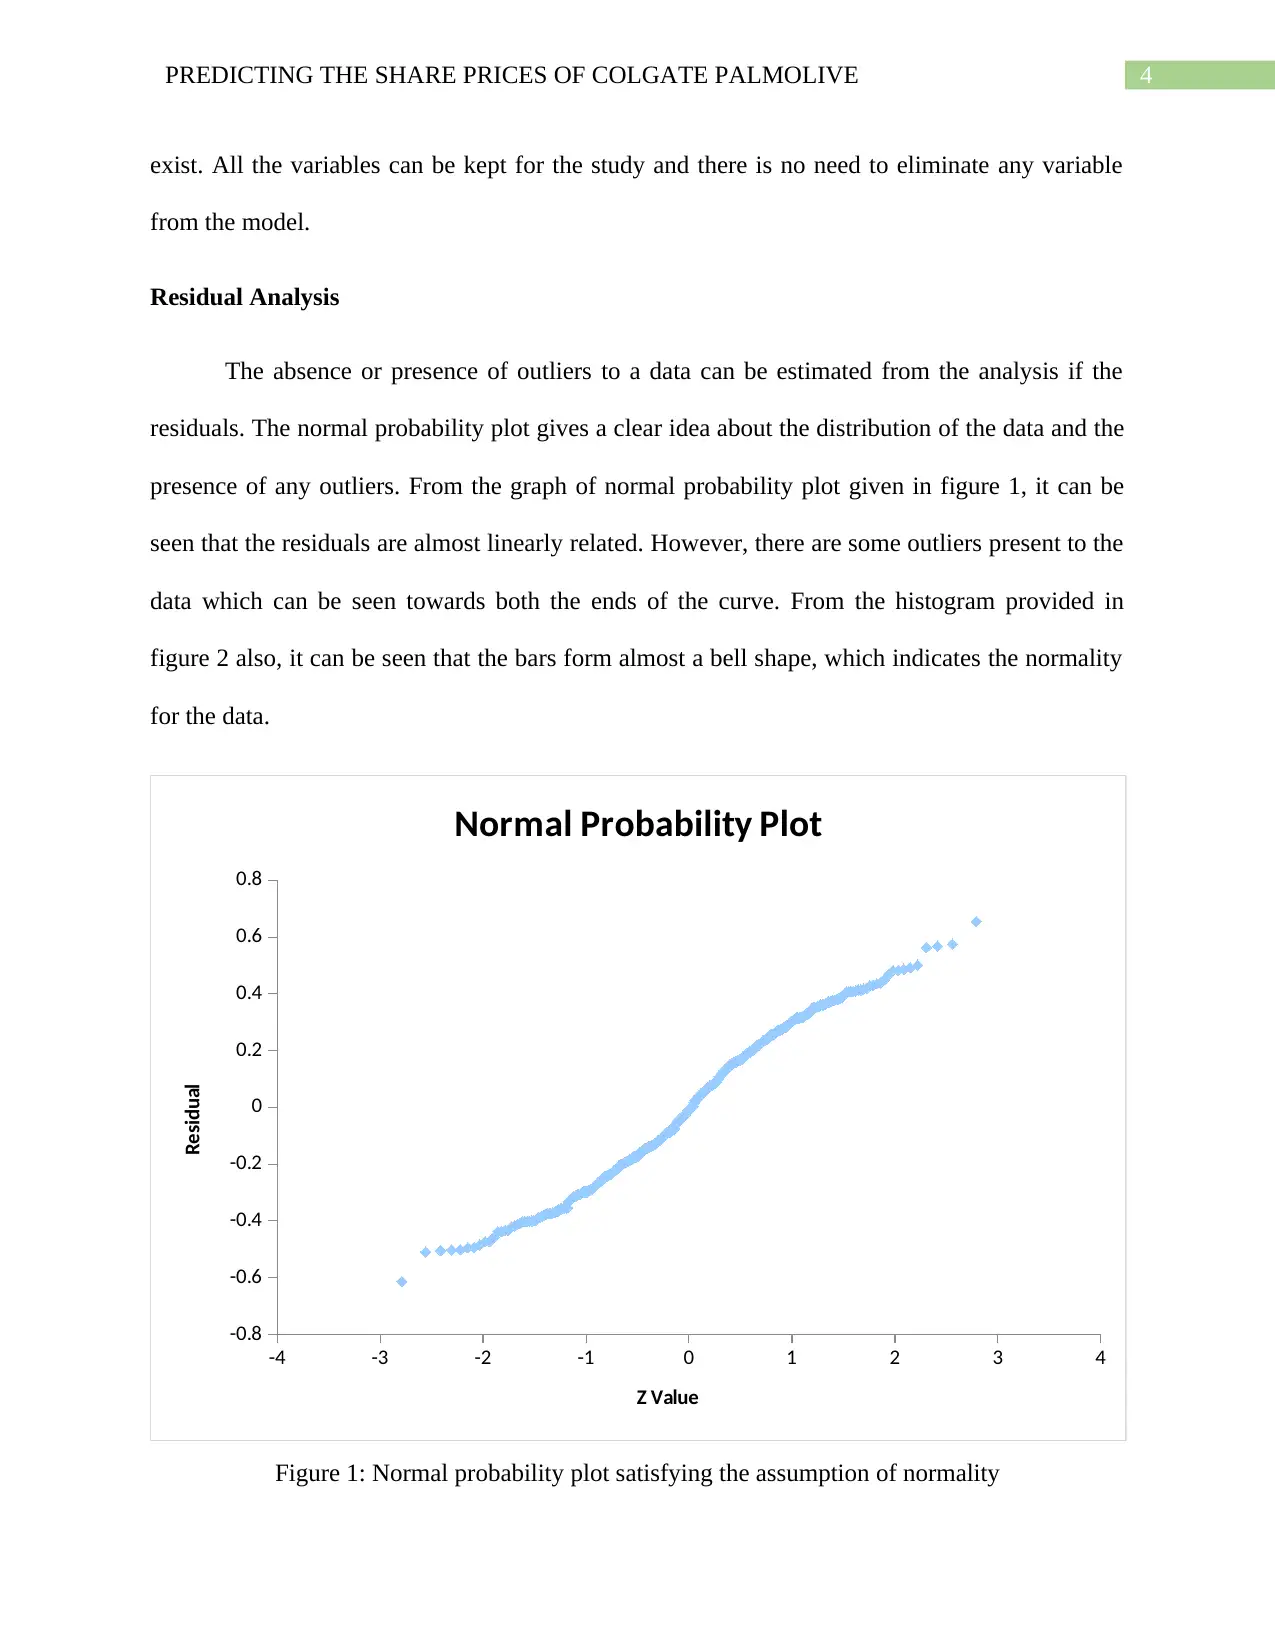
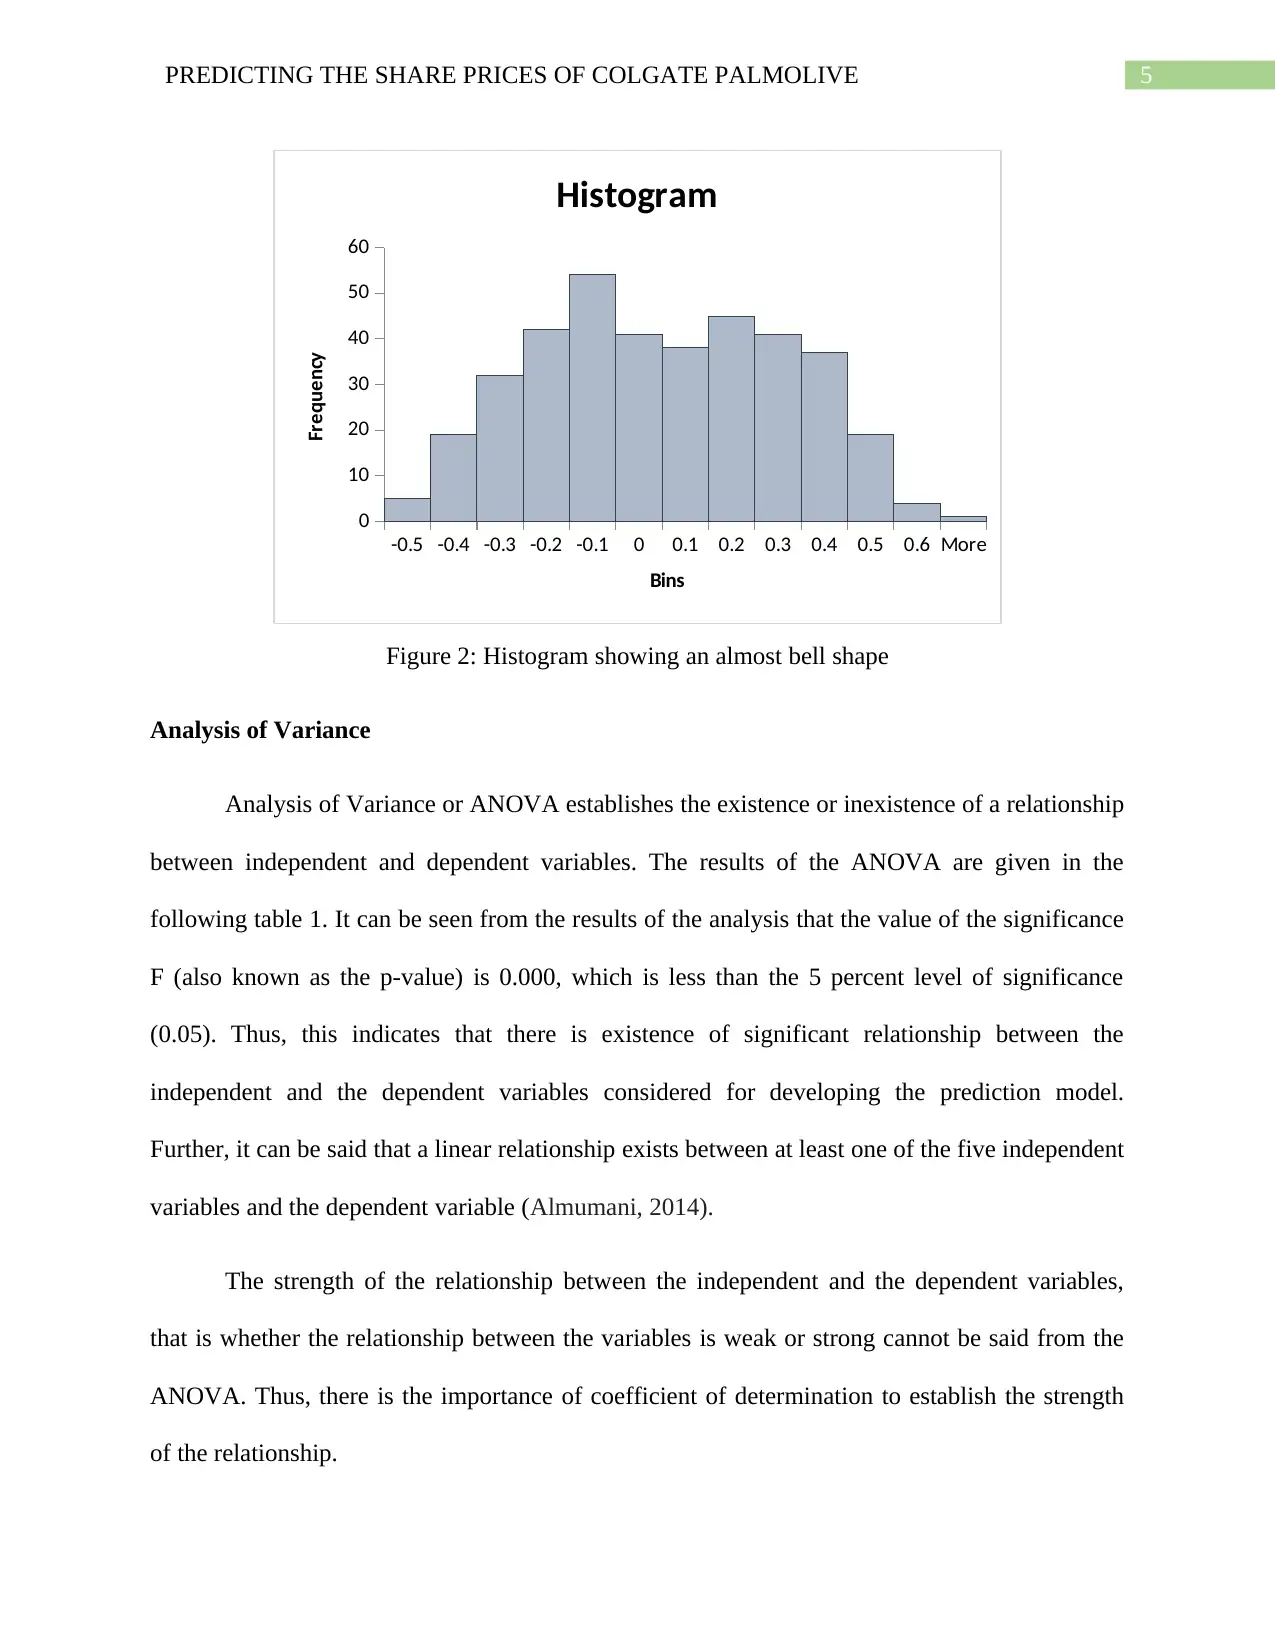
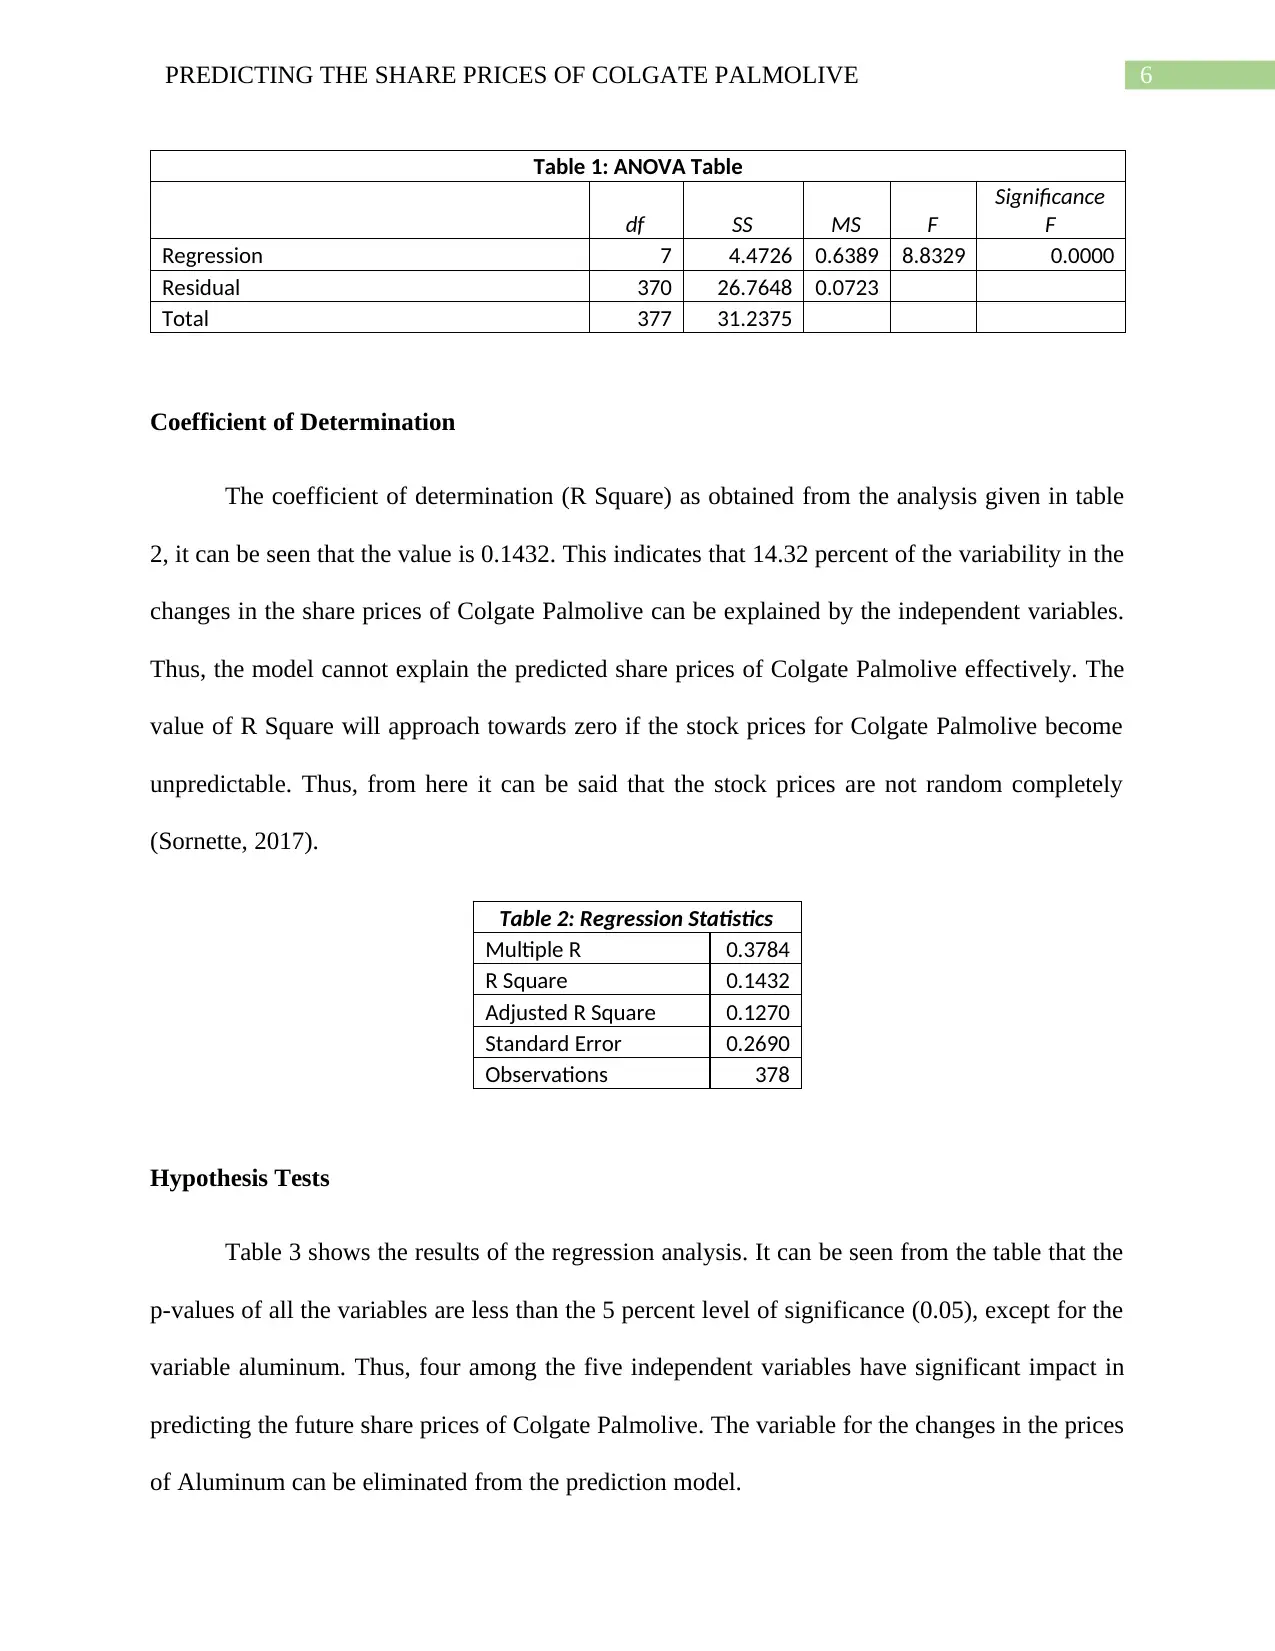
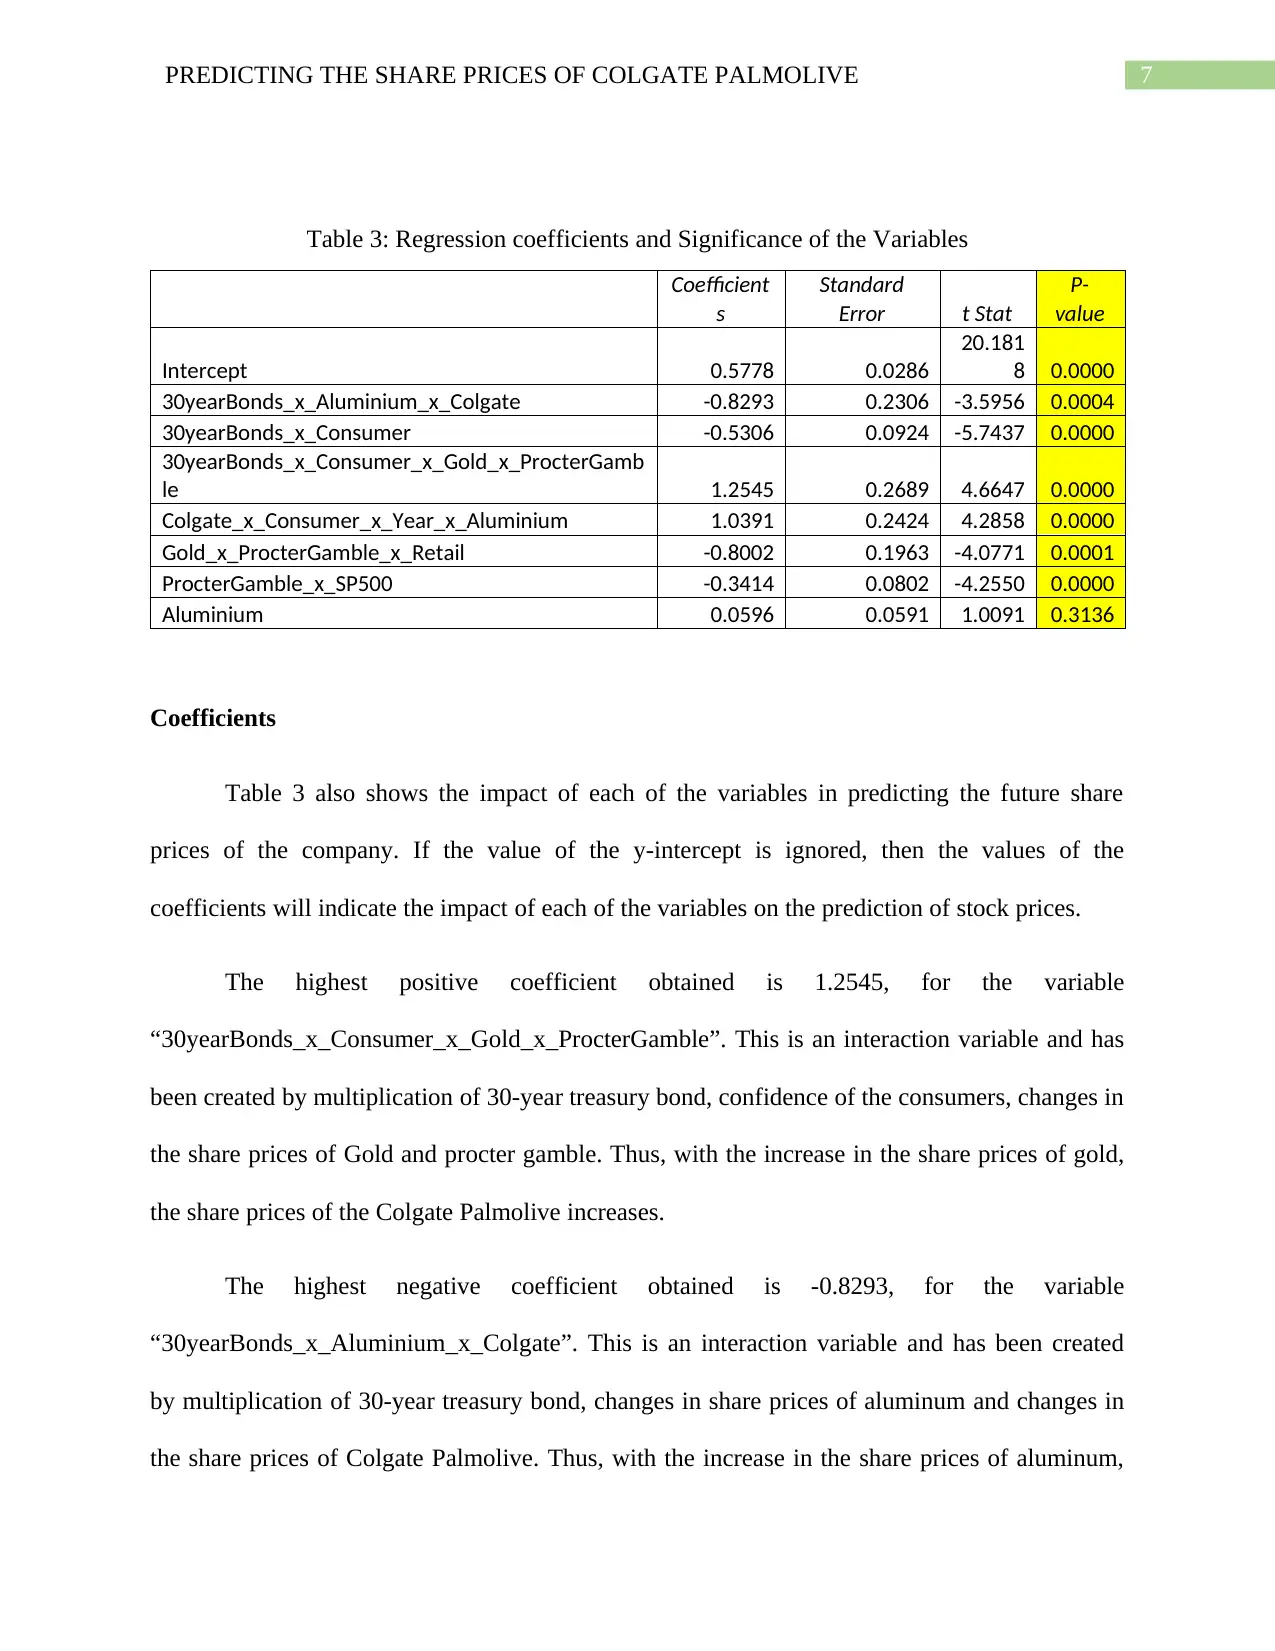
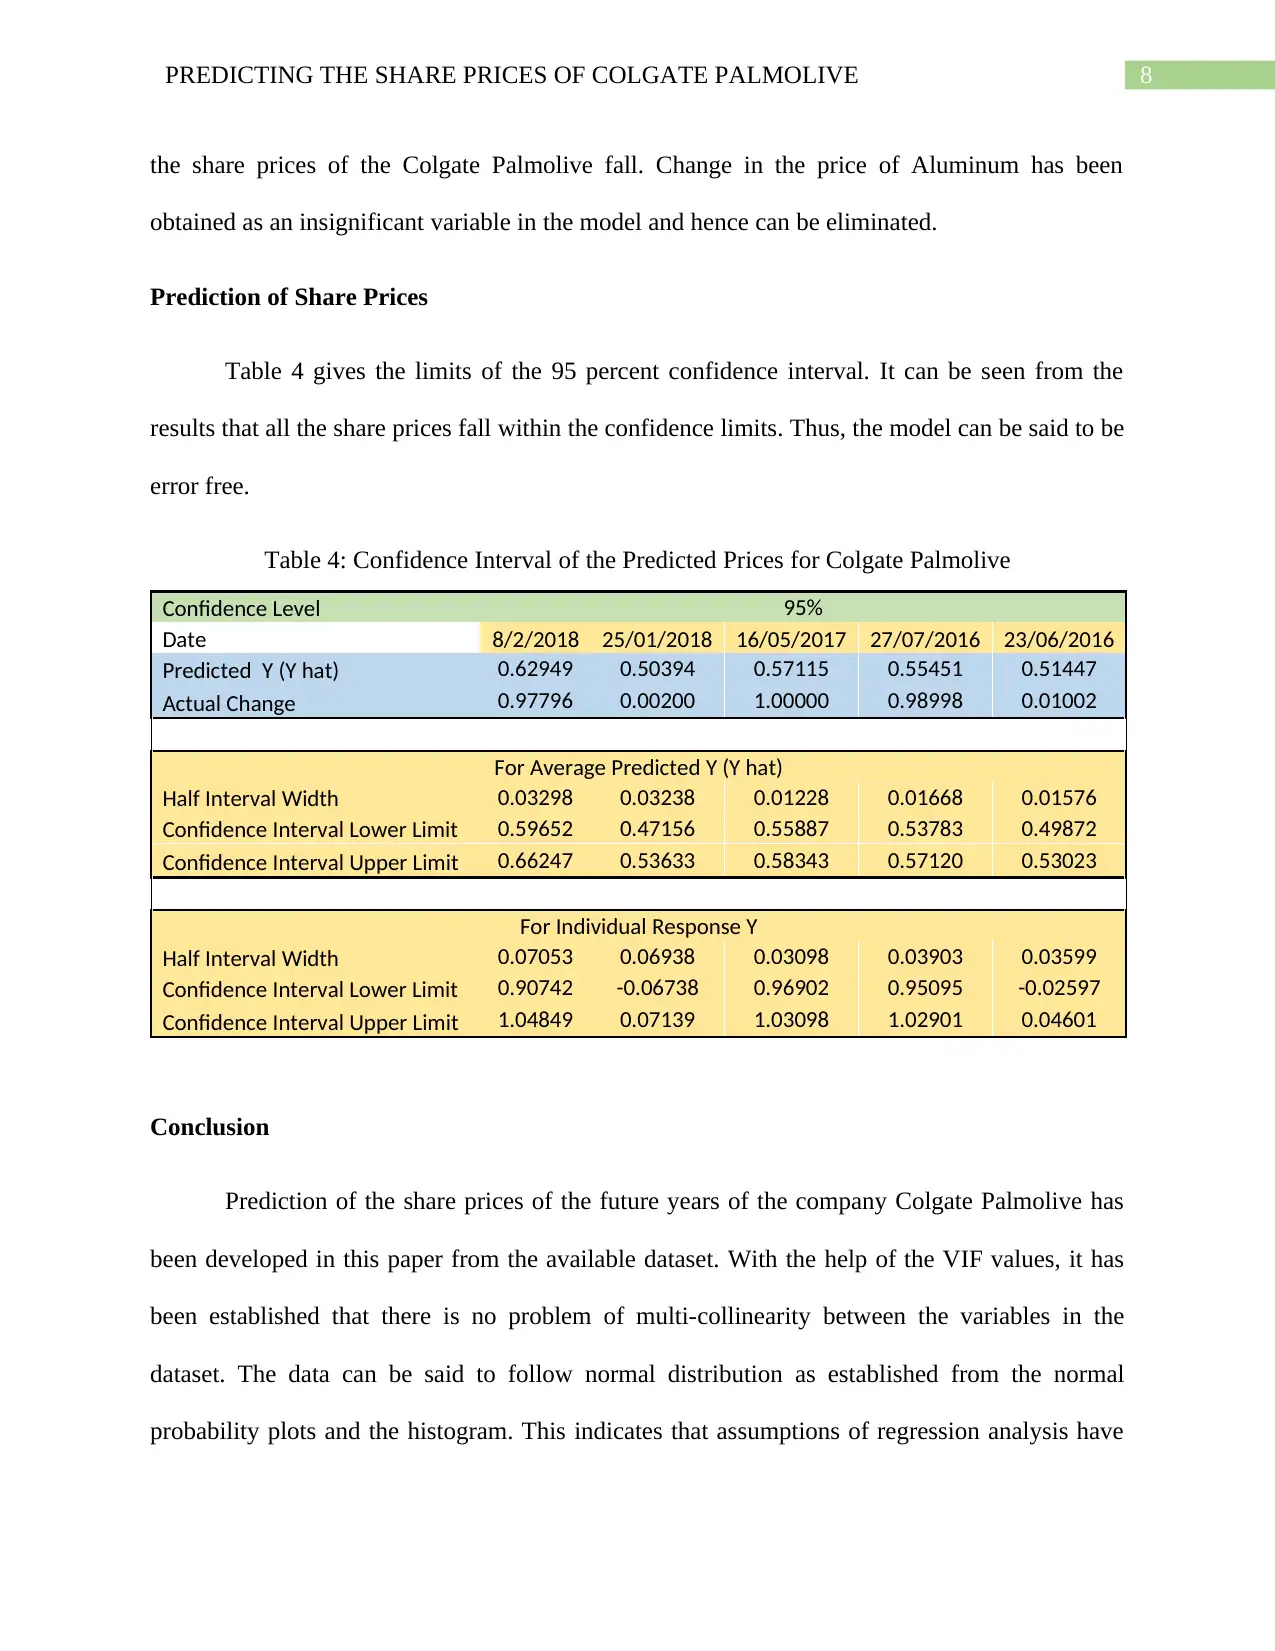
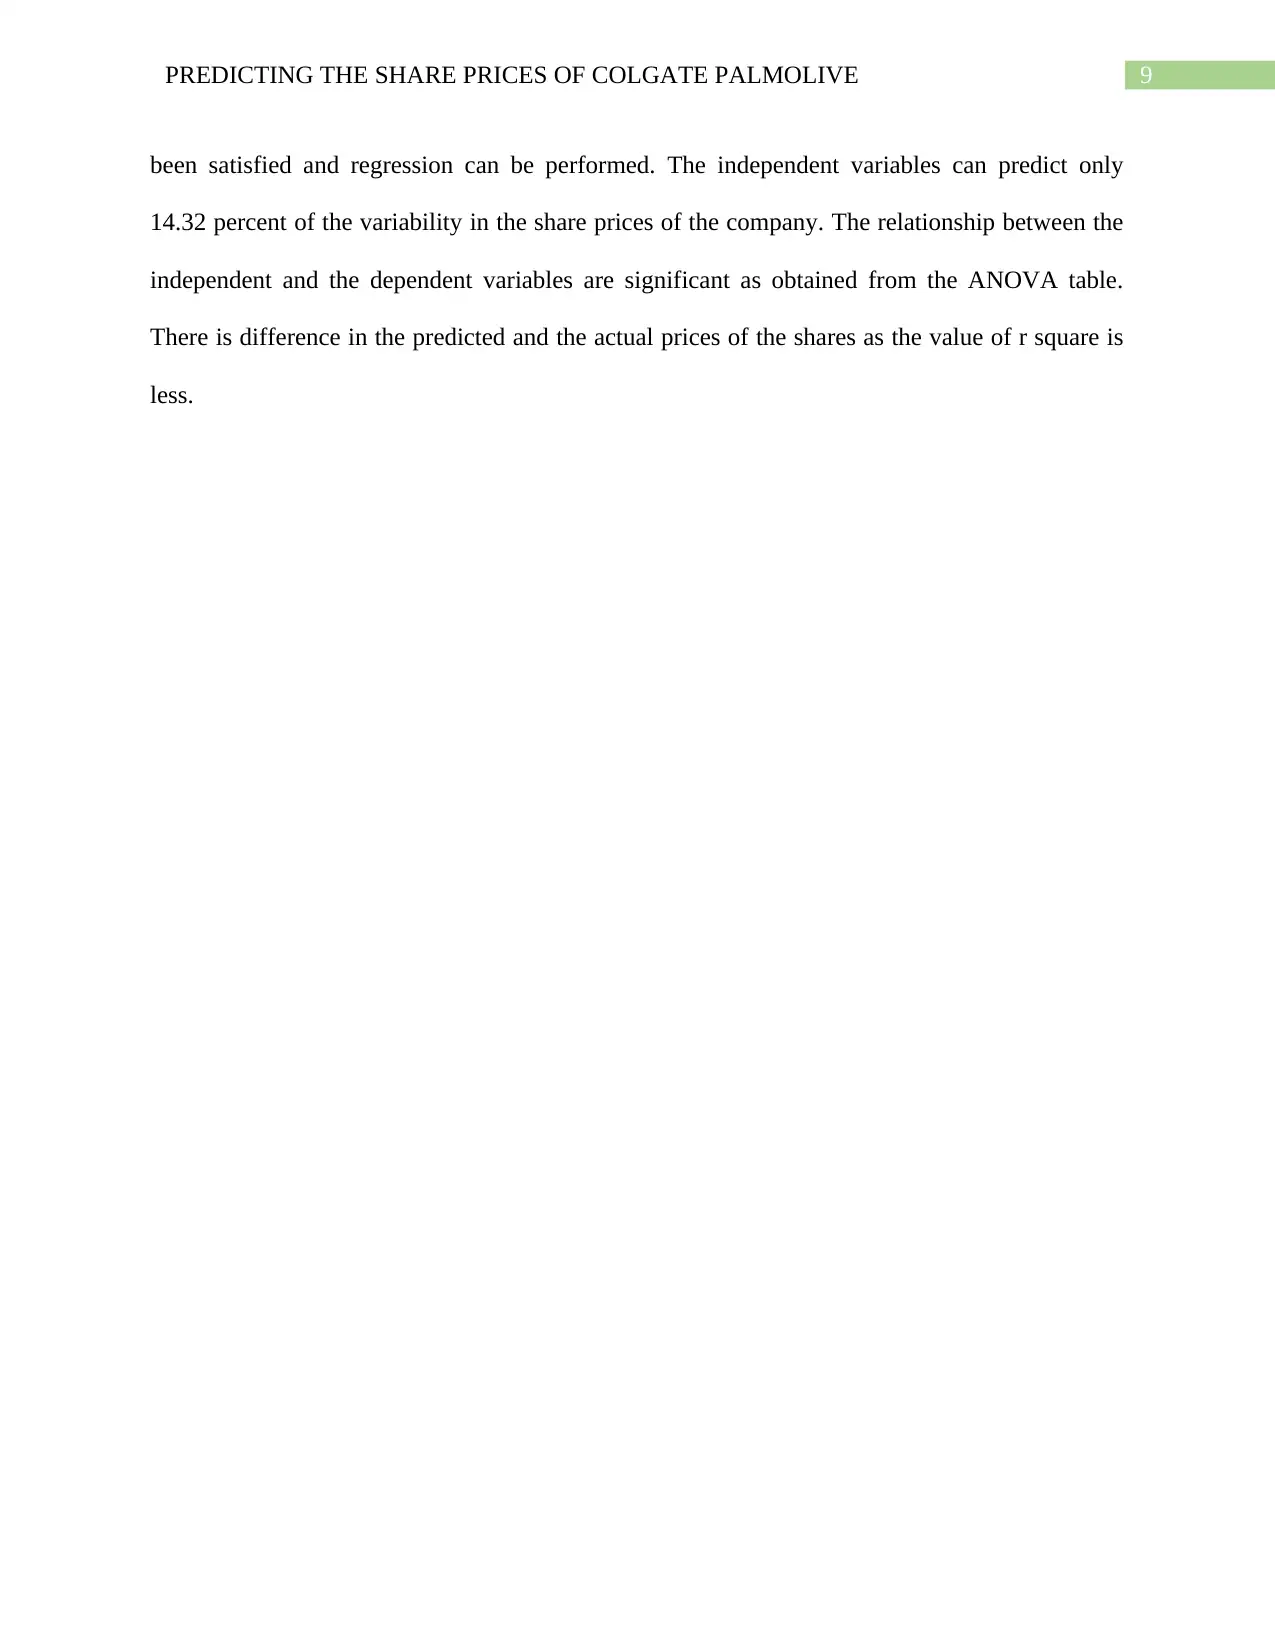
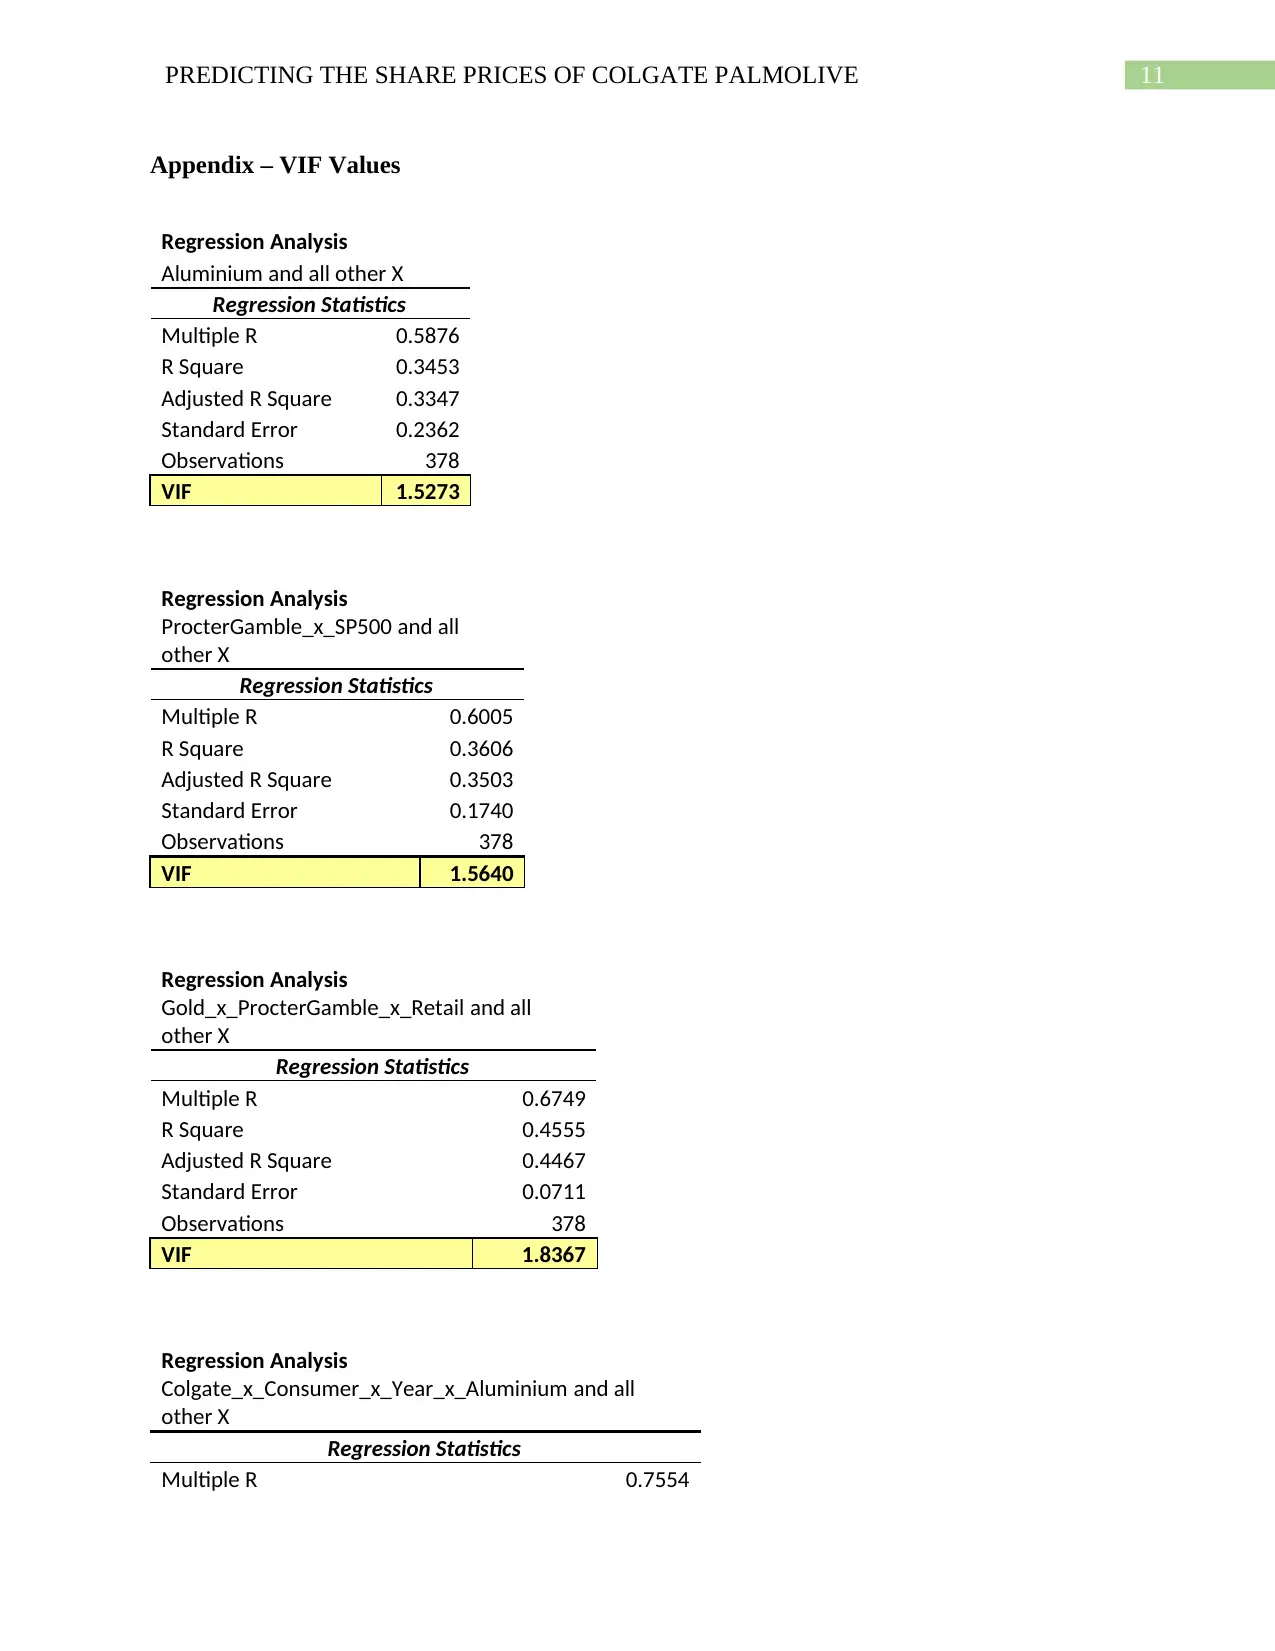
This report provides a detailed analysis aimed at predicting the future share prices of Colgate Palmolive. The analysis is conducted using stock market data from April 2016 to March 2018, encompassing 378 trading days. The study employs a multiple regression model to establish relationships between changes in share prices and various independent factors, including the prices of assets like aluminum and gold, consumer confidence, interest rates, and the S&P 500 index. The report assesses the presence of multicollinearity using the Variance Inflation Factor (VIF) and evaluates the significance of the independent variables through Analysis of Variance (ANOVA). It also discusses the coefficient of determination (R-squared) to gauge the model's explanatory power. The findings suggest that the model can explain 14.32 percent of the variability in Colgate Palmolive's share prices. The study also includes a residual analysis and hypothesis tests to validate the model's assumptions and identify significant variables, with the aluminum variable being found insignificant. The predicted share prices fall within the confidence limits. The report concludes that the model offers some predictive capability, while acknowledging the limitations of the R-squared value.
Document Page
Running Head: PREDICTING THE SHARE PRICES OF COLGATE PALMOLIVE
Predicting the Share Prices of Colgate Palmolive
Name of the Student
Name of the University
Author Note
tabler-icon-diamond-filled.svg

Paraphrase This Document

Need a fresh take? Get an instant paraphrase of this document with our AI Paraphraser
Document Page
1PREDICTING THE SHARE PRICES OF COLGATE PALMOLIVE
Table of Contents
Executive Summary.........................................................................................................................2
Description of the Data....................................................................................................................2
Variance Inflation Factor (VIF).......................................................................................................3
Residual Analysis............................................................................................................................4
Analysis of Variance........................................................................................................................5
Coefficient of Determination...........................................................................................................6
Hypothesis Tests..............................................................................................................................6
Coefficients......................................................................................................................................7
Prediction of Share Prices................................................................................................................8
Conclusion.......................................................................................................................................8
Appendix – VIF Values.................................................................................................................10
Document Page
2PREDICTING THE SHARE PRICES OF COLGATE PALMOLIVE
Executive Summary
This report is aimed towards analyzing the data on the previous years in order to predict
the future changes in the share prices of the company Colgate Palmolive. Analysis has been
conducted on the stock market data of various products for 378 days spread over 2 years from
April 2016 to march 2018. Colgate Palmolive is the leading company across the globe popular
for manufacturing toothpaste and soap.
The data on the changes in the stock prices for 378 days spread over 2 years for the
company Colgate Palmolive is used to conduct the analysis. The relationship between the
changes in the stock prices with other independent factors have been established here with the
help of multiple regression model. The variance inflation factor (VIF) and analysis of variance
(ANOVA) have also been discussed along with the regression analysis and the coefficient of
determination (R2)
Description of the Data
There is data on 378 trading days available for a time period of two years starting from 4th
April 2016 to 26th March 2018. There are six input variables or independent variables that are
used to predict the dependent variable which is the future price of the shares for Colgate
Palmolive. The prices of different assets change each day and the changes in these prices are
recorded in the different columns of the dataset provided. The dataset contains the changes in the
prices of the following assets:
Aluminum
Gold
The confidence of the Consumers
Document Page
3PREDICTING THE SHARE PRICES OF COLGATE PALMOLIVE
Interest rates of the 30-year treasury bond
The index of the Standard and Poor 500 stock prices
Changes in the share prices of Colgate Palmolive in the previous years.
The changes in the share prices of Colgate Palmolive are predicted with the help of the
change in price of the other assets mentioned above. It can be noted from the available dataset
that most of the change in the prices of the variables used to predict the future stock prices of
Colgate Palmolive are interaction variables. It can also be observed that the changes in the prices
given in the dataset lies between 0 and 1. This is because the original percentage change in the
prices is transformed to a new variable by ranking the prices, sorting them and then dividing
them by 378. Thus, 0 will indicate that there has been no change in price, 1 will indicate the
maximum increase in the price and 0.5 will indicate the median increase in the prices.
Variance Inflation Factor (VIF)
The existence of multi-collinearity in the data has to be checked before starting to analyze
the data. When there is very high correlation between two or more variables, the problem is
known as multi-collinearity. In the presence of multi-collinearity, it becomes difficult to fit a
model and obtain proper interpretation from it. The variance inflation factor (VIF) is calculated
to test for the presence of multi-collinearity between the variables in the dataset (Tinoco and
Wilson, 2013).
All the tests and analysis in this research is conducted by using the PHStat AddIn in MS
EXCEL. A value of VIF higher than 5 indicates the presence of multi-collinearity between the
variables. It can be seen from the values of the VIF statistics provided in the appendix section
that none of the VIF values are greater than 5. Thus, the problem of multi-collinearity does not
tabler-icon-diamond-filled.svg

Paraphrase This Document

Need a fresh take? Get an instant paraphrase of this document with our AI Paraphraser
Document Page
4PREDICTING THE SHARE PRICES OF COLGATE PALMOLIVE
exist. All the variables can be kept for the study and there is no need to eliminate any variable
from the model.
Residual Analysis
The absence or presence of outliers to a data can be estimated from the analysis if the
residuals. The normal probability plot gives a clear idea about the distribution of the data and the
presence of any outliers. From the graph of normal probability plot given in figure 1, it can be
seen that the residuals are almost linearly related. However, there are some outliers present to the
data which can be seen towards both the ends of the curve. From the histogram provided in
figure 2 also, it can be seen that the bars form almost a bell shape, which indicates the normality
for the data.
-4 -3 -2 -1 0 1 2 3 4
-0.8
-0.6
-0.4
-0.2
0
0.2
0.4
0.6
0.8
Normal Probability Plot
Z Value
Residual
Figure 1: Normal probability plot satisfying the assumption of normality
Document Page
5PREDICTING THE SHARE PRICES OF COLGATE PALMOLIVE
-0.5 -0.4 -0.3 -0.2 -0.1 0 0.1 0.2 0.3 0.4 0.5 0.6 More
0
10
20
30
40
50
60
Histogram
Bins
Frequency
Figure 2: Histogram showing an almost bell shape
Analysis of Variance
Analysis of Variance or ANOVA establishes the existence or inexistence of a relationship
between independent and dependent variables. The results of the ANOVA are given in the
following table 1. It can be seen from the results of the analysis that the value of the significance
F (also known as the p-value) is 0.000, which is less than the 5 percent level of significance
(0.05). Thus, this indicates that there is existence of significant relationship between the
independent and the dependent variables considered for developing the prediction model.
Further, it can be said that a linear relationship exists between at least one of the five independent
variables and the dependent variable (Almumani, 2014).
The strength of the relationship between the independent and the dependent variables,
that is whether the relationship between the variables is weak or strong cannot be said from the
ANOVA. Thus, there is the importance of coefficient of determination to establish the strength
of the relationship.
Document Page
6PREDICTING THE SHARE PRICES OF COLGATE PALMOLIVE
Table 1: ANOVA Table
df SS MS F
Significance
F
Regression 7 4.4726 0.6389 8.8329 0.0000
Residual 370 26.7648 0.0723
Total 377 31.2375
Coefficient of Determination
The coefficient of determination (R Square) as obtained from the analysis given in table
2, it can be seen that the value is 0.1432. This indicates that 14.32 percent of the variability in the
changes in the share prices of Colgate Palmolive can be explained by the independent variables.
Thus, the model cannot explain the predicted share prices of Colgate Palmolive effectively. The
value of R Square will approach towards zero if the stock prices for Colgate Palmolive become
unpredictable. Thus, from here it can be said that the stock prices are not random completely
(Sornette, 2017).
Table 2: Regression Statistics
Multiple R 0.3784
R Square 0.1432
Adjusted R Square 0.1270
Standard Error 0.2690
Observations 378
Hypothesis Tests
Table 3 shows the results of the regression analysis. It can be seen from the table that the
p-values of all the variables are less than the 5 percent level of significance (0.05), except for the
variable aluminum. Thus, four among the five independent variables have significant impact in
predicting the future share prices of Colgate Palmolive. The variable for the changes in the prices
of Aluminum can be eliminated from the prediction model.
tabler-icon-diamond-filled.svg

Paraphrase This Document

Need a fresh take? Get an instant paraphrase of this document with our AI Paraphraser
Document Page
7PREDICTING THE SHARE PRICES OF COLGATE PALMOLIVE
Table 3: Regression coefficients and Significance of the Variables
Coefficient
s
Standard
Error t Stat
P-
value
Intercept 0.5778 0.0286
20.181
8 0.0000
30yearBonds_x_Aluminium_x_Colgate -0.8293 0.2306 -3.5956 0.0004
30yearBonds_x_Consumer -0.5306 0.0924 -5.7437 0.0000
30yearBonds_x_Consumer_x_Gold_x_ProcterGamb
le 1.2545 0.2689 4.6647 0.0000
Colgate_x_Consumer_x_Year_x_Aluminium 1.0391 0.2424 4.2858 0.0000
Gold_x_ProcterGamble_x_Retail -0.8002 0.1963 -4.0771 0.0001
ProcterGamble_x_SP500 -0.3414 0.0802 -4.2550 0.0000
Aluminium 0.0596 0.0591 1.0091 0.3136
Coefficients
Table 3 also shows the impact of each of the variables in predicting the future share
prices of the company. If the value of the y-intercept is ignored, then the values of the
coefficients will indicate the impact of each of the variables on the prediction of stock prices.
The highest positive coefficient obtained is 1.2545, for the variable
“30yearBonds_x_Consumer_x_Gold_x_ProcterGamble”. This is an interaction variable and has
been created by multiplication of 30-year treasury bond, confidence of the consumers, changes in
the share prices of Gold and procter gamble. Thus, with the increase in the share prices of gold,
the share prices of the Colgate Palmolive increases.
The highest negative coefficient obtained is -0.8293, for the variable
“30yearBonds_x_Aluminium_x_Colgate”. This is an interaction variable and has been created
by multiplication of 30-year treasury bond, changes in share prices of aluminum and changes in
the share prices of Colgate Palmolive. Thus, with the increase in the share prices of aluminum,
Document Page
8PREDICTING THE SHARE PRICES OF COLGATE PALMOLIVE
the share prices of the Colgate Palmolive fall. Change in the price of Aluminum has been
obtained as an insignificant variable in the model and hence can be eliminated.
Prediction of Share Prices
Table 4 gives the limits of the 95 percent confidence interval. It can be seen from the
results that all the share prices fall within the confidence limits. Thus, the model can be said to be
error free.
Table 4: Confidence Interval of the Predicted Prices for Colgate Palmolive
Confidence Level 95%
Date 8/2/2018 25/01/2018 16/05/2017 27/07/2016 23/06/2016
Predicted Y (Y hat) 0.62949 0.50394 0.57115 0.55451 0.51447
Actual Change 0.97796 0.00200 1.00000 0.98998 0.01002
For Average Predicted Y (Y hat)
Half Interval Width 0.03298 0.03238 0.01228 0.01668 0.01576
Confidence Interval Lower Limit 0.59652 0.47156 0.55887 0.53783 0.49872
Confidence Interval Upper Limit 0.66247 0.53633 0.58343 0.57120 0.53023
For Individual Response Y
Half Interval Width 0.07053 0.06938 0.03098 0.03903 0.03599
Confidence Interval Lower Limit 0.90742 -0.06738 0.96902 0.95095 -0.02597
Confidence Interval Upper Limit 1.04849 0.07139 1.03098 1.02901 0.04601
Conclusion
Prediction of the share prices of the future years of the company Colgate Palmolive has
been developed in this paper from the available dataset. With the help of the VIF values, it has
been established that there is no problem of multi-collinearity between the variables in the
dataset. The data can be said to follow normal distribution as established from the normal
probability plots and the histogram. This indicates that assumptions of regression analysis have
Document Page
9PREDICTING THE SHARE PRICES OF COLGATE PALMOLIVE
been satisfied and regression can be performed. The independent variables can predict only
14.32 percent of the variability in the share prices of the company. The relationship between the
independent and the dependent variables are significant as obtained from the ANOVA table.
There is difference in the predicted and the actual prices of the shares as the value of r square is
less.
tabler-icon-diamond-filled.svg

Paraphrase This Document

Need a fresh take? Get an instant paraphrase of this document with our AI Paraphraser
Document Page
10PREDICTING THE SHARE PRICES OF COLGATE PALMOLIVE
Reference
Almumani, M. A. (2014). Determinants of equity share prices of the listed banks in Amman
stock exchange: Quantitative approach. International Journal of Business and Social
Science, 5(1).
Sornette, D. (2017). Why stock markets crash: critical events in complex financial systems.
Princeton University Press.
Tinoco, M. H., & Wilson, N. (2013). Financial distress and bankruptcy prediction among listed
companies using accounting, market and macroeconomic variables. International Review
of Financial Analysis, 30, 394-419.
Document Page
11PREDICTING THE SHARE PRICES OF COLGATE PALMOLIVE
Appendix – VIF Values
Regression Analysis
Aluminium and all other X
Regression Statistics
Multiple R 0.5876
R Square 0.3453
Adjusted R Square 0.3347
Standard Error 0.2362
Observations 378
VIF 1.5273
Regression Analysis
ProcterGamble_x_SP500 and all
other X
Regression Statistics
Multiple R 0.6005
R Square 0.3606
Adjusted R Square 0.3503
Standard Error 0.1740
Observations 378
VIF 1.5640
Regression Analysis
Gold_x_ProcterGamble_x_Retail and all
other X
Regression Statistics
Multiple R 0.6749
R Square 0.4555
Adjusted R Square 0.4467
Standard Error 0.0711
Observations 378
VIF 1.8367
Regression Analysis
Colgate_x_Consumer_x_Year_x_Aluminium and all
other X
Regression Statistics
Multiple R 0.7554
chevron_up_icon
1 out of 13
circle_padding
hide_on_mobile
zoom_out_icon
[object Object]