Factors Predicting Depression and Anxiety in Mental Health Nurses
VerifiedAdded on 2021/04/24
|27
|5656
|154
Homework Assignment
AI Summary
This assignment presents a comprehensive analysis of a quantitative, cross-sectional study that investigates the factors predicting depression and anxiety in mental health nurses. The assignment begins by providing a full citation for the selected peer-reviewed article and then addresses the study's purpose, theoretical framework, research questions, hypotheses (null and alternative), and definitions of dependent and independent variables. It describes the research design, sample characteristics, and statistical methods used, including the Chi-square test. The analysis also identifies key assumptions and limitations of the study. The assignment then delves into key concepts in research and statistics, including variables, measurement scales (nominal, ordinal, interval, and ratio), measures of central tendency (mean, median, mode), measures of dispersion (range, interquartile range, standard deviation, and variance), and the appropriate use of these measures based on data type. Furthermore, the assignment explores the principles of statistical inference, including sensitivity, specificity, predictive values, and efficiency, using data from a serum ferritin test to evaluate its clinical performance as a diagnostic tool. The assignment concludes with a description of the normal distribution and identifies various statistical distributions and chart types. The student demonstrates a strong understanding of research methodology, statistical analysis, and their application in healthcare settings.
P a g e | 1
Predicting Factors of Depression and
Anxiety in Mental Health Nurses: A
Quantitative Cross-Sectional Study
Student Name: Student ID:
Unit Name: Unit ID:
Date Due: Professor Name:
1
Predicting Factors of Depression and
Anxiety in Mental Health Nurses: A
Quantitative Cross-Sectional Study
Student Name: Student ID:
Unit Name: Unit ID:
Date Due: Professor Name:
1
Paraphrase This Document
Need a fresh take? Get an instant paraphrase of this document with our AI Paraphraser
P a g e | 2
Chapter 1: Using Research and Statistics in Health Care
1. Find a peer-reviewed quantitative research article and address the following:
a. Full citation for the article selected.
Gherardi-Donato, E. C. D. S., Cardoso, L., Teixeira, C. A. B., Pereira, S. D. S.,
&Reisdorfer, E. (2015). Association between depression and work stress in nursing
professionals with technical education level. Revistalatino-americana de
enfermagem, 23(4), 733-740(Gherardi-Donato 2015).
b. What is the statement of the purpose of the study?
The peer-reviewed quantitative research article analyses relationship amongst
depression with work stress in the domain of nursing profession, who possess
technical education levels. The scholars conducted in the city of state of Sao Paulo.
Approximately 310 nursing professionals were chosen in a random manner to
conduct a cross-sectional study.
c. Name the theoretical or conceptual model/framework used.
The theoretical model or conceptual framework of cross-section study was selected.
A Job Stress Scale or Working Stress Scale of model developed by Karasek was
applied in the study.
d Write out the research questions addressed by the study.
The study addressed several questions through its methods as follows;
Research Question 1: What is the complexity of work level?
Research Question 2: How much time is spent at the institute?
Research Question 3: Are work leaves easily available?
Research Question 4: What is the prevalence of chronic disease?
Research Question 5: Is smoking allowed in the institute?
e. List the main hypotheses that the study is testing (null & alternative)
The study aims at establishing null and alternate hypothesis through its methods.
Null hypothesis (H0): “Work related parameters does not impact stress levels
amongst nursing professionals”.
Alternate hypothesis for the study are;
H1: Complexity of work level affects levels of stress
H2 :Time is spend at the institute impacts stress
H 3: Work leaves availability impacts job stress
H 4: Prevalence of chronic disease affects job stress
H 5: Smoking permission in the institute affects stress
2
P a g e | 3
f. Define the dependent variable and the main independent variables.
The study was conducted by means of dependent as well as independent variables.
Dependent variables for the study were reporting depression. Independent variables
include psychological (demand), work (control) and social support.
g. Briefly describe the research design.
Research design adopted for the study was descriptive-exploratory approach. In this
approach, primary aim of the scholars is to unearth dearth of information to arrive at
conclusion related to the study. All necessary information related to the study is used
for this procedure.
h. Describe the study sample (e.g., size, socio-demographic characteristics) and
how it was obtained.
For this scope of the study a sample of 338 participants from the hospital employees
were selected. The sample included both male and female participants that worked at
the hospital as nursing technicians or nursing assistants. Age of the participants was
less than 40 years and they belonged to Brazil area.
i. List the statistics used to test the hypotheses
Chi-square test was used to test the hypothesis.
j. Identify the main assumptions and limitations.
The assumption of this study is that nursing technicians or nursing assistants carry out
high demand workloads with relatively less control over their work performance.
This is not always true as nursing professionals are not always controlled or
supervised by professional nurses.
The study suffers from certain limitations as there were transversal data collection
method adopted that might prevent establishing chronological and casual relationship
amongst variables. The study also faces limitations from memory and diagnostic
biases.
Chapter 2: Organizing, Displaying, and Describing Data
3
⊘ This is a preview!⊘
Do you want full access?
Subscribe today to unlock all pages.
Trusted by 1+ million students worldwide
P a g e | 4
1. What is a variable?
Variable is defined as a quantity whose value changes during the experiment or
investigation (MacKinnon, 2008).
2. What is an independent variable?
Independent variable is the direct outcomes of an experiment or manipulative values
of an experiment.
3. What is a dependent variable?
Dependent variables are generated by the help of independent variables. This kind of
variables is generally the effect of independent variables.
4. Define the following measurement scales and give at least one example of a variable
and how they would be measured by each:
a. Nominal Scales
This scale does not allocate any numerical value to the variable but just labels the
variable.
Example: Gender, which is either male or female but cannot have any numerical
value.
Color: This can have different labeling but no numerical value.
b. Ordinal Scales
This scale signifies characteristic of the data but numerical values cannot be assigned
to the variable.
Example: Mood of a person, Satisfaction level: No numerical value but there is an
order which gives a sense of comparative study
c. Interval Scales
This kind of scale is an orderly numerical scale with magnitude of change
(Wasserman, 2013).
Example: Range of a data set as time interval or temperature variation interval.
d. Ratio Scales
Ratio scale gives ordered and numerical data with a clear definition of “zero”.
Inferential statistical can be applied on ratio scaled data.
Example: Standard deviation of a data set.
5. Complete the following sentence: It is usually best to gather data at the highest level
of measurement for research variables because this helps in application of various
statistical tests and conclude from statistical inferences.
4
Paraphrase This Document
Need a fresh take? Get an instant paraphrase of this document with our AI Paraphraser
P a g e | 5
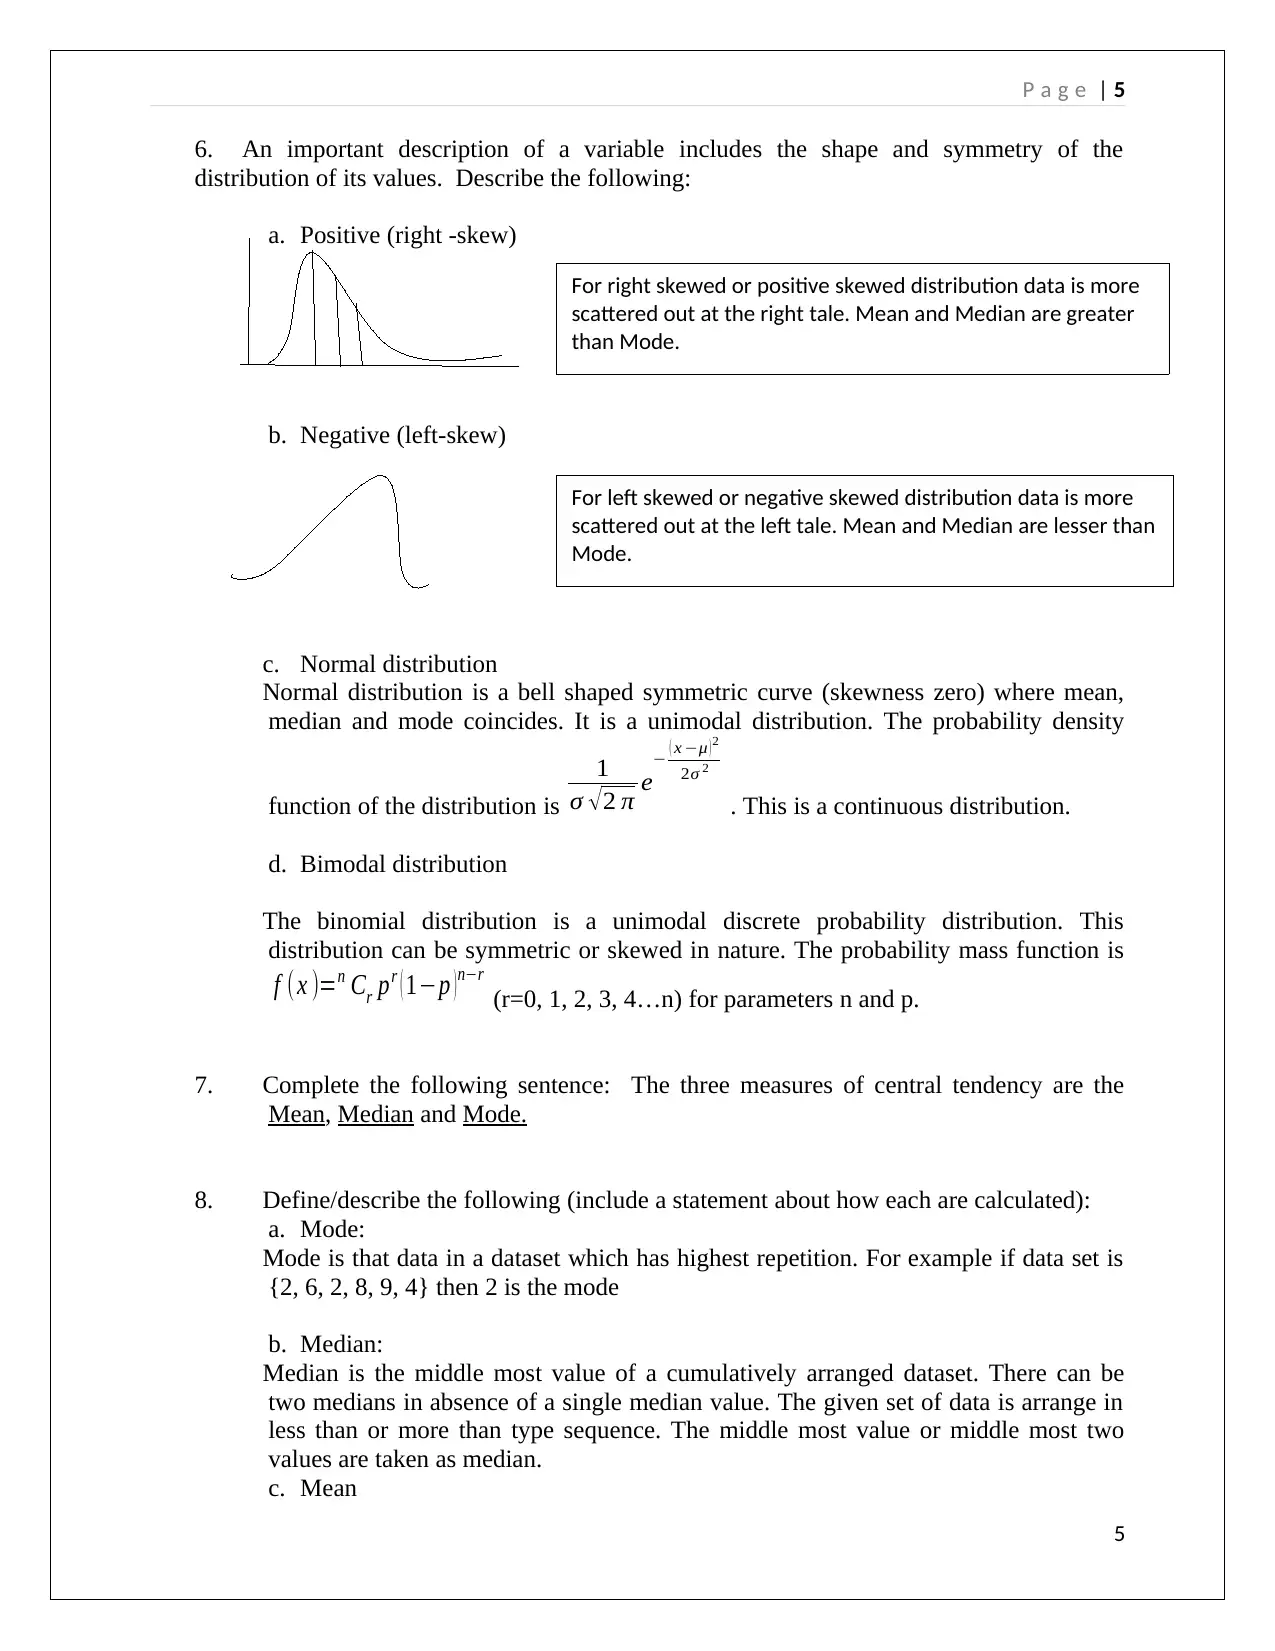
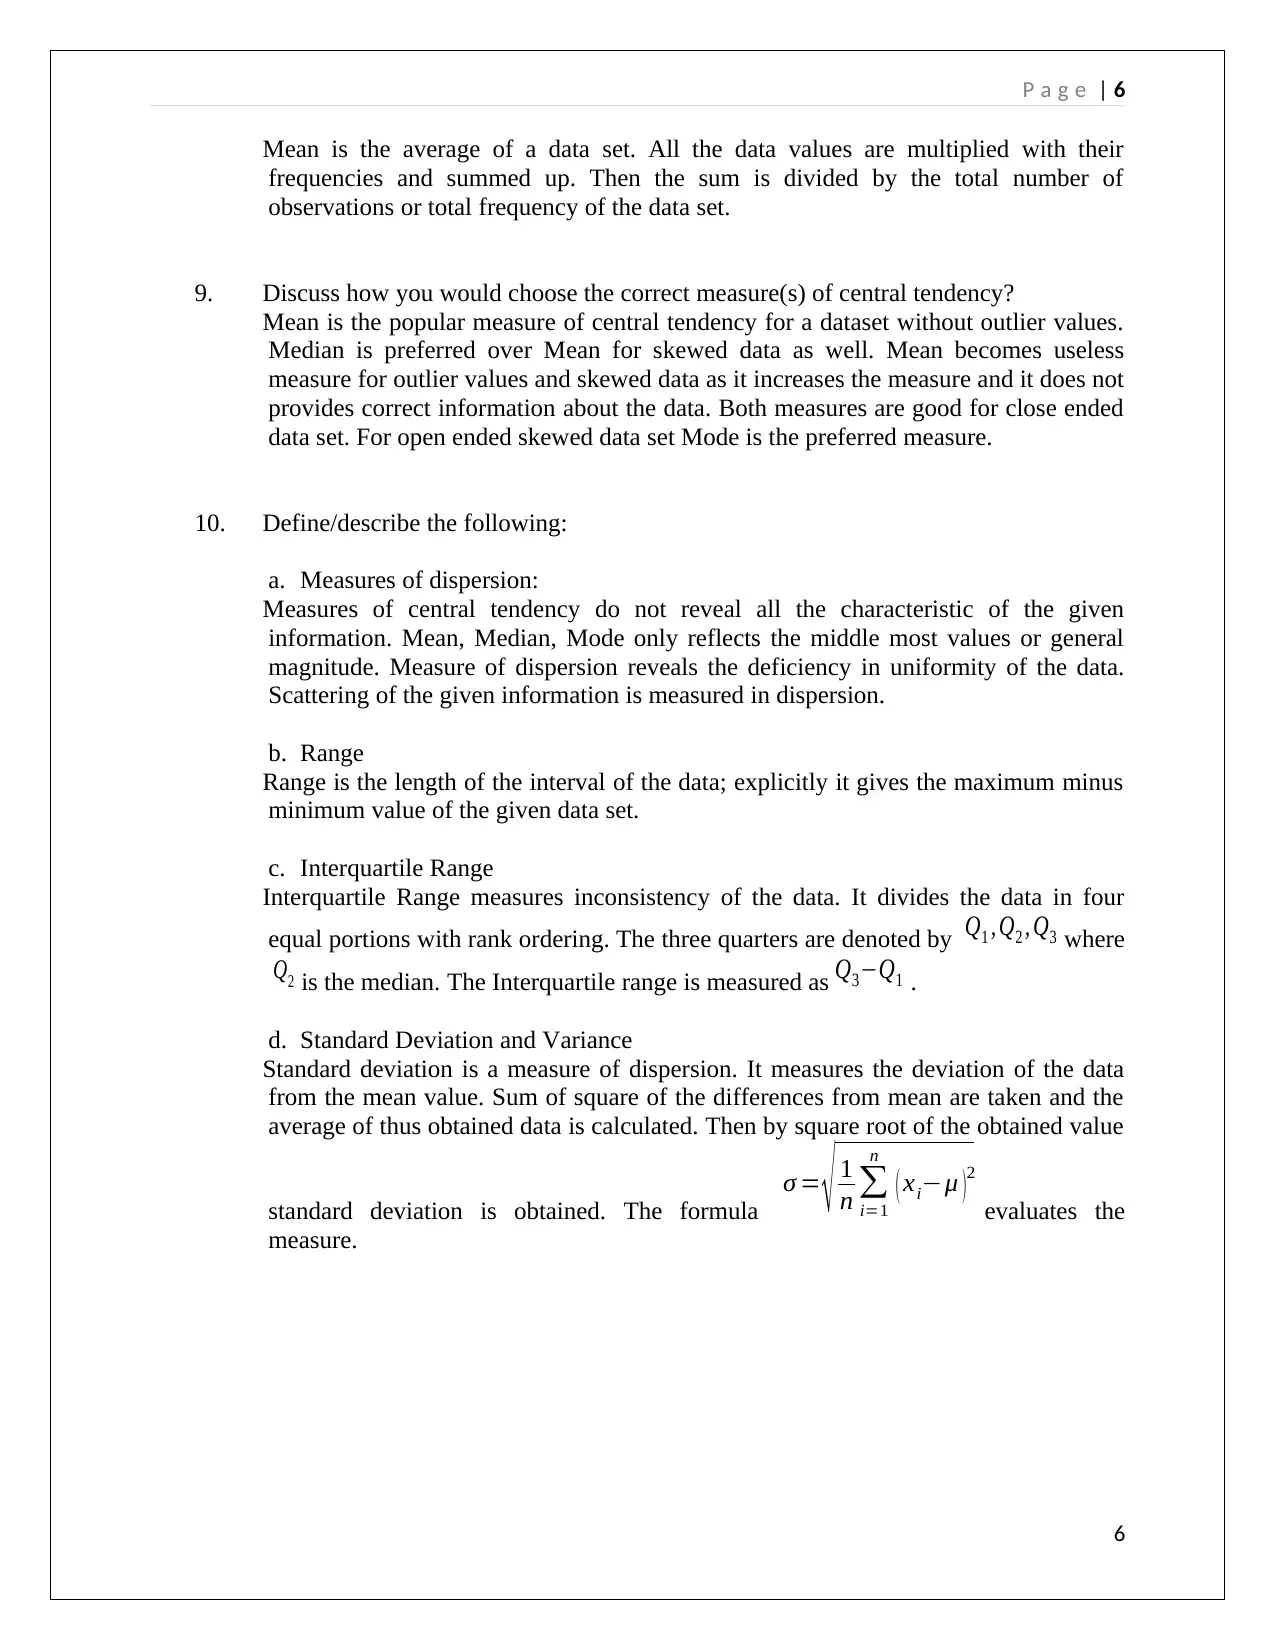
6. An important description of a variable includes the shape and symmetry of the
distribution of its values. Describe the following:
a. Positive (right -skew)
b. Negative (left-skew)
c. Normal distribution
Normal distribution is a bell shaped symmetric curve (skewness zero) where mean,
median and mode coincides. It is a unimodal distribution. The probability density
function of the distribution is
1
σ √ 2 π e
− ( x −μ ) 2
2σ 2
. This is a continuous distribution.
d. Bimodal distribution
The binomial distribution is a unimodal discrete probability distribution. This
distribution can be symmetric or skewed in nature. The probability mass function is
f (x )=n Cr pr ( 1−p ) n−r
(r=0, 1, 2, 3, 4…n) for parameters n and p.
7. Complete the following sentence: The three measures of central tendency are the
Mean, Median and Mode.
8. Define/describe the following (include a statement about how each are calculated):
a. Mode:
Mode is that data in a dataset which has highest repetition. For example if data set is
{2, 6, 2, 8, 9, 4} then 2 is the mode
b. Median:
Median is the middle most value of a cumulatively arranged dataset. There can be
two medians in absence of a single median value. The given set of data is arrange in
less than or more than type sequence. The middle most value or middle most two
values are taken as median.
c. Mean
5
For right skewed or positive skewed distribution data is more
scattered out at the right tale. Mean and Median are greater
than Mode.
For left skewed or negative skewed distribution data is more
scattered out at the left tale. Mean and Median are lesser than
Mode.
P a g e | 6
Mean is the average of a data set. All the data values are multiplied with their
frequencies and summed up. Then the sum is divided by the total number of
observations or total frequency of the data set.
9. Discuss how you would choose the correct measure(s) of central tendency?
Mean is the popular measure of central tendency for a dataset without outlier values.
Median is preferred over Mean for skewed data as well. Mean becomes useless
measure for outlier values and skewed data as it increases the measure and it does not
provides correct information about the data. Both measures are good for close ended
data set. For open ended skewed data set Mode is the preferred measure.
10. Define/describe the following:
a. Measures of dispersion:
Measures of central tendency do not reveal all the characteristic of the given
information. Mean, Median, Mode only reflects the middle most values or general
magnitude. Measure of dispersion reveals the deficiency in uniformity of the data.
Scattering of the given information is measured in dispersion.
b. Range
Range is the length of the interval of the data; explicitly it gives the maximum minus
minimum value of the given data set.
c. Interquartile Range
Interquartile Range measures inconsistency of the data. It divides the data in four
equal portions with rank ordering. The three quarters are denoted by Q1 , Q2 , Q3 where
Q2 is the median. The Interquartile range is measured as Q3−Q1 .
d. Standard Deviation and Variance
Standard deviation is a measure of dispersion. It measures the deviation of the data
from the mean value. Sum of square of the differences from mean are taken and the
average of thus obtained data is calculated. Then by square root of the obtained value
standard deviation is obtained. The formula
σ = √ 1
n ∑
i=1
n
( xi−μ )
2
evaluates the
measure.
6
⊘ This is a preview!⊘
Do you want full access?
Subscribe today to unlock all pages.
Trusted by 1+ million students worldwide
P a g e | 7
11. To report the results of nominal data which of the following measures of central
tendency would be appropriate:
a. Mean
b. Mode
c. Median
d. All of the above
e. None of the above
ANS: Mode
12. To report the results of ordinal data which of the following measures of central
tendency would be appropriate?
a. Mean
b. Mode
c. Median
d. All of the above
e. None of the above
ANS: Median and Median
13. To report the results of interval data (e.g., Likert scale) which of the following
measure(s) of central tendency would be appropriate:
a. Mean
b. Mode
c. Median
d. All of the above
e. None of the above
ANS: Mean
14. To report the results of ratio scale data which of the following measure(s) of central
tendency would be appropriate:
a. Mean
b. Mode
c. Median
d. All of the above
e. None of the above
ANS: Mean and Median for skewed data
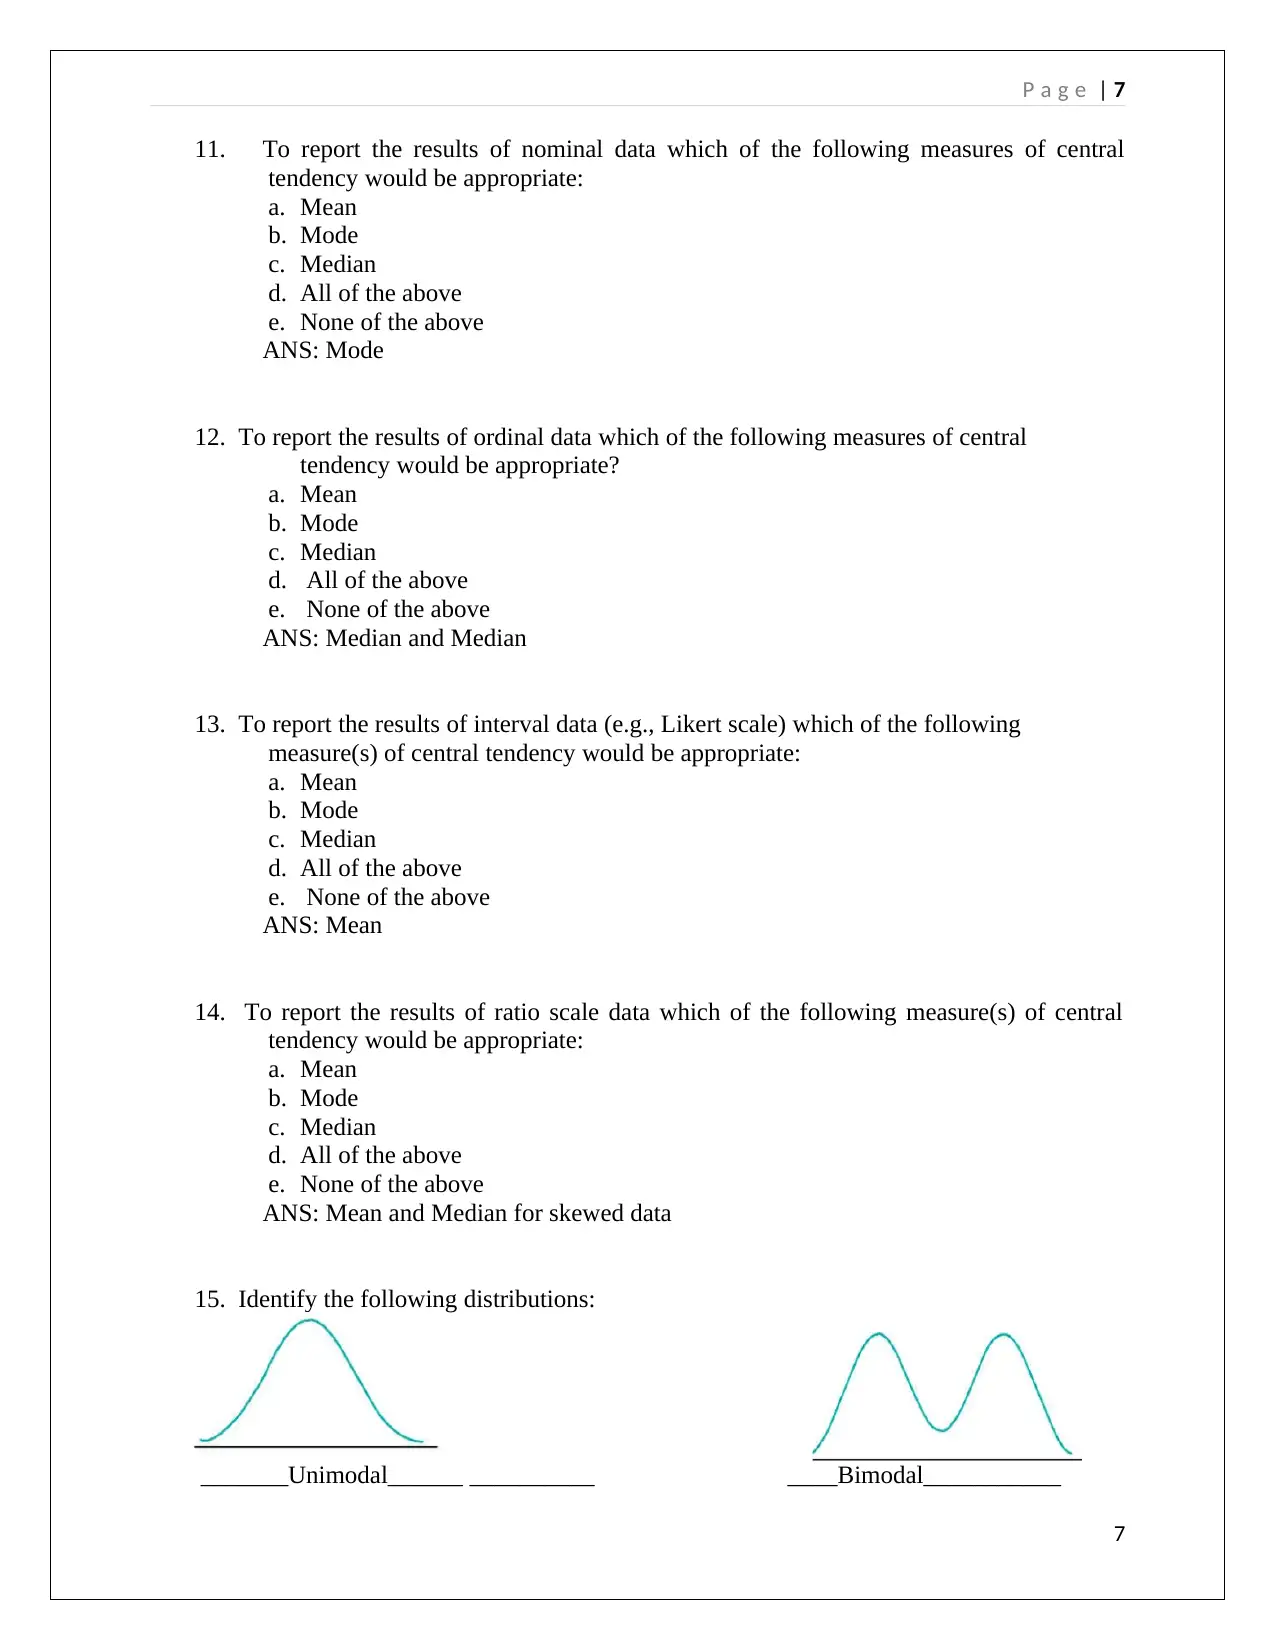
15. Identify the following distributions:
_______Unimodal______ __________ ____Bimodal___________
7
11. To report the results of nominal data which of the following measures of central
tendency would be appropriate:
a. Mean
b. Mode
c. Median
d. All of the above
e. None of the above
ANS: Mode
12. To report the results of ordinal data which of the following measures of central
tendency would be appropriate?
a. Mean
b. Mode
c. Median
d. All of the above
e. None of the above
ANS: Median and Median
13. To report the results of interval data (e.g., Likert scale) which of the following
measure(s) of central tendency would be appropriate:
a. Mean
b. Mode
c. Median
d. All of the above
e. None of the above
ANS: Mean
14. To report the results of ratio scale data which of the following measure(s) of central
tendency would be appropriate:
a. Mean
b. Mode
c. Median
d. All of the above
e. None of the above
ANS: Mean and Median for skewed data
15. Identify the following distributions:
_______Unimodal______ __________ ____Bimodal___________
7
Paraphrase This Document
Need a fresh take? Get an instant paraphrase of this document with our AI Paraphraser
P a g e | 8
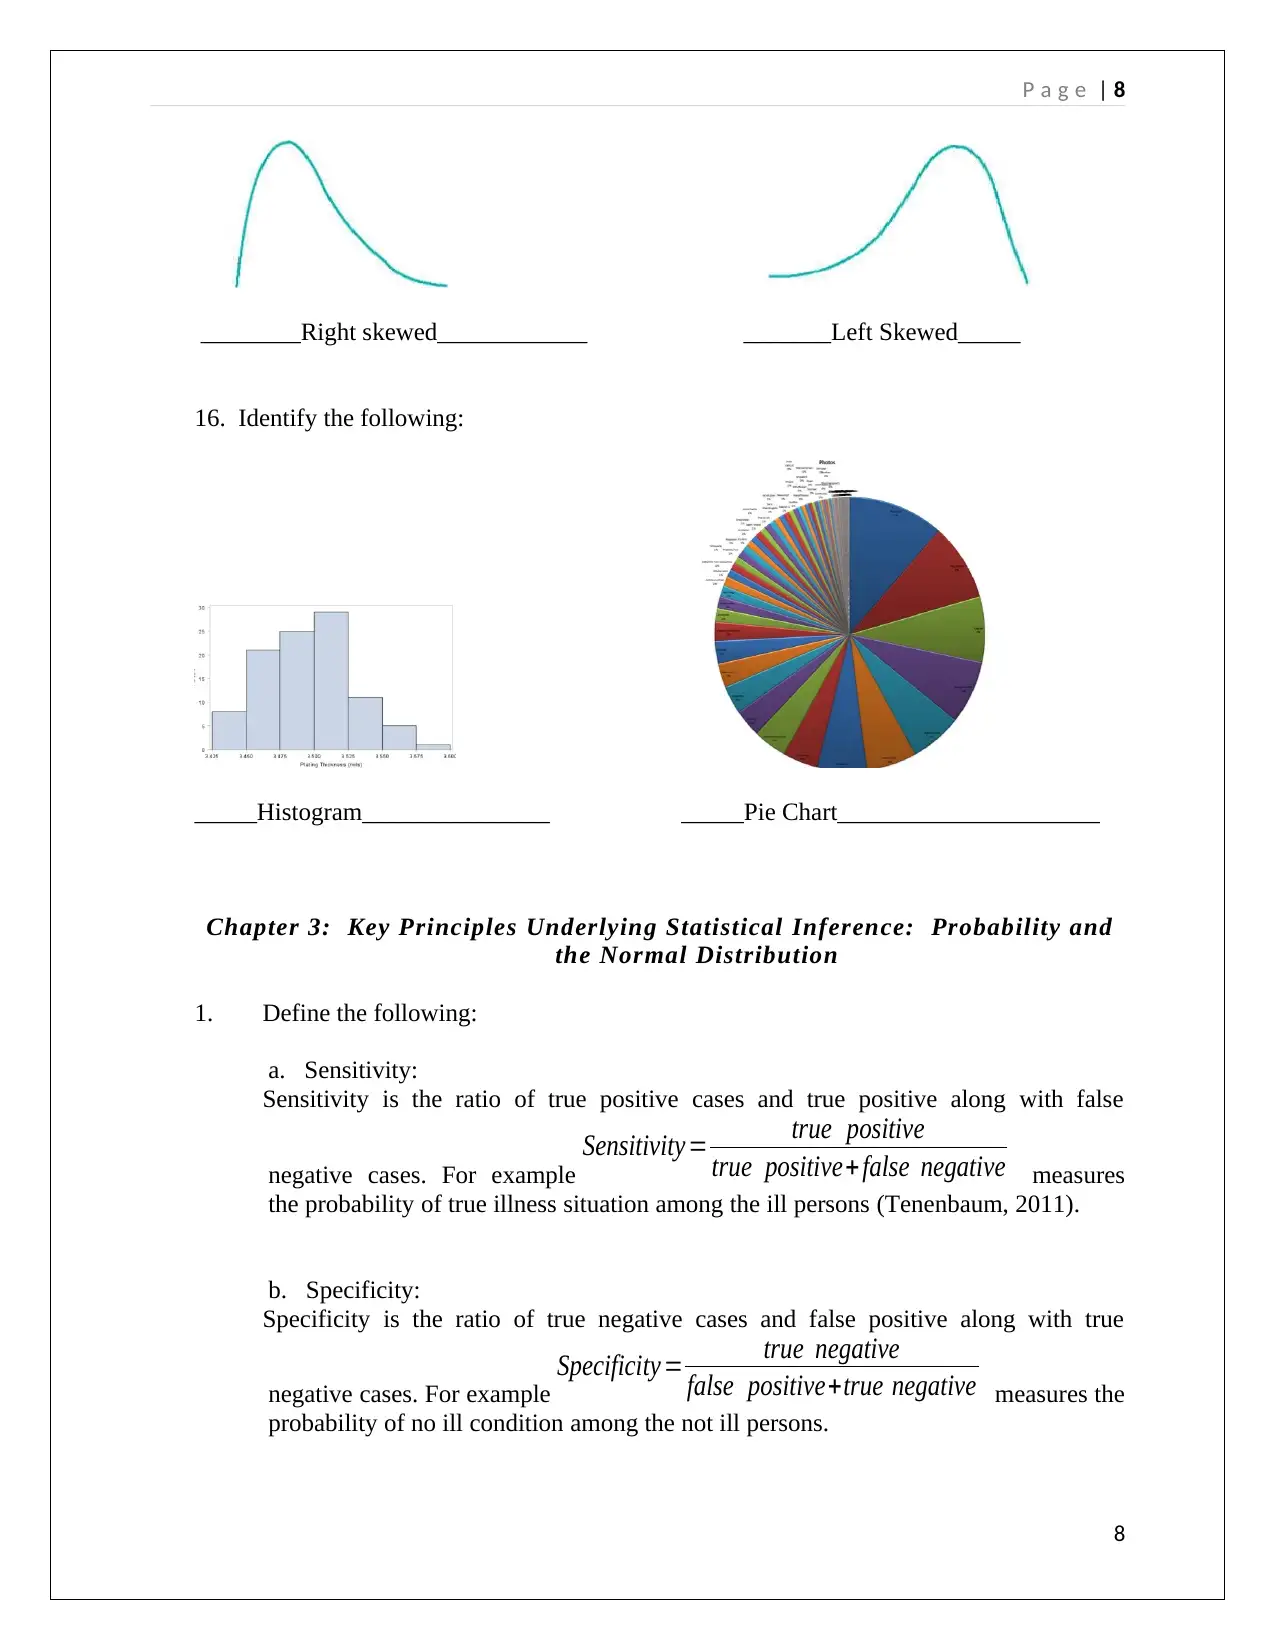
________Right skewed____________ _______Left Skewed_____
16. Identify the following:
_____Histogram_______________ _____Pie Chart_____________________
Chapter 3: Key Principles Underlying Statistical Inference: Probability and
the Normal Distribution
1. Define the following:
a. Sensitivity:
Sensitivity is the ratio of true positive cases and true positive along with false
negative cases. For example
Sensitivity= true positive
true positive+ false negative measures
the probability of true illness situation among the ill persons (Tenenbaum, 2011).
b. Specificity:
Specificity is the ratio of true negative cases and false positive along with true
negative cases. For example
Specificity = true negative
false positive+true negative measures the
probability of no ill condition among the not ill persons.
8
P a g e | 9
c. Predictive Value:
Predictive value can be negative or positive. Positive value gives the ratio of true
positives compared to number of positives. It is nothing but power of a test. Negative
value gives the ratio of true negatives compared to number of negatives. This is type
II error of a test.
d. Efficiency
In hypothesis testing two types of estimation are done. They are Point estimation and
Interval estimation. Efficiency measures the quality of these estimators (Forbes,
2011). Efficiency helps to optimize the sample size for quality of estimation for both
cases.
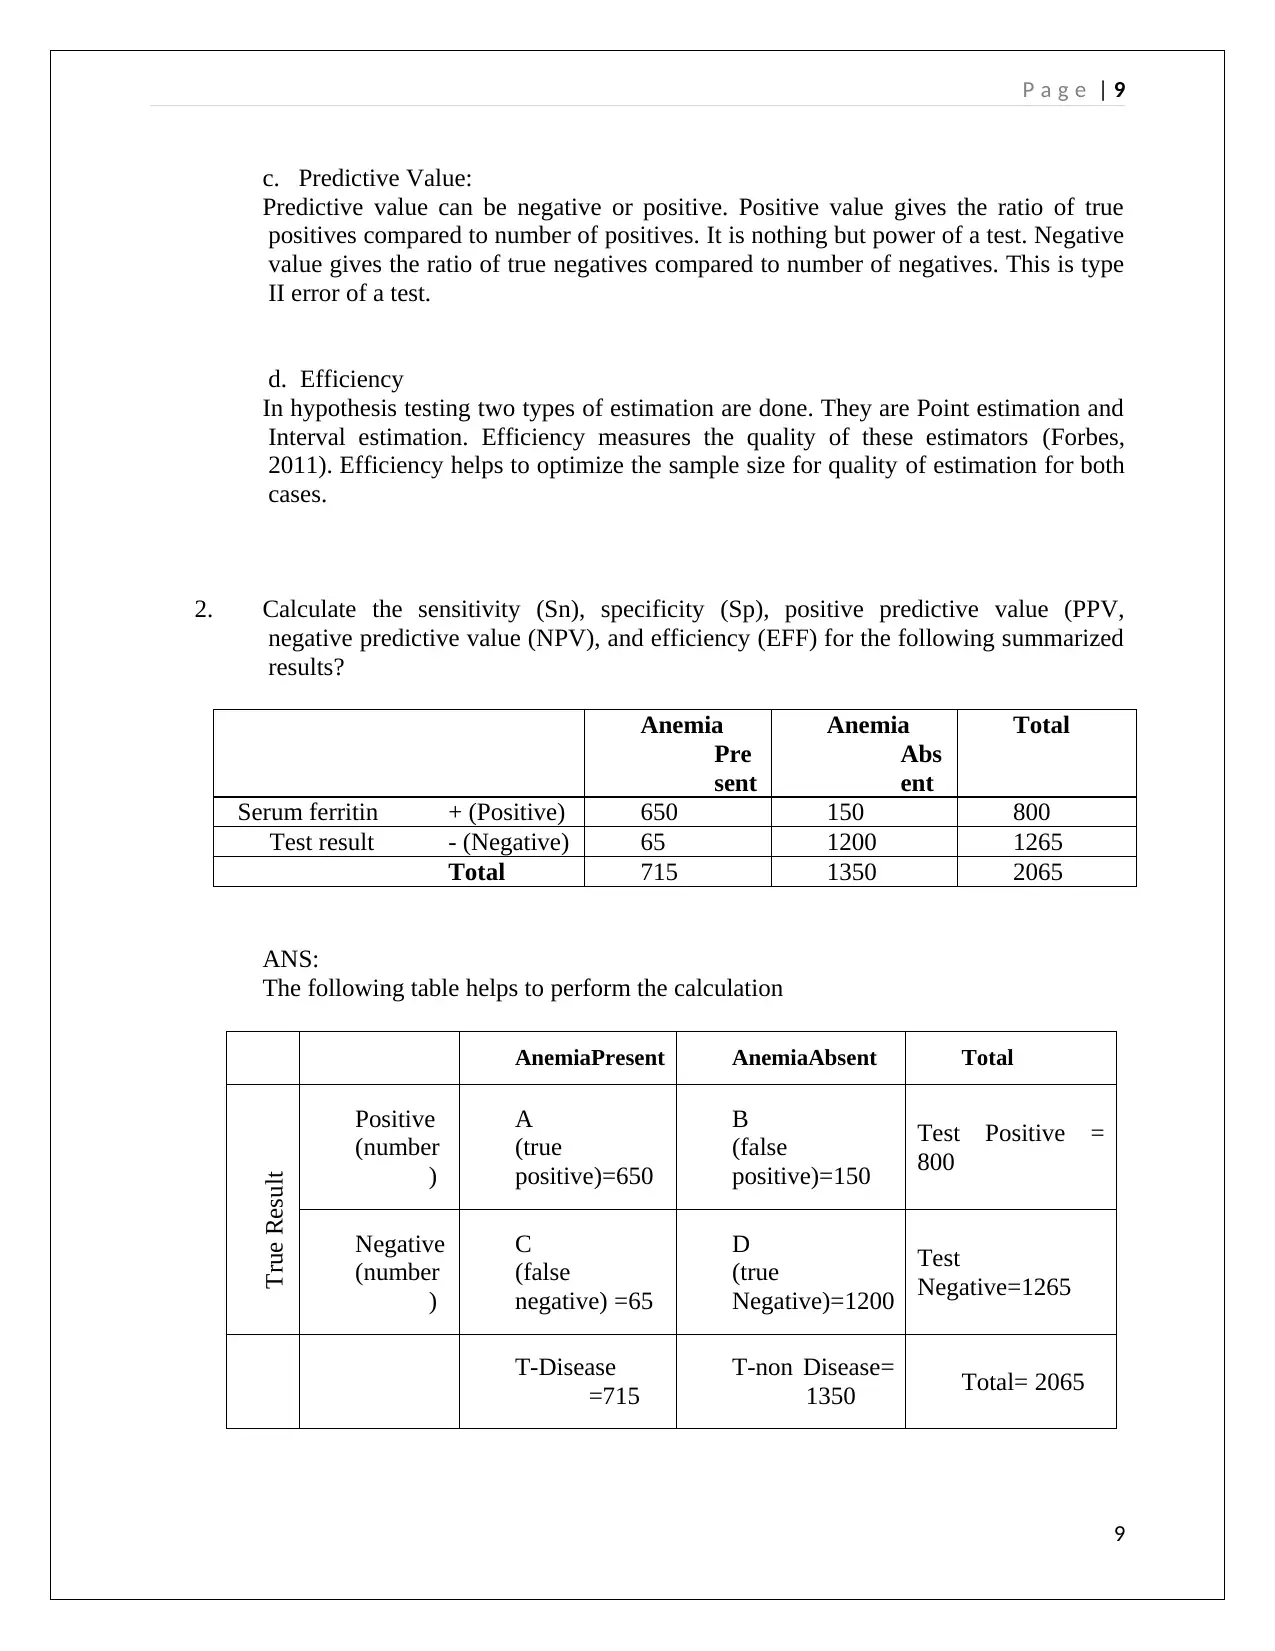
2. Calculate the sensitivity (Sn), specificity (Sp), positive predictive value (PPV,
negative predictive value (NPV), and efficiency (EFF) for the following summarized
results?
Anemia
Pre
sent
Anemia
Abs
ent
Total
Serum ferritin + (Positive) 650 150 800
Test result - (Negative) 65 1200 1265
Total 715 1350 2065
ANS:
The following table helps to perform the calculation
AnemiaPresent AnemiaAbsent Total
True Result
Positive
(number
)
A
(true
positive)=650
B
(false
positive)=150
Test Positive =
800
Negative
(number
)
C
(false
negative) =65
D
(true
Negative)=1200
Test
Negative=1265
T-Disease
=715
T-non Disease=
1350 Total= 2065
9
c. Predictive Value:
Predictive value can be negative or positive. Positive value gives the ratio of true
positives compared to number of positives. It is nothing but power of a test. Negative
value gives the ratio of true negatives compared to number of negatives. This is type
II error of a test.
d. Efficiency
In hypothesis testing two types of estimation are done. They are Point estimation and
Interval estimation. Efficiency measures the quality of these estimators (Forbes,
2011). Efficiency helps to optimize the sample size for quality of estimation for both
cases.
2. Calculate the sensitivity (Sn), specificity (Sp), positive predictive value (PPV,
negative predictive value (NPV), and efficiency (EFF) for the following summarized
results?
Anemia
Pre
sent
Anemia
Abs
ent
Total
Serum ferritin + (Positive) 650 150 800
Test result - (Negative) 65 1200 1265
Total 715 1350 2065
ANS:
The following table helps to perform the calculation
AnemiaPresent AnemiaAbsent Total
True Result
Positive
(number
)
A
(true
positive)=650
B
(false
positive)=150
Test Positive =
800
Negative
(number
)
C
(false
negative) =65
D
(true
Negative)=1200
Test
Negative=1265
T-Disease
=715
T-non Disease=
1350 Total= 2065
9
⊘ This is a preview!⊘
Do you want full access?
Subscribe today to unlock all pages.
Trusted by 1+ million students worldwide
P a g e | 10
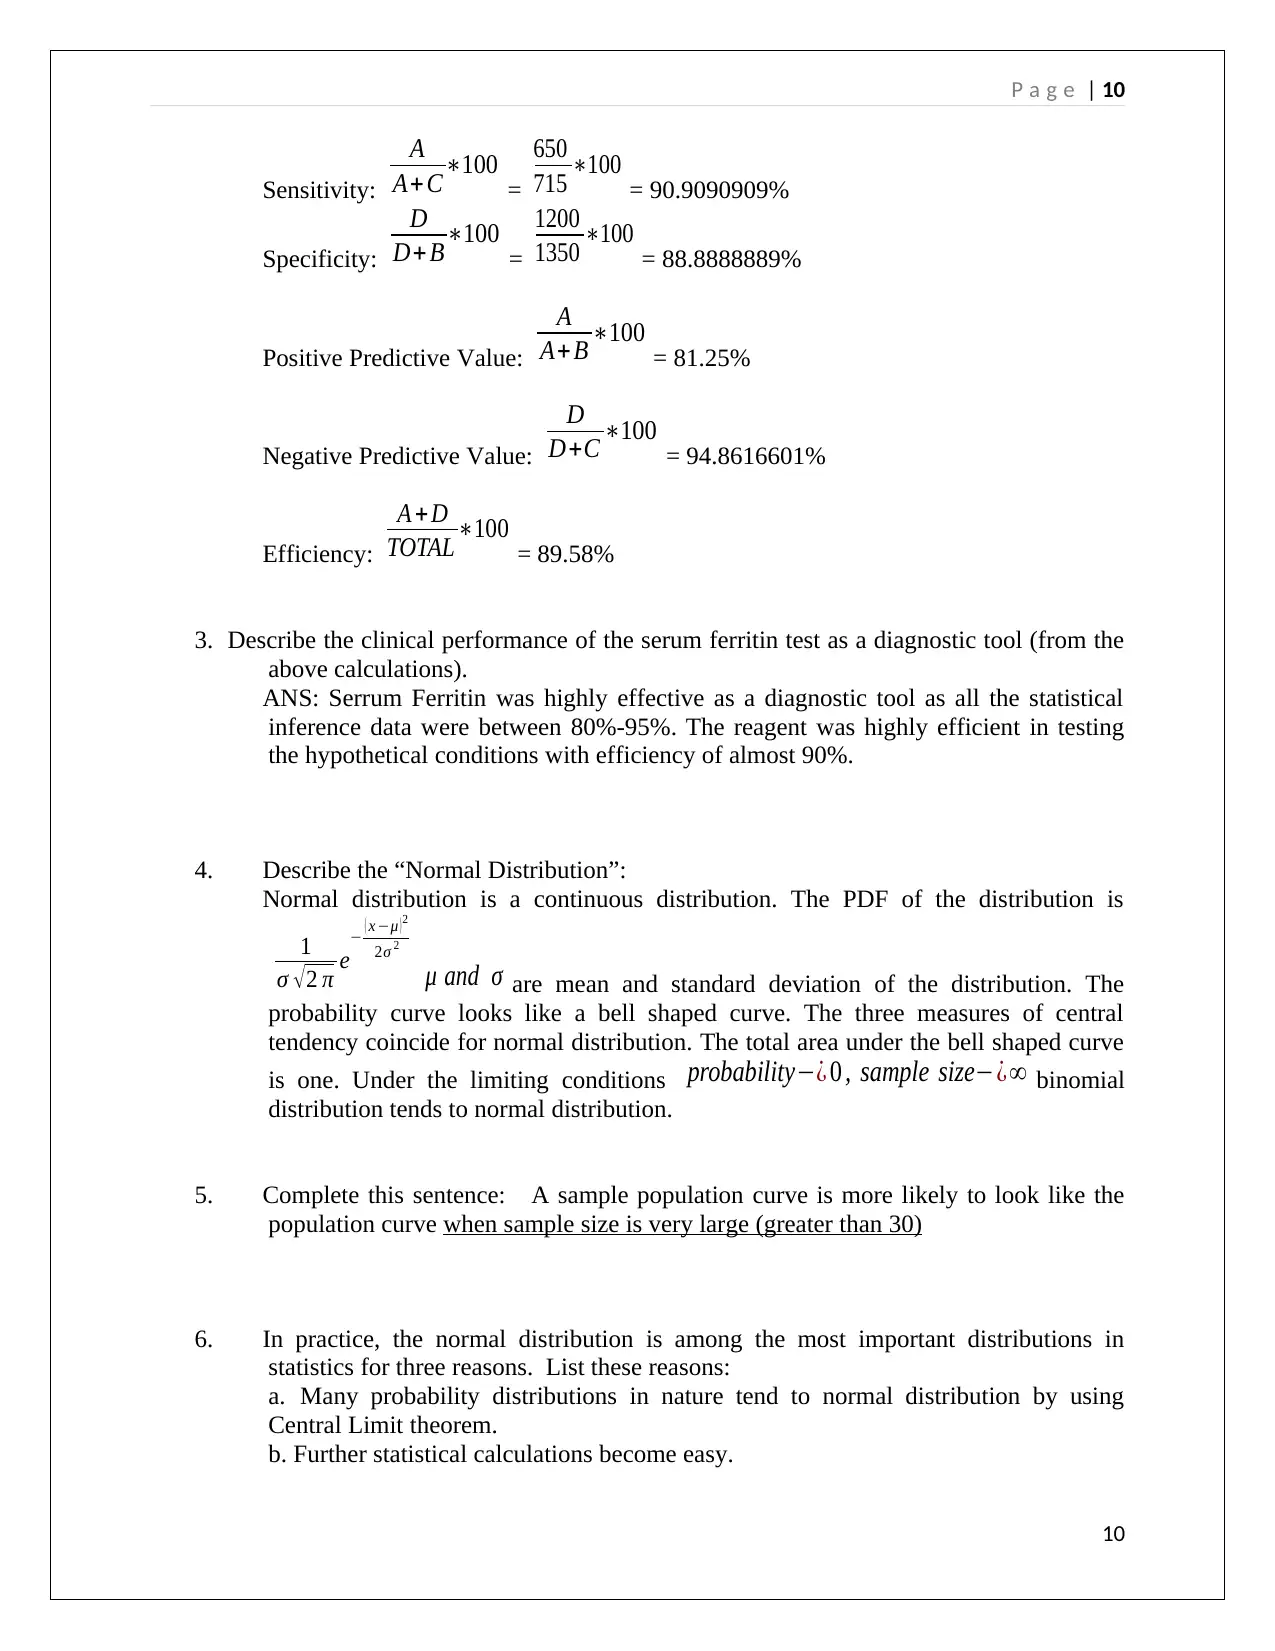
Sensitivity:
A
A+ C∗100 =
650
715 ∗100 = 90.9090909%
Specificity:
D
D+ B∗100 =
1200
1350 ∗100 = 88.8888889%
Positive Predictive Value:
A
A+ B ∗100 = 81.25%
Negative Predictive Value:
D
D+C ∗100 = 94.8616601%
Efficiency:
A + D
TOTAL ∗100 = 89.58%
3. Describe the clinical performance of the serum ferritin test as a diagnostic tool (from the
above calculations).
ANS: Serrum Ferritin was highly effective as a diagnostic tool as all the statistical
inference data were between 80%-95%. The reagent was highly efficient in testing
the hypothetical conditions with efficiency of almost 90%.
4. Describe the “Normal Distribution”:
Normal distribution is a continuous distribution. The PDF of the distribution is
1
σ √ 2 π e
− ( x −μ ) 2
2σ 2
μ and σ are mean and standard deviation of the distribution. The
probability curve looks like a bell shaped curve. The three measures of central
tendency coincide for normal distribution. The total area under the bell shaped curve
is one. Under the limiting conditions probability−¿ 0 , sample size−¿∞ binomial
distribution tends to normal distribution.
5. Complete this sentence: A sample population curve is more likely to look like the
population curve when sample size is very large (greater than 30)
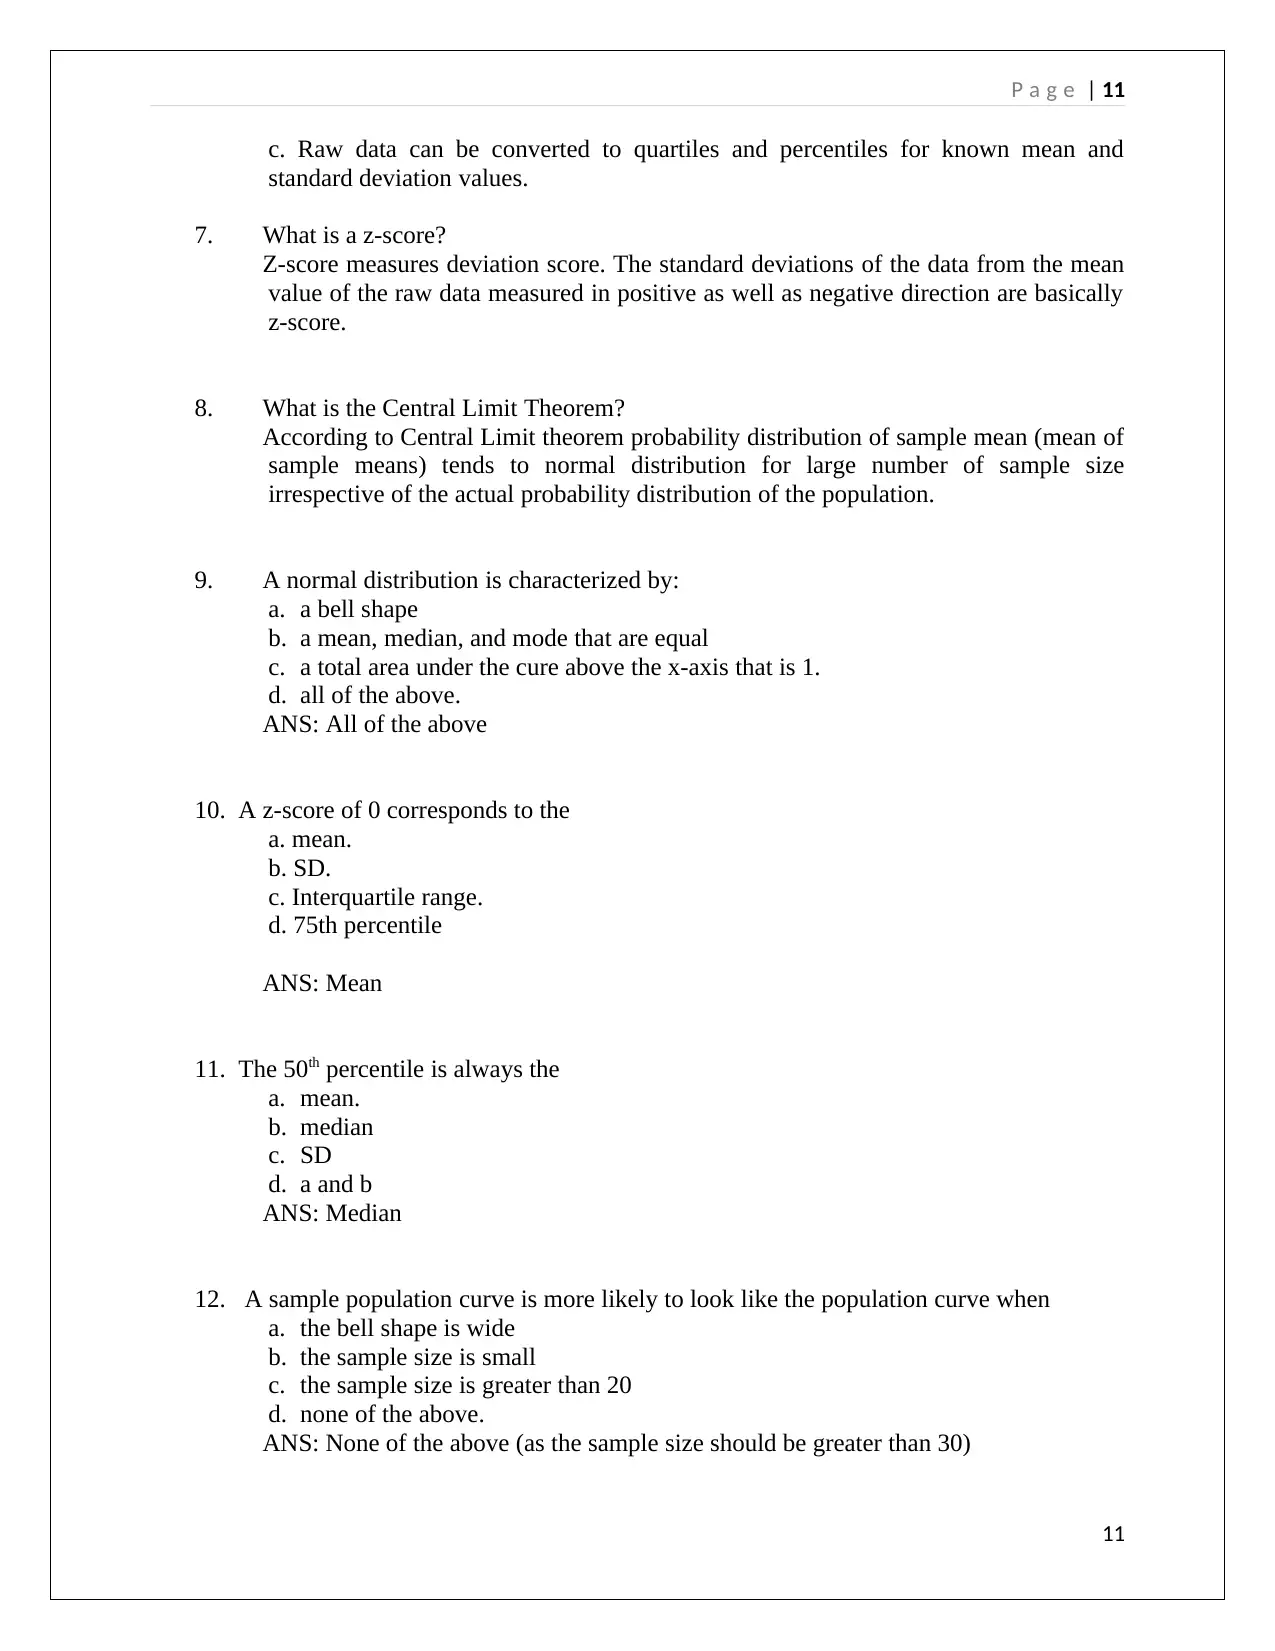
6. In practice, the normal distribution is among the most important distributions in
statistics for three reasons. List these reasons:
a. Many probability distributions in nature tend to normal distribution by using
Central Limit theorem.
b. Further statistical calculations become easy.
10
Sensitivity:
A
A+ C∗100 =
650
715 ∗100 = 90.9090909%
Specificity:
D
D+ B∗100 =
1200
1350 ∗100 = 88.8888889%
Positive Predictive Value:
A
A+ B ∗100 = 81.25%
Negative Predictive Value:
D
D+C ∗100 = 94.8616601%
Efficiency:
A + D
TOTAL ∗100 = 89.58%
3. Describe the clinical performance of the serum ferritin test as a diagnostic tool (from the
above calculations).
ANS: Serrum Ferritin was highly effective as a diagnostic tool as all the statistical
inference data were between 80%-95%. The reagent was highly efficient in testing
the hypothetical conditions with efficiency of almost 90%.
4. Describe the “Normal Distribution”:
Normal distribution is a continuous distribution. The PDF of the distribution is
1
σ √ 2 π e
− ( x −μ ) 2
2σ 2
μ and σ are mean and standard deviation of the distribution. The
probability curve looks like a bell shaped curve. The three measures of central
tendency coincide for normal distribution. The total area under the bell shaped curve
is one. Under the limiting conditions probability−¿ 0 , sample size−¿∞ binomial
distribution tends to normal distribution.
5. Complete this sentence: A sample population curve is more likely to look like the
population curve when sample size is very large (greater than 30)
6. In practice, the normal distribution is among the most important distributions in
statistics for three reasons. List these reasons:
a. Many probability distributions in nature tend to normal distribution by using
Central Limit theorem.
b. Further statistical calculations become easy.
10
Paraphrase This Document
Need a fresh take? Get an instant paraphrase of this document with our AI Paraphraser
P a g e | 11
c. Raw data can be converted to quartiles and percentiles for known mean and
standard deviation values.
7. What is a z-score?
Z-score measures deviation score. The standard deviations of the data from the mean
value of the raw data measured in positive as well as negative direction are basically
z-score.
8. What is the Central Limit Theorem?
According to Central Limit theorem probability distribution of sample mean (mean of
sample means) tends to normal distribution for large number of sample size
irrespective of the actual probability distribution of the population.
9. A normal distribution is characterized by:
a. a bell shape
b. a mean, median, and mode that are equal
c. a total area under the cure above the x-axis that is 1.
d. all of the above.
ANS: All of the above
10. A z-score of 0 corresponds to the
a. mean.
b. SD.
c. Interquartile range.
d. 75th percentile
ANS: Mean
11. The 50th percentile is always the
a. mean.
b. median
c. SD
d. a and b
ANS: Median
12. A sample population curve is more likely to look like the population curve when
a. the bell shape is wide
b. the sample size is small
c. the sample size is greater than 20
d. none of the above.
ANS: None of the above (as the sample size should be greater than 30)
11
P a g e | 12
13. When raw scores are converted to standard scores, the resulting distributions have a
mean equal to ___zero____ and a standard deviation equal to ____one_______.
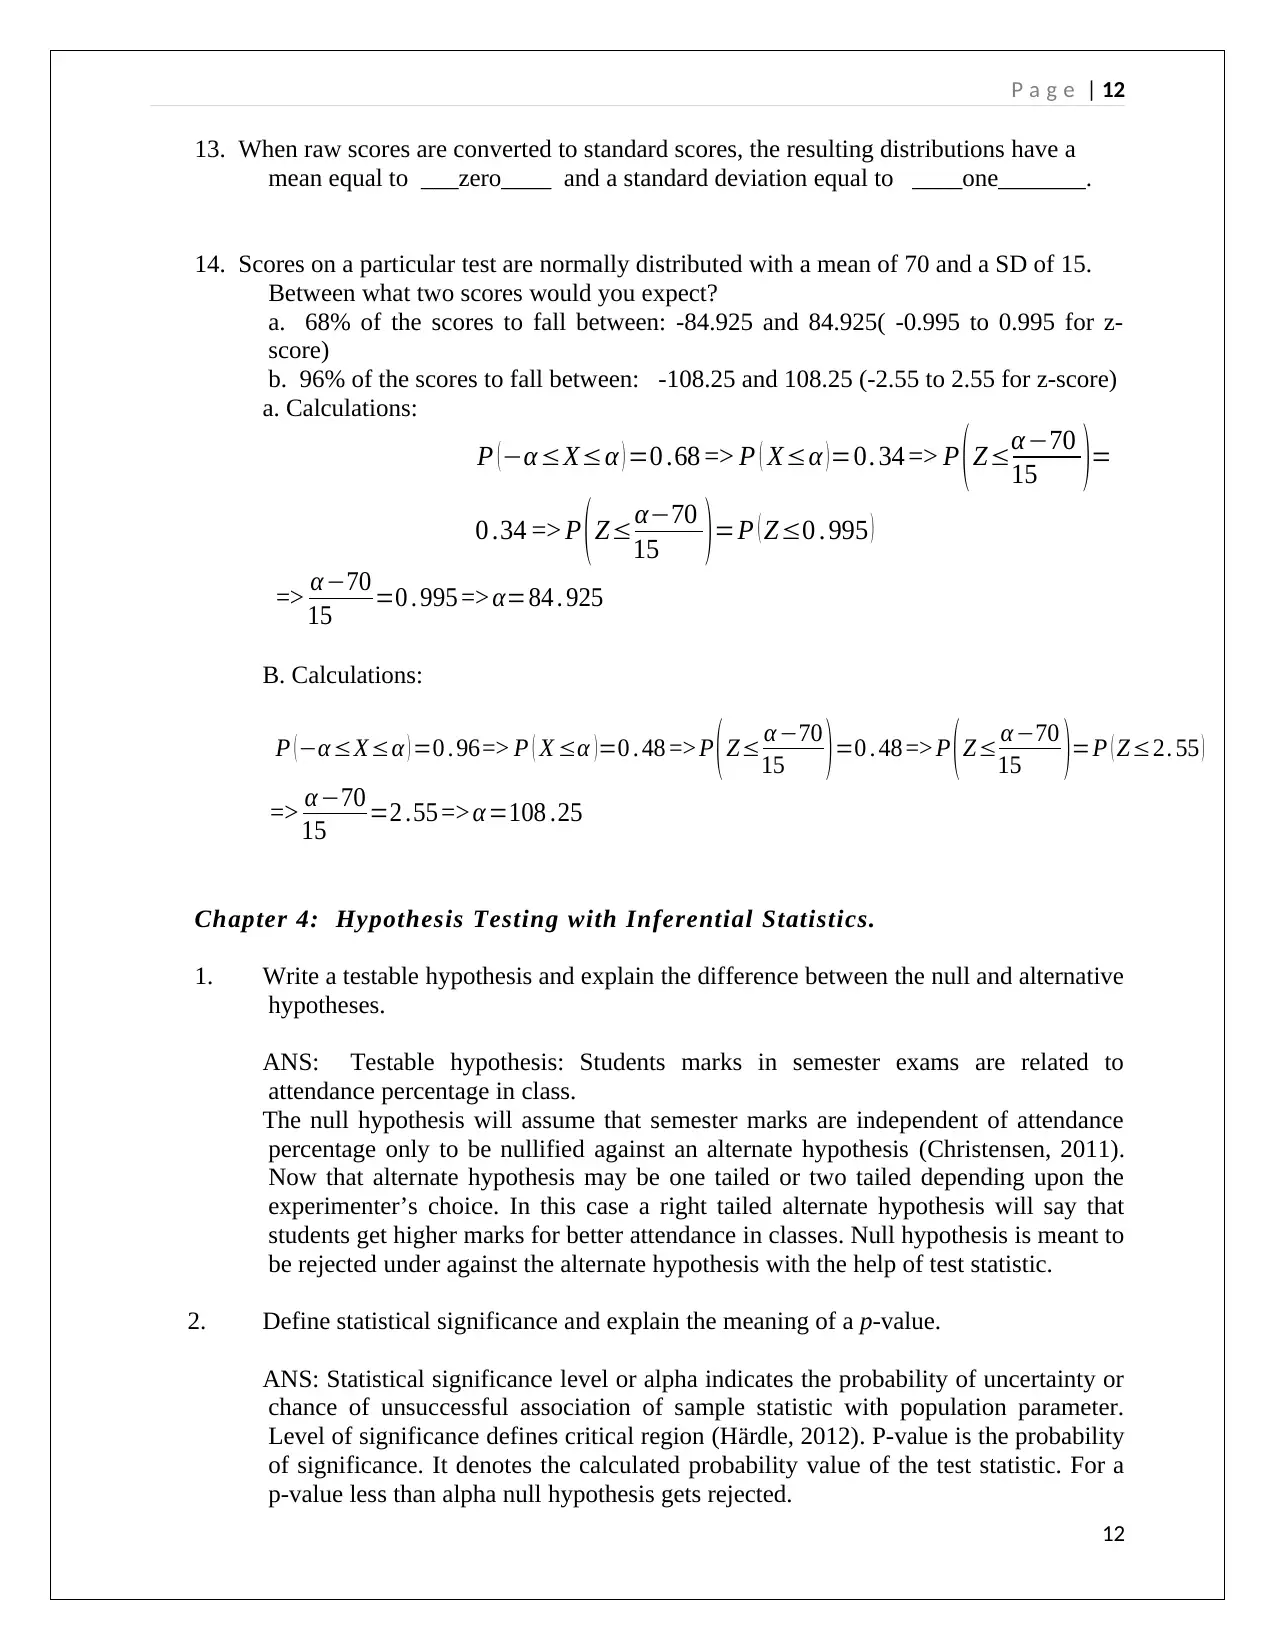
14. Scores on a particular test are normally distributed with a mean of 70 and a SD of 15.
Between what two scores would you expect?
a. 68% of the scores to fall between: -84.925 and 84.925( -0.995 to 0.995 for z-
score)
b. 96% of the scores to fall between: -108.25 and 108.25 (-2.55 to 2.55 for z-score)
a. Calculations:
P ( −α≤X≤α ) =0 .68 => P ( X≤α ) =0. 34 => P ( Z≤α−70
15 )=
0 .34 => P ( Z≤α−70
15 ) =P ( Z≤0 . 995 )
=> α −70
15 =0 . 995 => α=84 . 925
B. Calculations:
P ( −α≤X≤α ) =0 . 96=> P ( X ≤α ) =0 . 48 => P ( Z≤ α −70
15 ) =0 . 48 => P ( Z≤ α −70
15 )=P ( Z≤2. 55 )
=> α −70
15 =2 .55 => α=108 .25
Chapter 4: Hypothesis Testing with Inferential Statistics.
1. Write a testable hypothesis and explain the difference between the null and alternative
hypotheses.
ANS: Testable hypothesis: Students marks in semester exams are related to
attendance percentage in class.
The null hypothesis will assume that semester marks are independent of attendance
percentage only to be nullified against an alternate hypothesis (Christensen, 2011).
Now that alternate hypothesis may be one tailed or two tailed depending upon the
experimenter’s choice. In this case a right tailed alternate hypothesis will say that
students get higher marks for better attendance in classes. Null hypothesis is meant to
be rejected under against the alternate hypothesis with the help of test statistic.
2. Define statistical significance and explain the meaning of a p-value.
ANS: Statistical significance level or alpha indicates the probability of uncertainty or
chance of unsuccessful association of sample statistic with population parameter.
Level of significance defines critical region (Härdle, 2012). P-value is the probability
of significance. It denotes the calculated probability value of the test statistic. For a
p-value less than alpha null hypothesis gets rejected.
12
13. When raw scores are converted to standard scores, the resulting distributions have a
mean equal to ___zero____ and a standard deviation equal to ____one_______.
14. Scores on a particular test are normally distributed with a mean of 70 and a SD of 15.
Between what two scores would you expect?
a. 68% of the scores to fall between: -84.925 and 84.925( -0.995 to 0.995 for z-
score)
b. 96% of the scores to fall between: -108.25 and 108.25 (-2.55 to 2.55 for z-score)
a. Calculations:
P ( −α≤X≤α ) =0 .68 => P ( X≤α ) =0. 34 => P ( Z≤α−70
15 )=
0 .34 => P ( Z≤α−70
15 ) =P ( Z≤0 . 995 )
=> α −70
15 =0 . 995 => α=84 . 925
B. Calculations:
P ( −α≤X≤α ) =0 . 96=> P ( X ≤α ) =0 . 48 => P ( Z≤ α −70
15 ) =0 . 48 => P ( Z≤ α −70
15 )=P ( Z≤2. 55 )
=> α −70
15 =2 .55 => α=108 .25
Chapter 4: Hypothesis Testing with Inferential Statistics.
1. Write a testable hypothesis and explain the difference between the null and alternative
hypotheses.
ANS: Testable hypothesis: Students marks in semester exams are related to
attendance percentage in class.
The null hypothesis will assume that semester marks are independent of attendance
percentage only to be nullified against an alternate hypothesis (Christensen, 2011).
Now that alternate hypothesis may be one tailed or two tailed depending upon the
experimenter’s choice. In this case a right tailed alternate hypothesis will say that
students get higher marks for better attendance in classes. Null hypothesis is meant to
be rejected under against the alternate hypothesis with the help of test statistic.
2. Define statistical significance and explain the meaning of a p-value.
ANS: Statistical significance level or alpha indicates the probability of uncertainty or
chance of unsuccessful association of sample statistic with population parameter.
Level of significance defines critical region (Härdle, 2012). P-value is the probability
of significance. It denotes the calculated probability value of the test statistic. For a
p-value less than alpha null hypothesis gets rejected.
12
⊘ This is a preview!⊘
Do you want full access?
Subscribe today to unlock all pages.
Trusted by 1+ million students worldwide
1 out of 27
Related Documents


Your All-in-One AI-Powered Toolkit for Academic Success.
+13062052269
info@desklib.com
Available 24*7 on WhatsApp / Email
![[object Object]](/_next/static/media/star-bottom.7253800d.svg)
Unlock your academic potential
Copyright © 2020–2026 A2Z Services. All Rights Reserved. Developed and managed by ZUCOL.