Predicting Australian GDP Growth Rate using Economic Indicators
VerifiedAdded on 2022/12/27
|16
|3309
|87
Report
AI Summary
This report investigates the relationship between Australia's GDP growth rate and key economic indicators: unemployment rate, inflation rate, and GDP deflator rate. Utilizing time series data from 1980 to 2017, sourced from the World Bank database, the study employs both descriptive and inferential statistical methods. The methodology includes Pearson correlation tests and regression analysis to determine the strength and direction of relationships between the variables. Descriptive statistics reveal the mean, median, standard deviation, skewness, and range for each variable, providing a comprehensive overview of the data distribution. The correlation analysis assesses the degree of linear association between the variables, while regression analysis aims to model and predict GDP growth based on the independent variables. The findings provide insights into the influence of unemployment, inflation, and GDP deflator on the Australian economy's growth trajectory.
Predicting Australian GDP growth rate using unemployment rate, inflation rate and GDP
deflator rate.
Statistics
Student Name:
Student Number:
Date: 4th May 2019
1 | P a g e
deflator rate.
Statistics
Student Name:
Student Number:
Date: 4th May 2019
1 | P a g e
Paraphrase This Document
Need a fresh take? Get an instant paraphrase of this document with our AI Paraphraser
Abstract
Gross Domestic Product (GDP) is a significant determinant of a nation's economic or financial
development. Notwithstanding, this measure of economy is impacted by various components that
can either influence it decidedly or adversely. A portion of the macroeconomic elements
accepted to have an impact on the GDP include the country's population, inflation rate, and
unemployment rate among many other factors. Various investigations have recently been done to
attempt and discover the connection between GDP growth rate and other important factors that
may be thought to have some influence on the GDP growth rate. The primary focus of this
research is to explore the relationship that exists between GDP growth rate, with inflation rate,
GDP deflator rate and unemployment rate for Australia. The study utilized time series data from
1980 to 2017 (38 observations). Data was collected from the World Bank database.
Key words: GDP growth rate, Inflation rate, GDP deflator rate, Unemployment rate
2 | P a g e
Table of Contents
Abstract............................................................................................................................................2
Table of Contents.............................................................................................................................3
Introduction......................................................................................................................................4
Methodology....................................................................................................................................5
Data..................................................................................................................................................6
Data Analysis...................................................................................................................................7
Descriptive Statistics....................................................................................................................7
Correlation (Measure of relationship)........................................................................................10
Regression analysis....................................................................................................................13
Conclusion.....................................................................................................................................14
References......................................................................................................................................15
List of Tables
Table 1: Data....................................................................................................................................6
Table 2: Descriptive (Summary) Statistics......................................................................................8
Table 3: Correlation between the variables...................................................................................10
Table 4: SUMMARY OUTPUT....................................................................................................13
Table 5: ANOVA...........................................................................................................................13
Table 6: Regression coefficients....................................................................................................13
List of Figures
Figure 1: Histogram for the GDP growth rate.................................................................................8
Figure 2: Histogram for the unemployment rate.............................................................................9
Figure 3: Histogram for the inflation rate........................................................................................9
Figure 4: Histogram for the GDP deflator rate..............................................................................10
Figure 5: Scatter plot of GDP growth rate versus unemployment rate..........................................11
Figure 6: Scatter plot of GDP growth rate versus inflation rate....................................................12
Figure 7: Scatter plot of GDP growth rate versus GDP deflator rate............................................12
3 | P a g e
⊘ This is a preview!⊘
Do you want full access?
Subscribe today to unlock all pages.
Trusted by 1+ million students worldwide
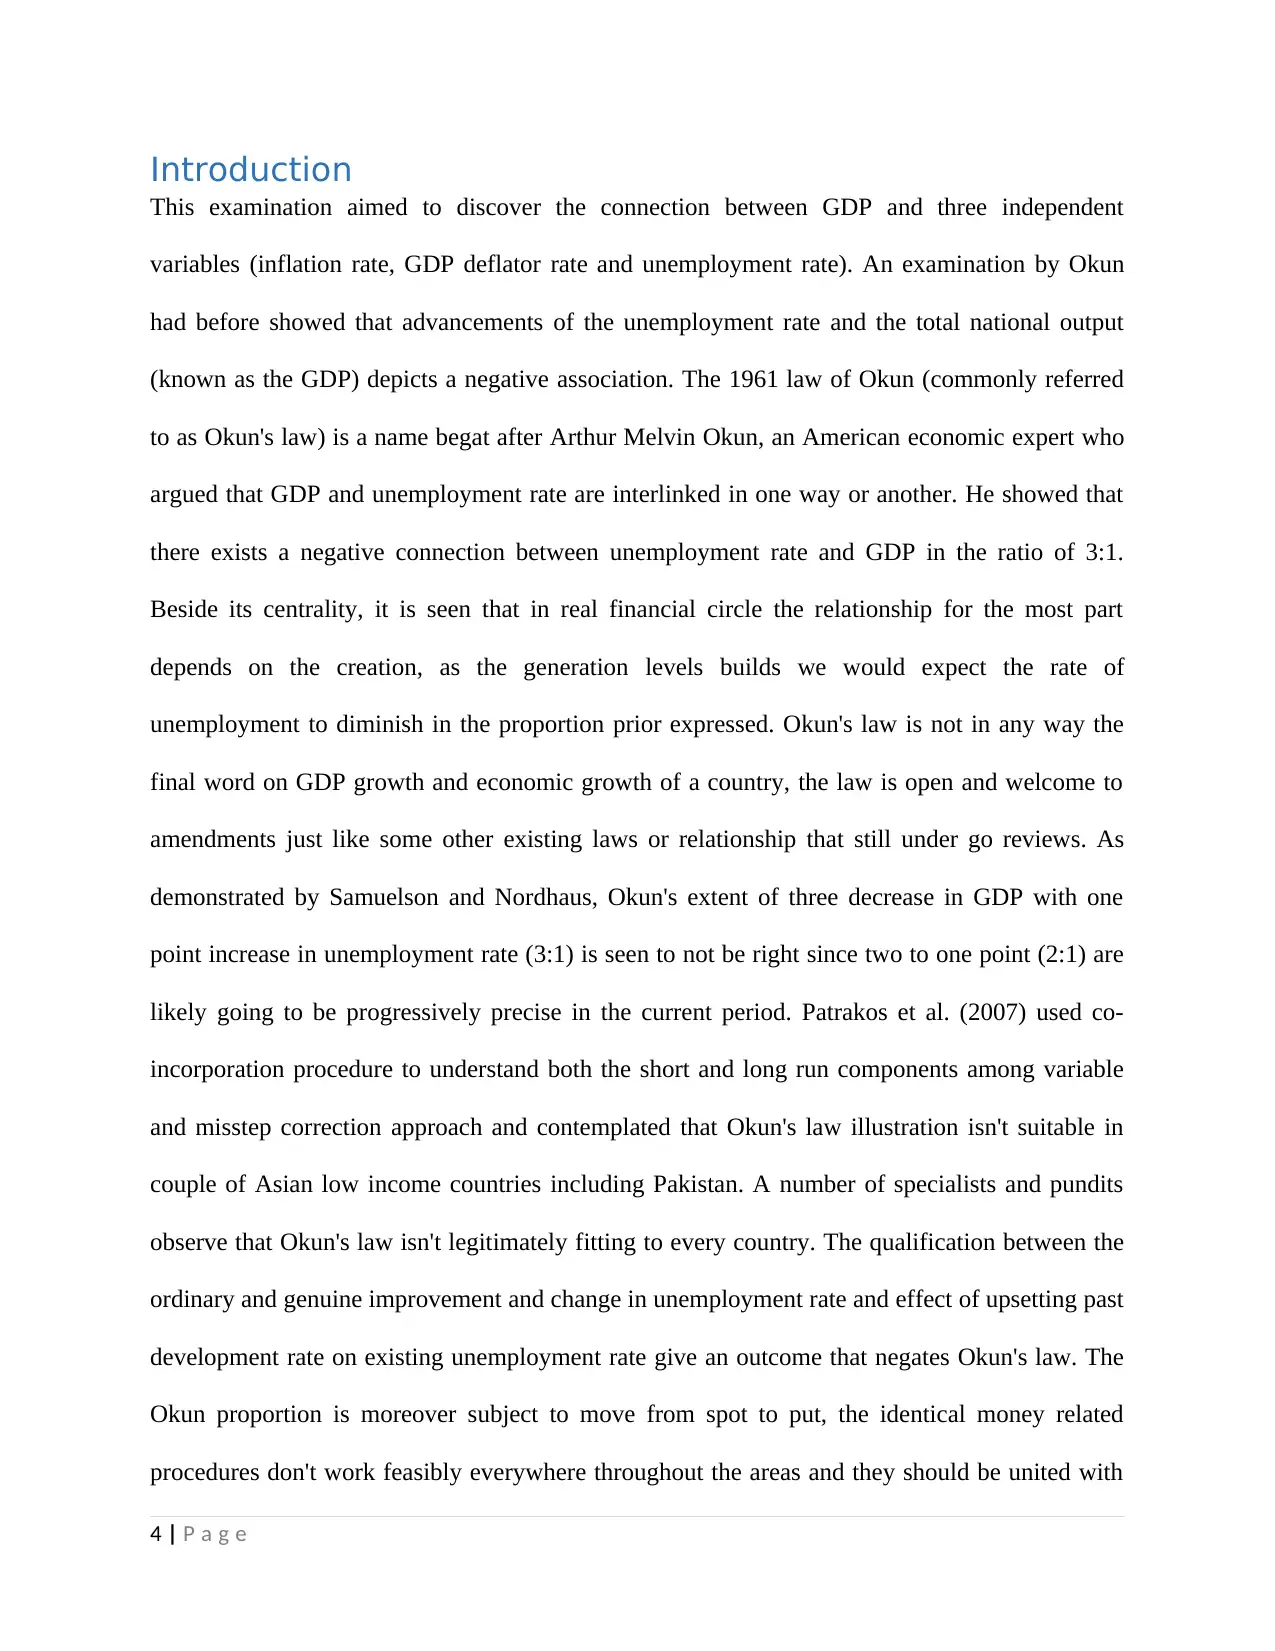
Introduction
This examination aimed to discover the connection between GDP and three independent
variables (inflation rate, GDP deflator rate and unemployment rate). An examination by Okun
had before showed that advancements of the unemployment rate and the total national output
(known as the GDP) depicts a negative association. The 1961 law of Okun (commonly referred
to as Okun's law) is a name begat after Arthur Melvin Okun, an American economic expert who
argued that GDP and unemployment rate are interlinked in one way or another. He showed that
there exists a negative connection between unemployment rate and GDP in the ratio of 3:1.
Beside its centrality, it is seen that in real financial circle the relationship for the most part
depends on the creation, as the generation levels builds we would expect the rate of
unemployment to diminish in the proportion prior expressed. Okun's law is not in any way the
final word on GDP growth and economic growth of a country, the law is open and welcome to
amendments just like some other existing laws or relationship that still under go reviews. As
demonstrated by Samuelson and Nordhaus, Okun's extent of three decrease in GDP with one
point increase in unemployment rate (3:1) is seen to not be right since two to one point (2:1) are
likely going to be progressively precise in the current period. Patrakos et al. (2007) used co-
incorporation procedure to understand both the short and long run components among variable
and misstep correction approach and contemplated that Okun's law illustration isn't suitable in
couple of Asian low income countries including Pakistan. A number of specialists and pundits
observe that Okun's law isn't legitimately fitting to every country. The qualification between the
ordinary and genuine improvement and change in unemployment rate and effect of upsetting past
development rate on existing unemployment rate give an outcome that negates Okun's law. The
Okun proportion is moreover subject to move from spot to put, the identical money related
procedures don't work feasibly everywhere throughout the areas and they should be united with
4 | P a g e
Paraphrase This Document
Need a fresh take? Get an instant paraphrase of this document with our AI Paraphraser
the express locale's ways to deal with acquire the perfect results. Revoredo et al. (2012) presents
three unique methods for finding the Okun's law: to find the refinement between the
unemployment rate from different areas, to find the tolerable assortment between the typical and
acquired yield and to perceive the complexity between the effect of present benefit on
joblessness and the past yield on joblessness. Patrakos et al. (2007) discovered that this law is
accessible in Malaysia anyway with the degree of - 1.75: 1 proportion which isn't exactly
equivalent to the certifiable Okun's law. Noor et al. (2007) deduced that the countries with
positive arrangement of work storing, background low dimension proportion of business GDP
association while the joblessness factor is seen to be strong in such countries. Raza's (2013)
disclosures overlay a fundamental establishment on the examination of the association between
yield advancement and joblessness. Gracer (2013) takes confidence in the validness of Okun's
law anyway not in its matchless quality and strength while Stephan (2012) agrees with Okun's
case yet finds more diminutive divisions. In light of all the above, this study therefore sought to
establish the kind of relationship that exists between the GDP growth rate and the inflation rate,
unemployment rate and GDP deflator rate for the Australian nation.
Methodology
A time series data was collected from the World Bank database to try and predict the Australian
GDP growth rate using unemployment rate, inflation rate and GDP deflator rate. The data
collected represented 38 observations as it spanned from 1980 to 2017. We employed both
descriptive and inferential statistics to analyze the relationship that exists between the four
variables. We performed Pearson correlation test and regression analysis test in an attempt to
pick out the relationship as well as the strength and direction of relationship between the
variables.
5 | P a g e
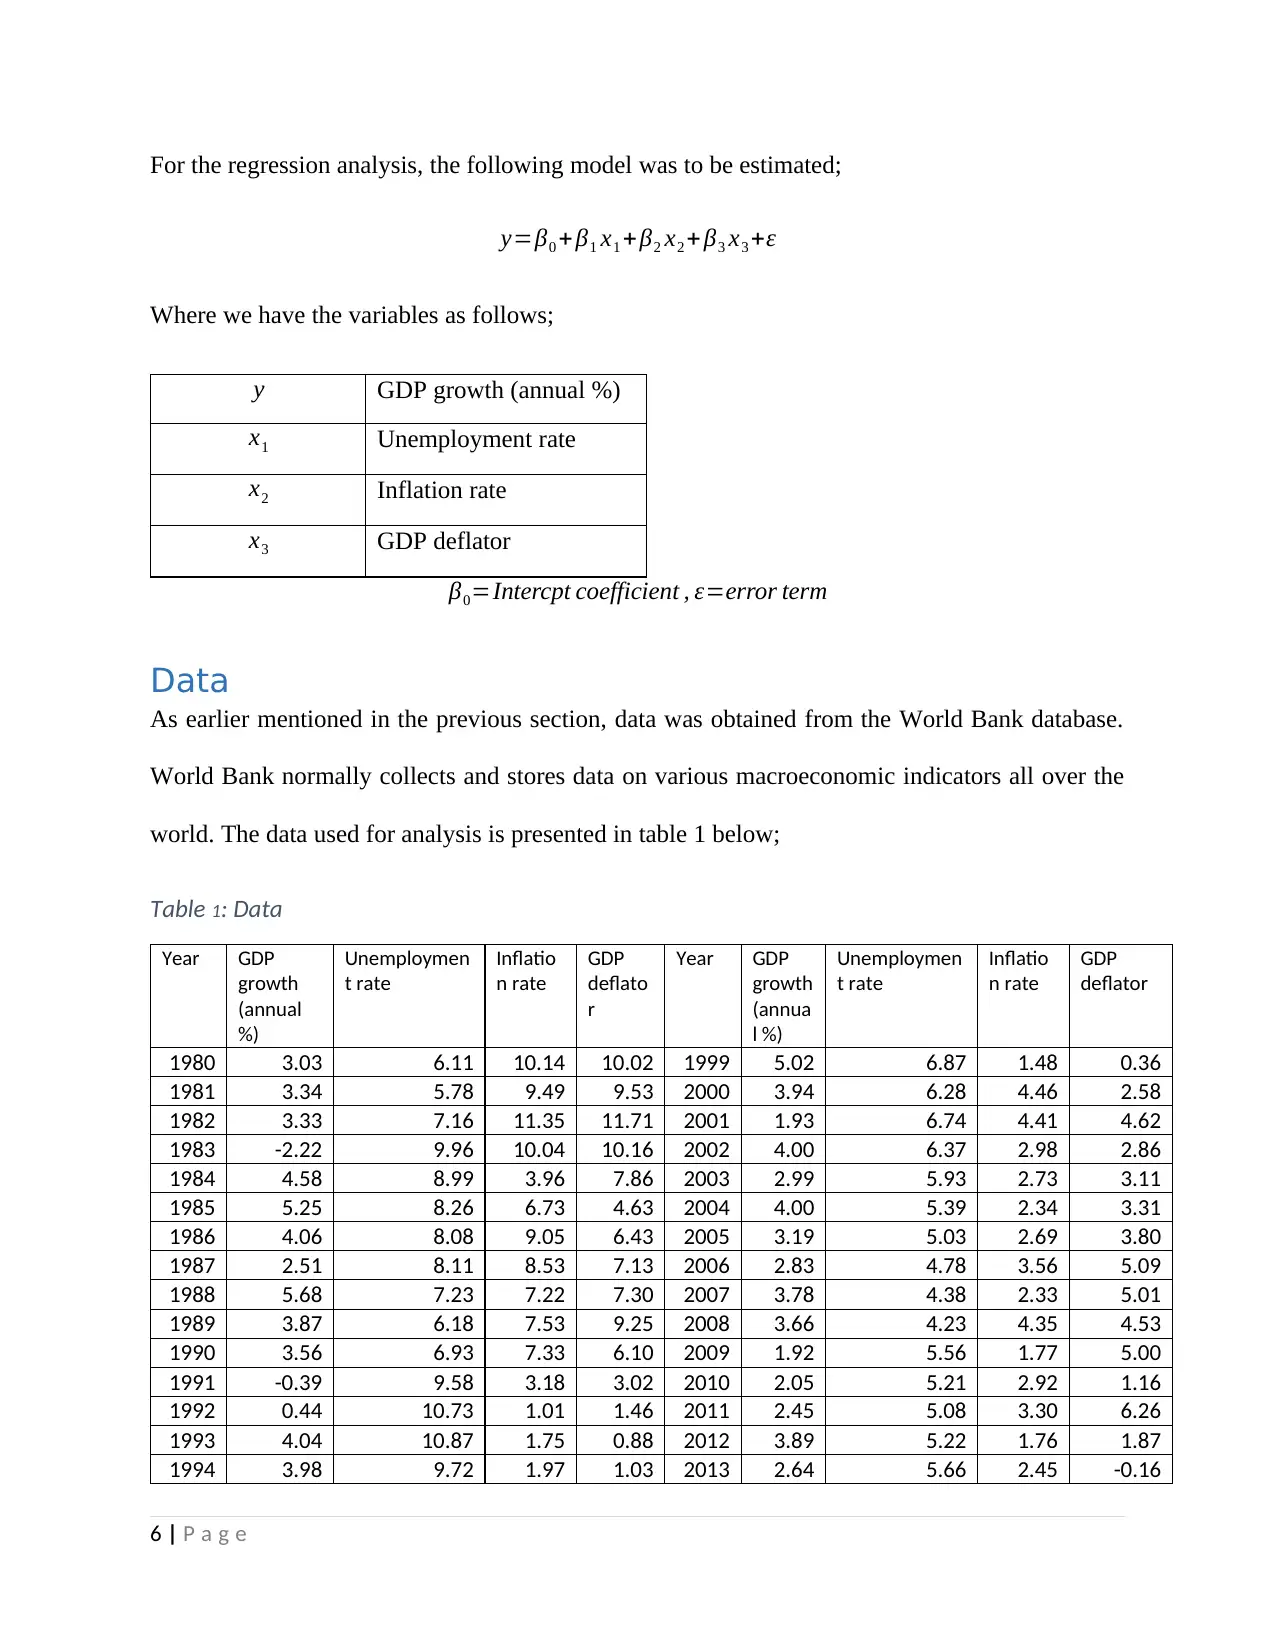
For the regression analysis, the following model was to be estimated;
y=β0 + β1 x1 +β2 x2 + β3 x3 +ε
Where we have the variables as follows;
y GDP growth (annual %)
x1 Unemployment rate
x2 Inflation rate
x3 GDP deflator
β0=Intercpt coefficient , ε=error term
Data
As earlier mentioned in the previous section, data was obtained from the World Bank database.
World Bank normally collects and stores data on various macroeconomic indicators all over the
world. The data used for analysis is presented in table 1 below;
Table 1: Data
Year GDP
growth
(annual
%)
Unemploymen
t rate
Inflatio
n rate
GDP
deflato
r
Year GDP
growth
(annua
l %)
Unemploymen
t rate
Inflatio
n rate
GDP
deflator
1980 3.03 6.11 10.14 10.02 1999 5.02 6.87 1.48 0.36
1981 3.34 5.78 9.49 9.53 2000 3.94 6.28 4.46 2.58
1982 3.33 7.16 11.35 11.71 2001 1.93 6.74 4.41 4.62
1983 -2.22 9.96 10.04 10.16 2002 4.00 6.37 2.98 2.86
1984 4.58 8.99 3.96 7.86 2003 2.99 5.93 2.73 3.11
1985 5.25 8.26 6.73 4.63 2004 4.00 5.39 2.34 3.31
1986 4.06 8.08 9.05 6.43 2005 3.19 5.03 2.69 3.80
1987 2.51 8.11 8.53 7.13 2006 2.83 4.78 3.56 5.09
1988 5.68 7.23 7.22 7.30 2007 3.78 4.38 2.33 5.01
1989 3.87 6.18 7.53 9.25 2008 3.66 4.23 4.35 4.53
1990 3.56 6.93 7.33 6.10 2009 1.92 5.56 1.77 5.00
1991 -0.39 9.58 3.18 3.02 2010 2.05 5.21 2.92 1.16
1992 0.44 10.73 1.01 1.46 2011 2.45 5.08 3.30 6.26
1993 4.04 10.87 1.75 0.88 2012 3.89 5.22 1.76 1.87
1994 3.98 9.72 1.97 1.03 2013 2.64 5.66 2.45 -0.16
6 | P a g e
⊘ This is a preview!⊘
Do you want full access?
Subscribe today to unlock all pages.
Trusted by 1+ million students worldwide
1995 3.83 8.47 4.63 2.27 2014 2.56 6.08 2.49 1.44
1996 3.88 8.51 2.62 2.70 2015 2.35 6.05 1.51 -0.73
1997 3.97 8.36 0.22 1.23 2016 2.83 5.71 1.28 -0.46
1998 4.58 7.68 0.86 1.27 2017 1.96 5.59 1.95 3.70
Data Analysis
Descriptive Statistics
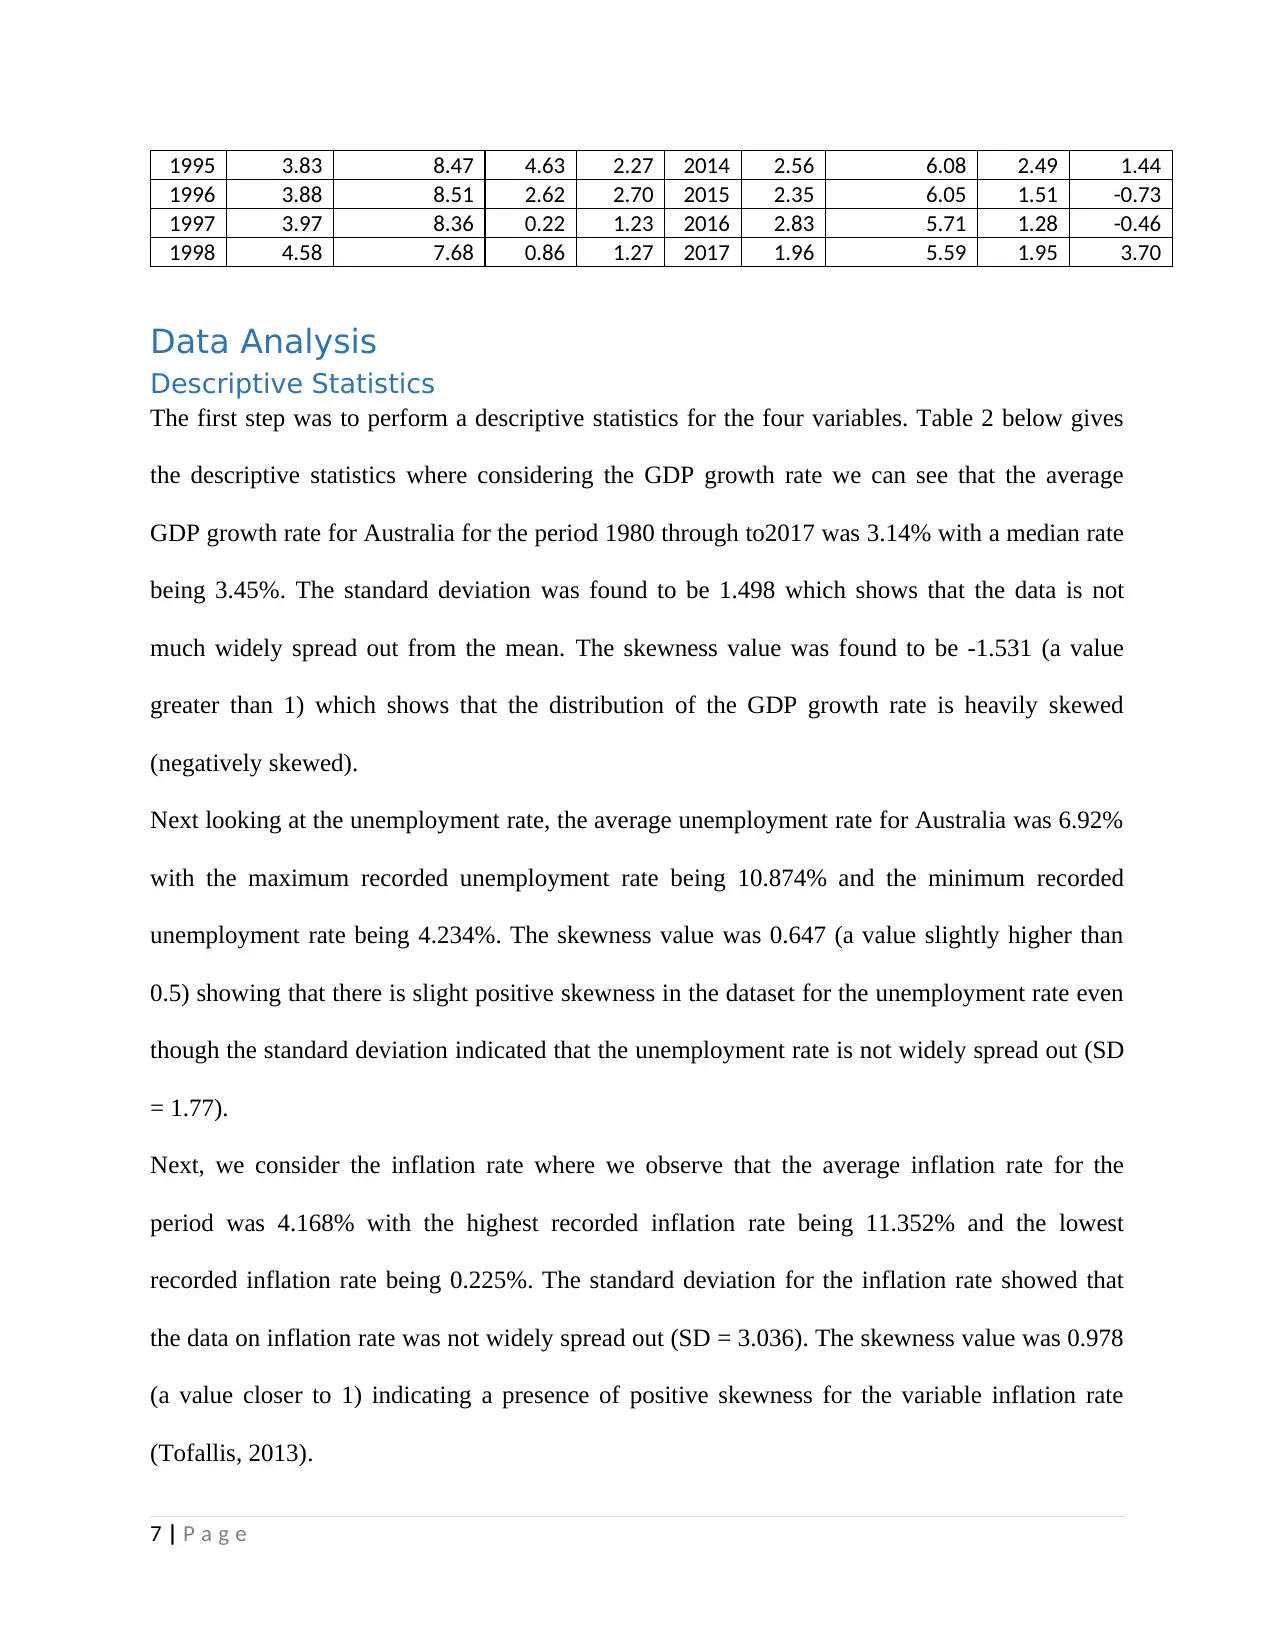
The first step was to perform a descriptive statistics for the four variables. Table 2 below gives
the descriptive statistics where considering the GDP growth rate we can see that the average
GDP growth rate for Australia for the period 1980 through to2017 was 3.14% with a median rate
being 3.45%. The standard deviation was found to be 1.498 which shows that the data is not
much widely spread out from the mean. The skewness value was found to be -1.531 (a value
greater than 1) which shows that the distribution of the GDP growth rate is heavily skewed
(negatively skewed).
Next looking at the unemployment rate, the average unemployment rate for Australia was 6.92%
with the maximum recorded unemployment rate being 10.874% and the minimum recorded
unemployment rate being 4.234%. The skewness value was 0.647 (a value slightly higher than
0.5) showing that there is slight positive skewness in the dataset for the unemployment rate even
though the standard deviation indicated that the unemployment rate is not widely spread out (SD
= 1.77).
Next, we consider the inflation rate where we observe that the average inflation rate for the
period was 4.168% with the highest recorded inflation rate being 11.352% and the lowest
recorded inflation rate being 0.225%. The standard deviation for the inflation rate showed that
the data on inflation rate was not widely spread out (SD = 3.036). The skewness value was 0.978
(a value closer to 1) indicating a presence of positive skewness for the variable inflation rate
(Tofallis, 2013).
7 | P a g e
1996 3.88 8.51 2.62 2.70 2015 2.35 6.05 1.51 -0.73
1997 3.97 8.36 0.22 1.23 2016 2.83 5.71 1.28 -0.46
1998 4.58 7.68 0.86 1.27 2017 1.96 5.59 1.95 3.70
Data Analysis
Descriptive Statistics
The first step was to perform a descriptive statistics for the four variables. Table 2 below gives
the descriptive statistics where considering the GDP growth rate we can see that the average
GDP growth rate for Australia for the period 1980 through to2017 was 3.14% with a median rate
being 3.45%. The standard deviation was found to be 1.498 which shows that the data is not
much widely spread out from the mean. The skewness value was found to be -1.531 (a value
greater than 1) which shows that the distribution of the GDP growth rate is heavily skewed
(negatively skewed).
Next looking at the unemployment rate, the average unemployment rate for Australia was 6.92%
with the maximum recorded unemployment rate being 10.874% and the minimum recorded
unemployment rate being 4.234%. The skewness value was 0.647 (a value slightly higher than
0.5) showing that there is slight positive skewness in the dataset for the unemployment rate even
though the standard deviation indicated that the unemployment rate is not widely spread out (SD
= 1.77).
Next, we consider the inflation rate where we observe that the average inflation rate for the
period was 4.168% with the highest recorded inflation rate being 11.352% and the lowest
recorded inflation rate being 0.225%. The standard deviation for the inflation rate showed that
the data on inflation rate was not widely spread out (SD = 3.036). The skewness value was 0.978
(a value closer to 1) indicating a presence of positive skewness for the variable inflation rate
(Tofallis, 2013).
7 | P a g e
Paraphrase This Document
Need a fresh take? Get an instant paraphrase of this document with our AI Paraphraser
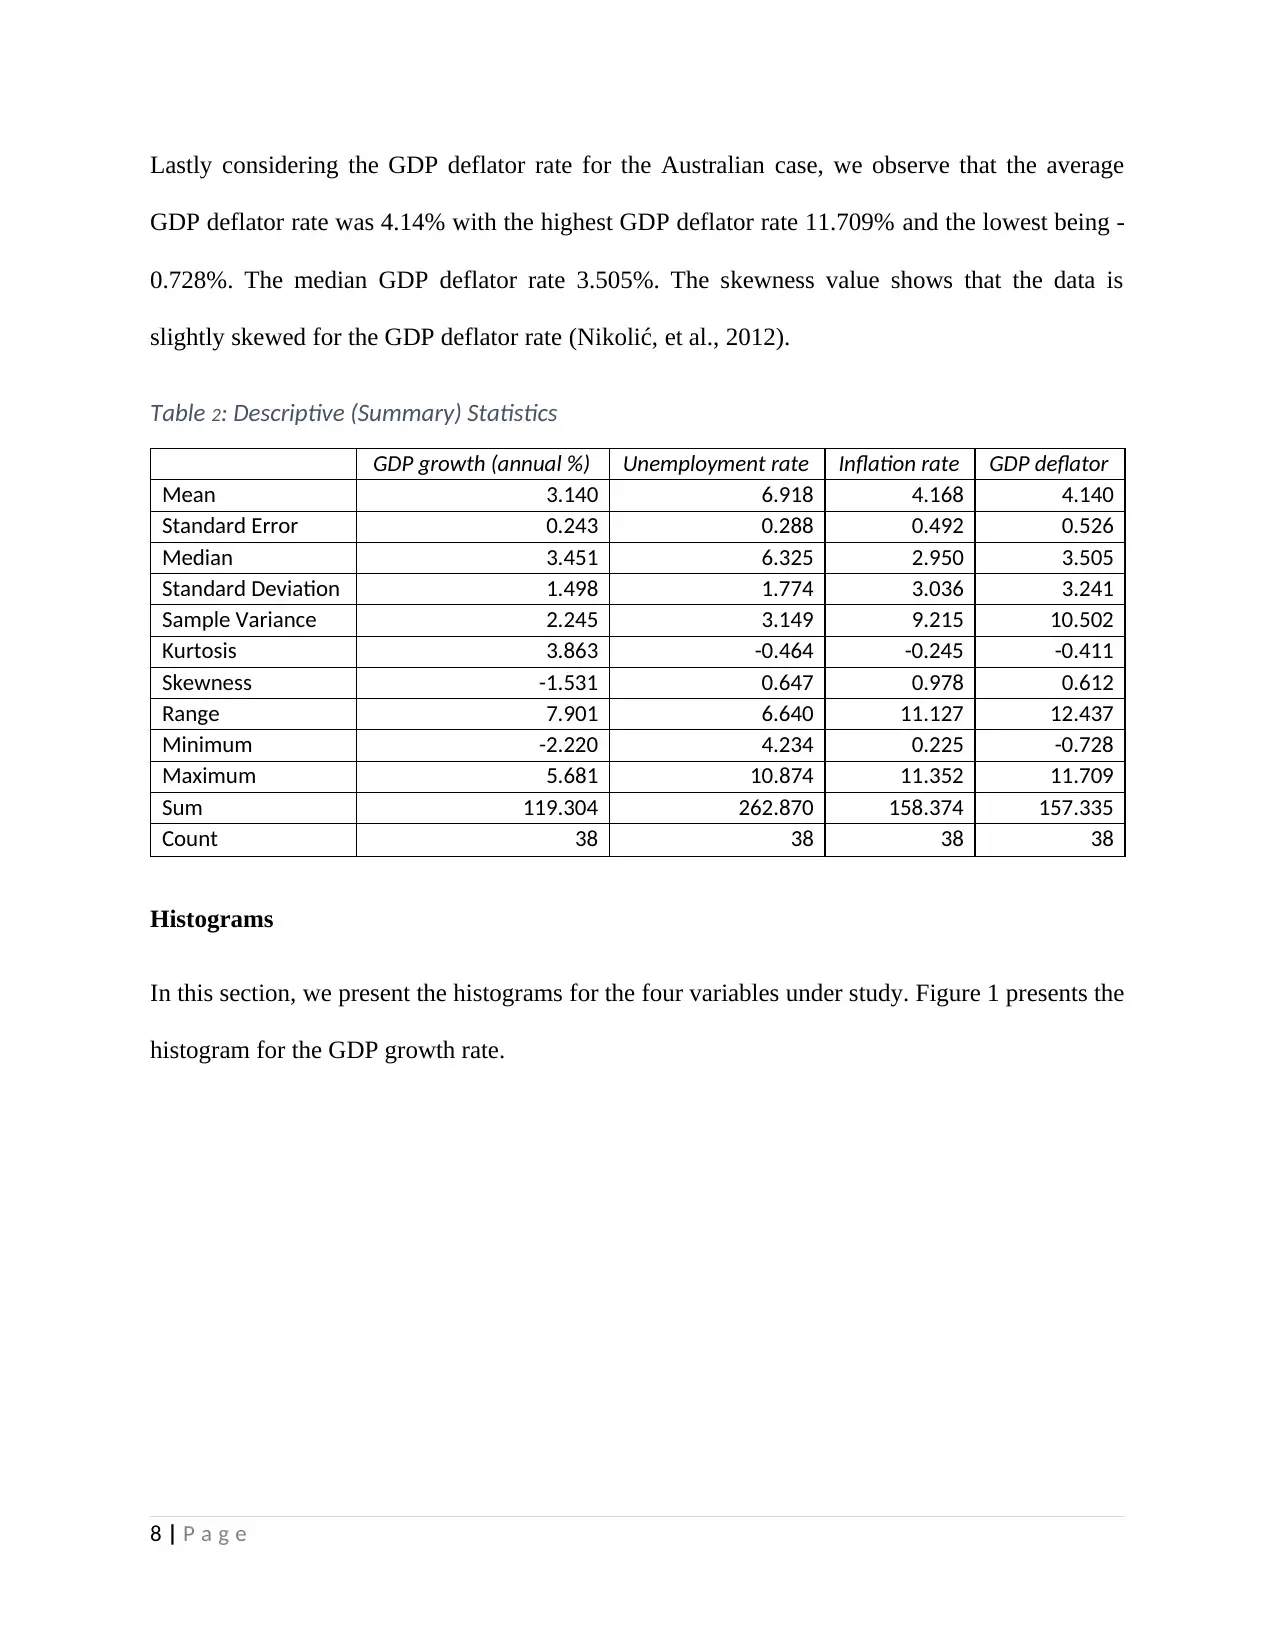
Lastly considering the GDP deflator rate for the Australian case, we observe that the average
GDP deflator rate was 4.14% with the highest GDP deflator rate 11.709% and the lowest being -
0.728%. The median GDP deflator rate 3.505%. The skewness value shows that the data is
slightly skewed for the GDP deflator rate (Nikolić, et al., 2012).
Table 2: Descriptive (Summary) Statistics
GDP growth (annual %) Unemployment rate Inflation rate GDP deflator
Mean 3.140 6.918 4.168 4.140
Standard Error 0.243 0.288 0.492 0.526
Median 3.451 6.325 2.950 3.505
Standard Deviation 1.498 1.774 3.036 3.241
Sample Variance 2.245 3.149 9.215 10.502
Kurtosis 3.863 -0.464 -0.245 -0.411
Skewness -1.531 0.647 0.978 0.612
Range 7.901 6.640 11.127 12.437
Minimum -2.220 4.234 0.225 -0.728
Maximum 5.681 10.874 11.352 11.709
Sum 119.304 262.870 158.374 157.335
Count 38 38 38 38
Histograms
In this section, we present the histograms for the four variables under study. Figure 1 presents the
histogram for the GDP growth rate.
8 | P a g e
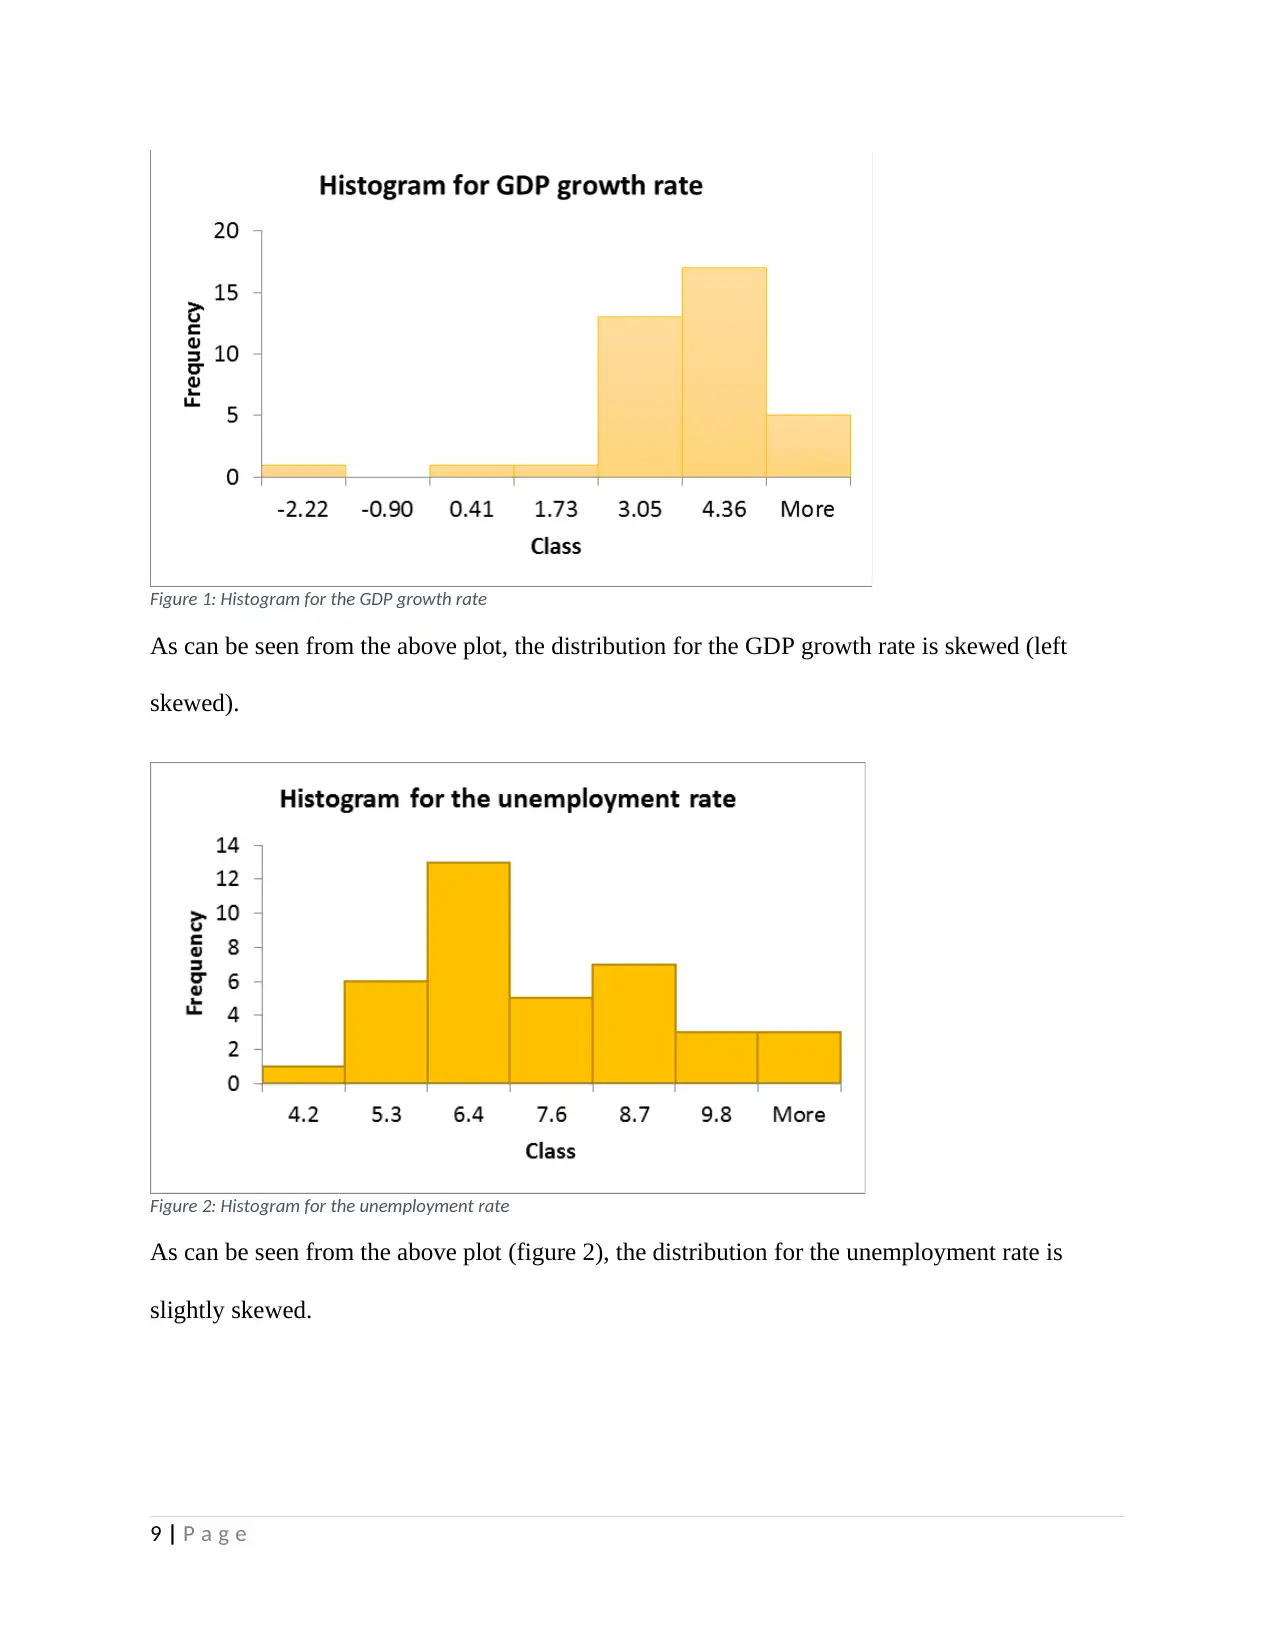
Figure 1: Histogram for the GDP growth rate
As can be seen from the above plot, the distribution for the GDP growth rate is skewed (left
skewed).
Figure 2: Histogram for the unemployment rate
As can be seen from the above plot (figure 2), the distribution for the unemployment rate is
slightly skewed.
9 | P a g e
As can be seen from the above plot, the distribution for the GDP growth rate is skewed (left
skewed).
Figure 2: Histogram for the unemployment rate
As can be seen from the above plot (figure 2), the distribution for the unemployment rate is
slightly skewed.
9 | P a g e
⊘ This is a preview!⊘
Do you want full access?
Subscribe today to unlock all pages.
Trusted by 1+ million students worldwide
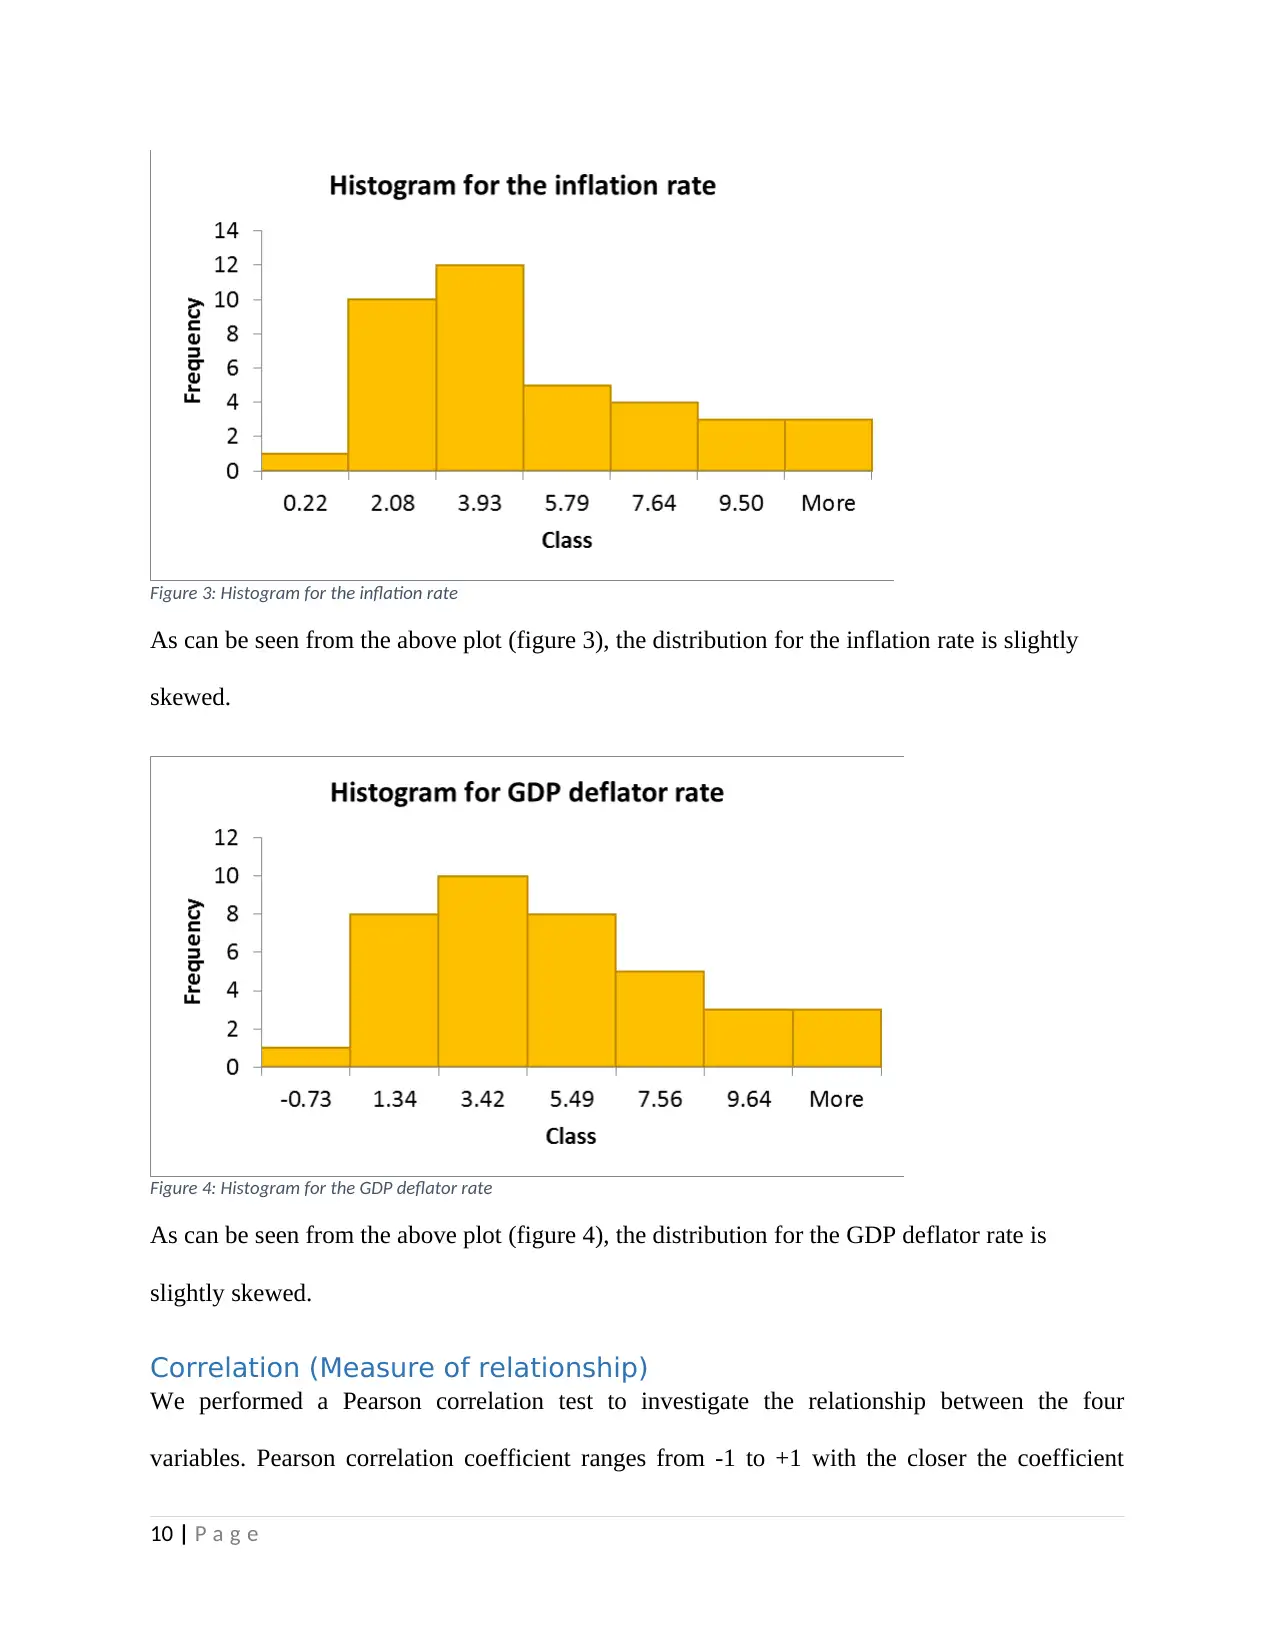
Figure 3: Histogram for the inflation rate
As can be seen from the above plot (figure 3), the distribution for the inflation rate is slightly
skewed.
Figure 4: Histogram for the GDP deflator rate
As can be seen from the above plot (figure 4), the distribution for the GDP deflator rate is
slightly skewed.
Correlation (Measure of relationship)
We performed a Pearson correlation test to investigate the relationship between the four
variables. Pearson correlation coefficient ranges from -1 to +1 with the closer the coefficient
10 | P a g e
Paraphrase This Document
Need a fresh take? Get an instant paraphrase of this document with our AI Paraphraser
value is to the extreme ends, the stronger the relationship (Schouhamer & Weber , 2010). A
negative Pearson correlation value shows that a negative relationship exists between the two
variables while on the other hand a positive Pearson correlation value shows that a positive
relationship exists between the two variables (Boddy & Smith, 2009). Results are given in table
5 below.
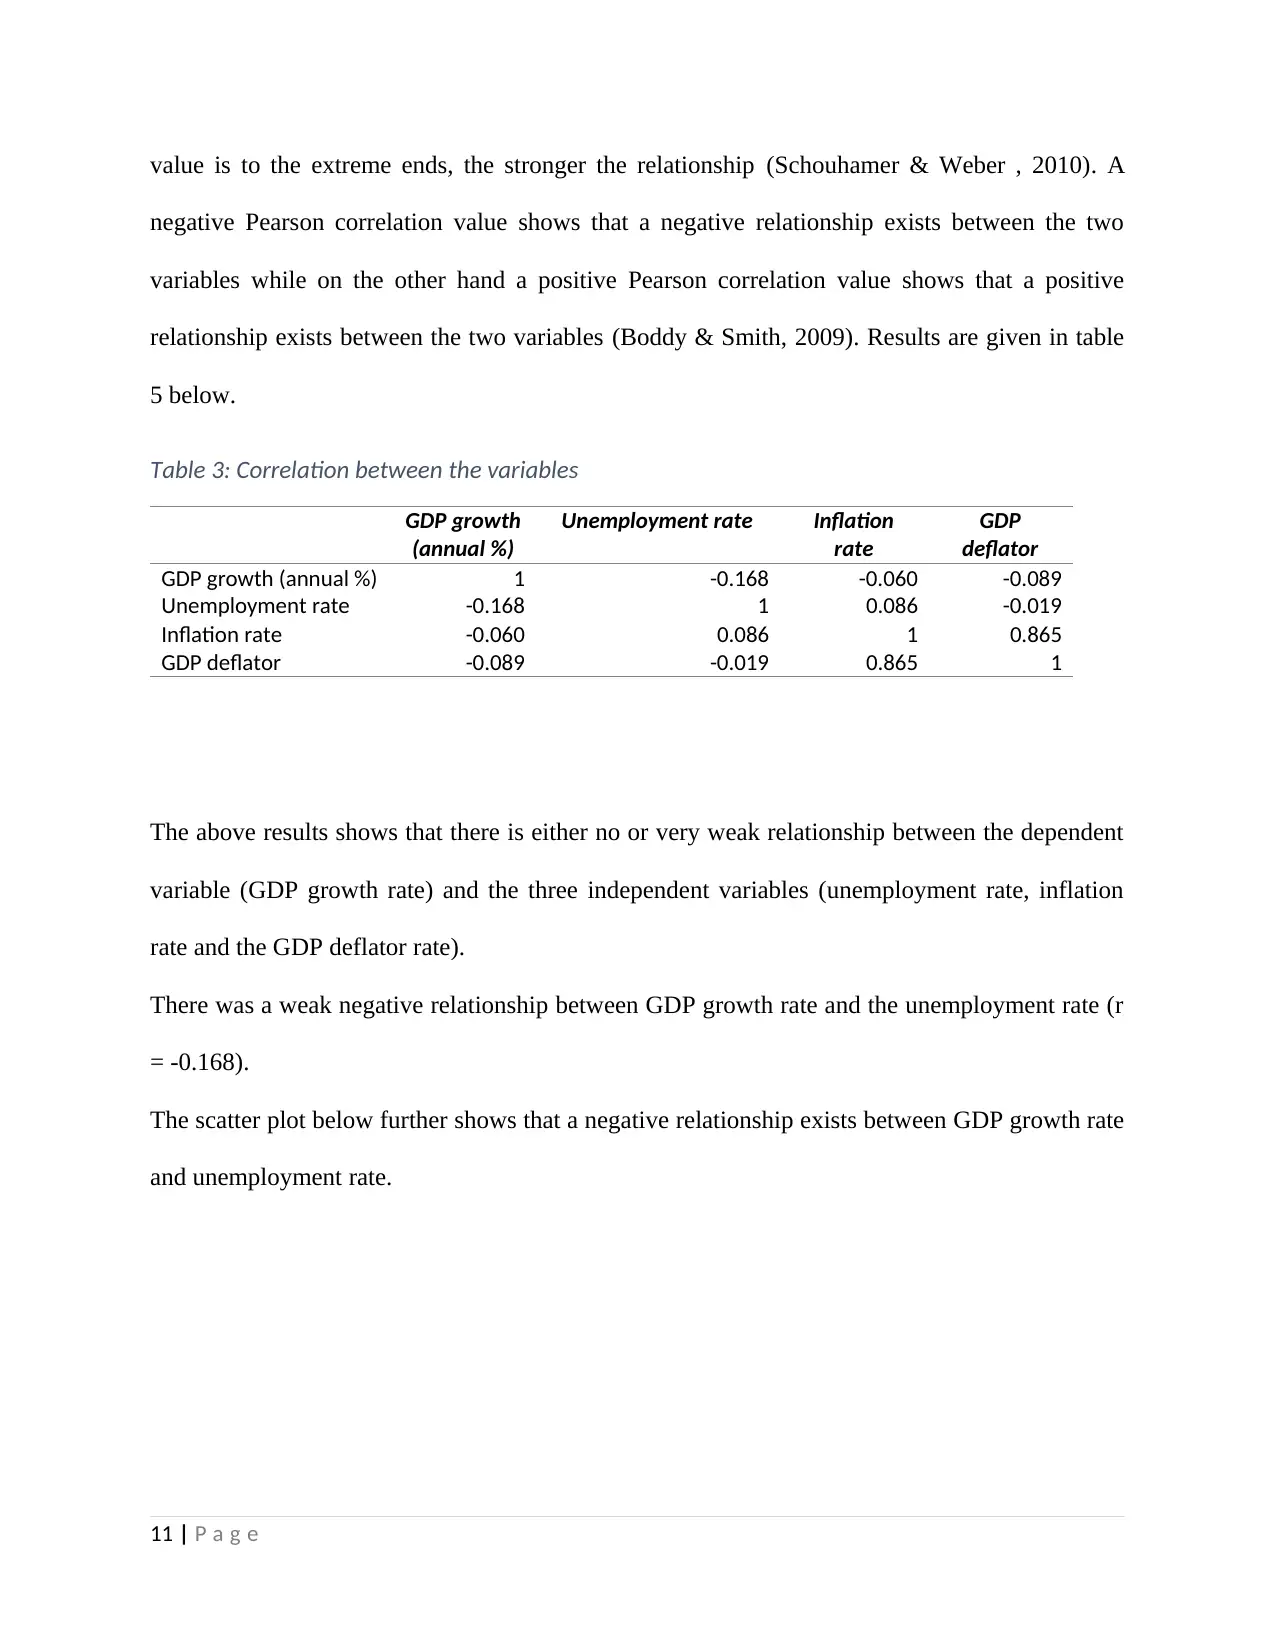
Table 3: Correlation between the variables
GDP growth
(annual %)
Unemployment rate Inflation
rate
GDP
deflator
GDP growth (annual %) 1 -0.168 -0.060 -0.089
Unemployment rate -0.168 1 0.086 -0.019
Inflation rate -0.060 0.086 1 0.865
GDP deflator -0.089 -0.019 0.865 1
The above results shows that there is either no or very weak relationship between the dependent
variable (GDP growth rate) and the three independent variables (unemployment rate, inflation
rate and the GDP deflator rate).
There was a weak negative relationship between GDP growth rate and the unemployment rate (r
= -0.168).
The scatter plot below further shows that a negative relationship exists between GDP growth rate
and unemployment rate.
11 | P a g e
negative Pearson correlation value shows that a negative relationship exists between the two
variables while on the other hand a positive Pearson correlation value shows that a positive
relationship exists between the two variables (Boddy & Smith, 2009). Results are given in table
5 below.
Table 3: Correlation between the variables
GDP growth
(annual %)
Unemployment rate Inflation
rate
GDP
deflator
GDP growth (annual %) 1 -0.168 -0.060 -0.089
Unemployment rate -0.168 1 0.086 -0.019
Inflation rate -0.060 0.086 1 0.865
GDP deflator -0.089 -0.019 0.865 1
The above results shows that there is either no or very weak relationship between the dependent
variable (GDP growth rate) and the three independent variables (unemployment rate, inflation
rate and the GDP deflator rate).
There was a weak negative relationship between GDP growth rate and the unemployment rate (r
= -0.168).
The scatter plot below further shows that a negative relationship exists between GDP growth rate
and unemployment rate.
11 | P a g e
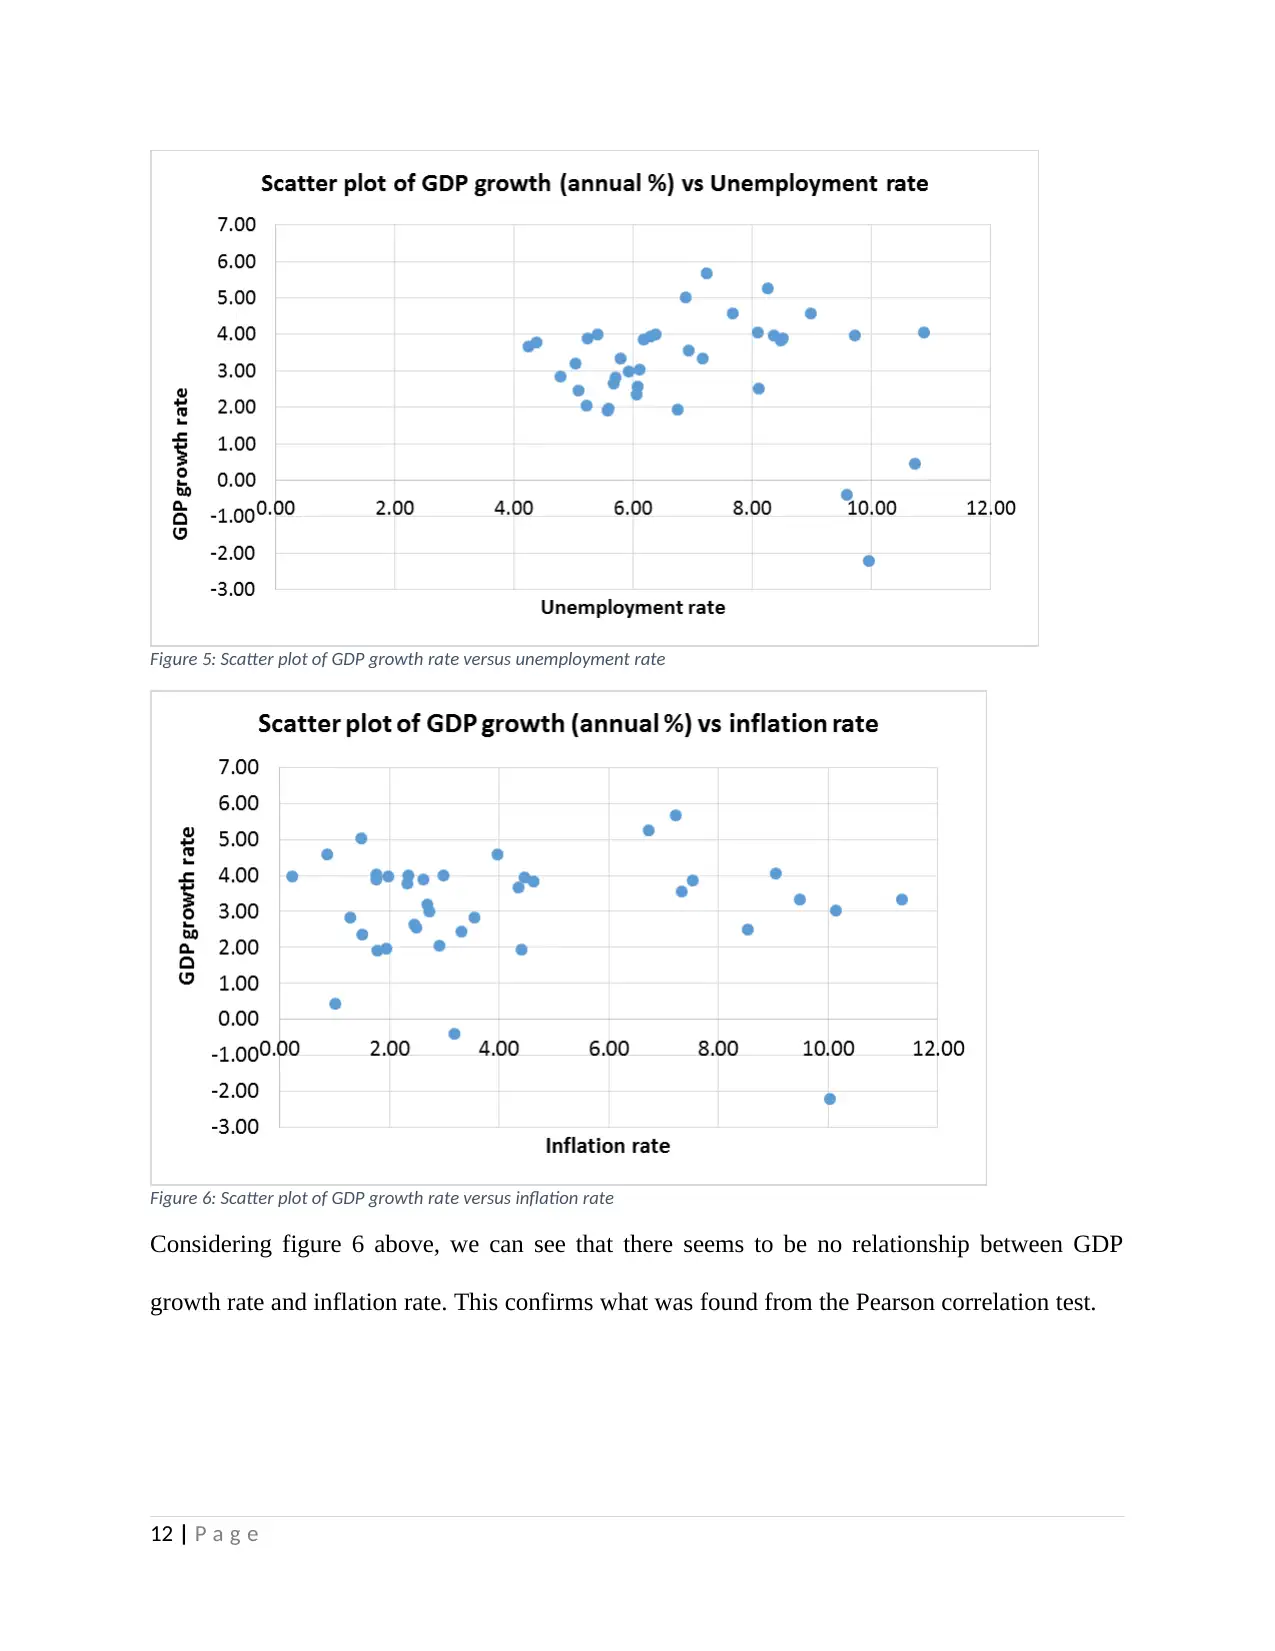
Figure 5: Scatter plot of GDP growth rate versus unemployment rate
Figure 6: Scatter plot of GDP growth rate versus inflation rate
Considering figure 6 above, we can see that there seems to be no relationship between GDP
growth rate and inflation rate. This confirms what was found from the Pearson correlation test.
12 | P a g e
Figure 6: Scatter plot of GDP growth rate versus inflation rate
Considering figure 6 above, we can see that there seems to be no relationship between GDP
growth rate and inflation rate. This confirms what was found from the Pearson correlation test.
12 | P a g e
⊘ This is a preview!⊘
Do you want full access?
Subscribe today to unlock all pages.
Trusted by 1+ million students worldwide
1 out of 16
Related Documents


Your All-in-One AI-Powered Toolkit for Academic Success.
+13062052269
info@desklib.com
Available 24*7 on WhatsApp / Email
![[object Object]](/_next/static/media/star-bottom.7253800d.svg)
Unlock your academic potential
Copyright © 2020–2026 A2Z Services. All Rights Reserved. Developed and managed by ZUCOL.