Using Regression to Predict Success in Accelerated Self-Study

Verified

Added on  2023/06/13

|8
|1241
|371
Report
AI Summary
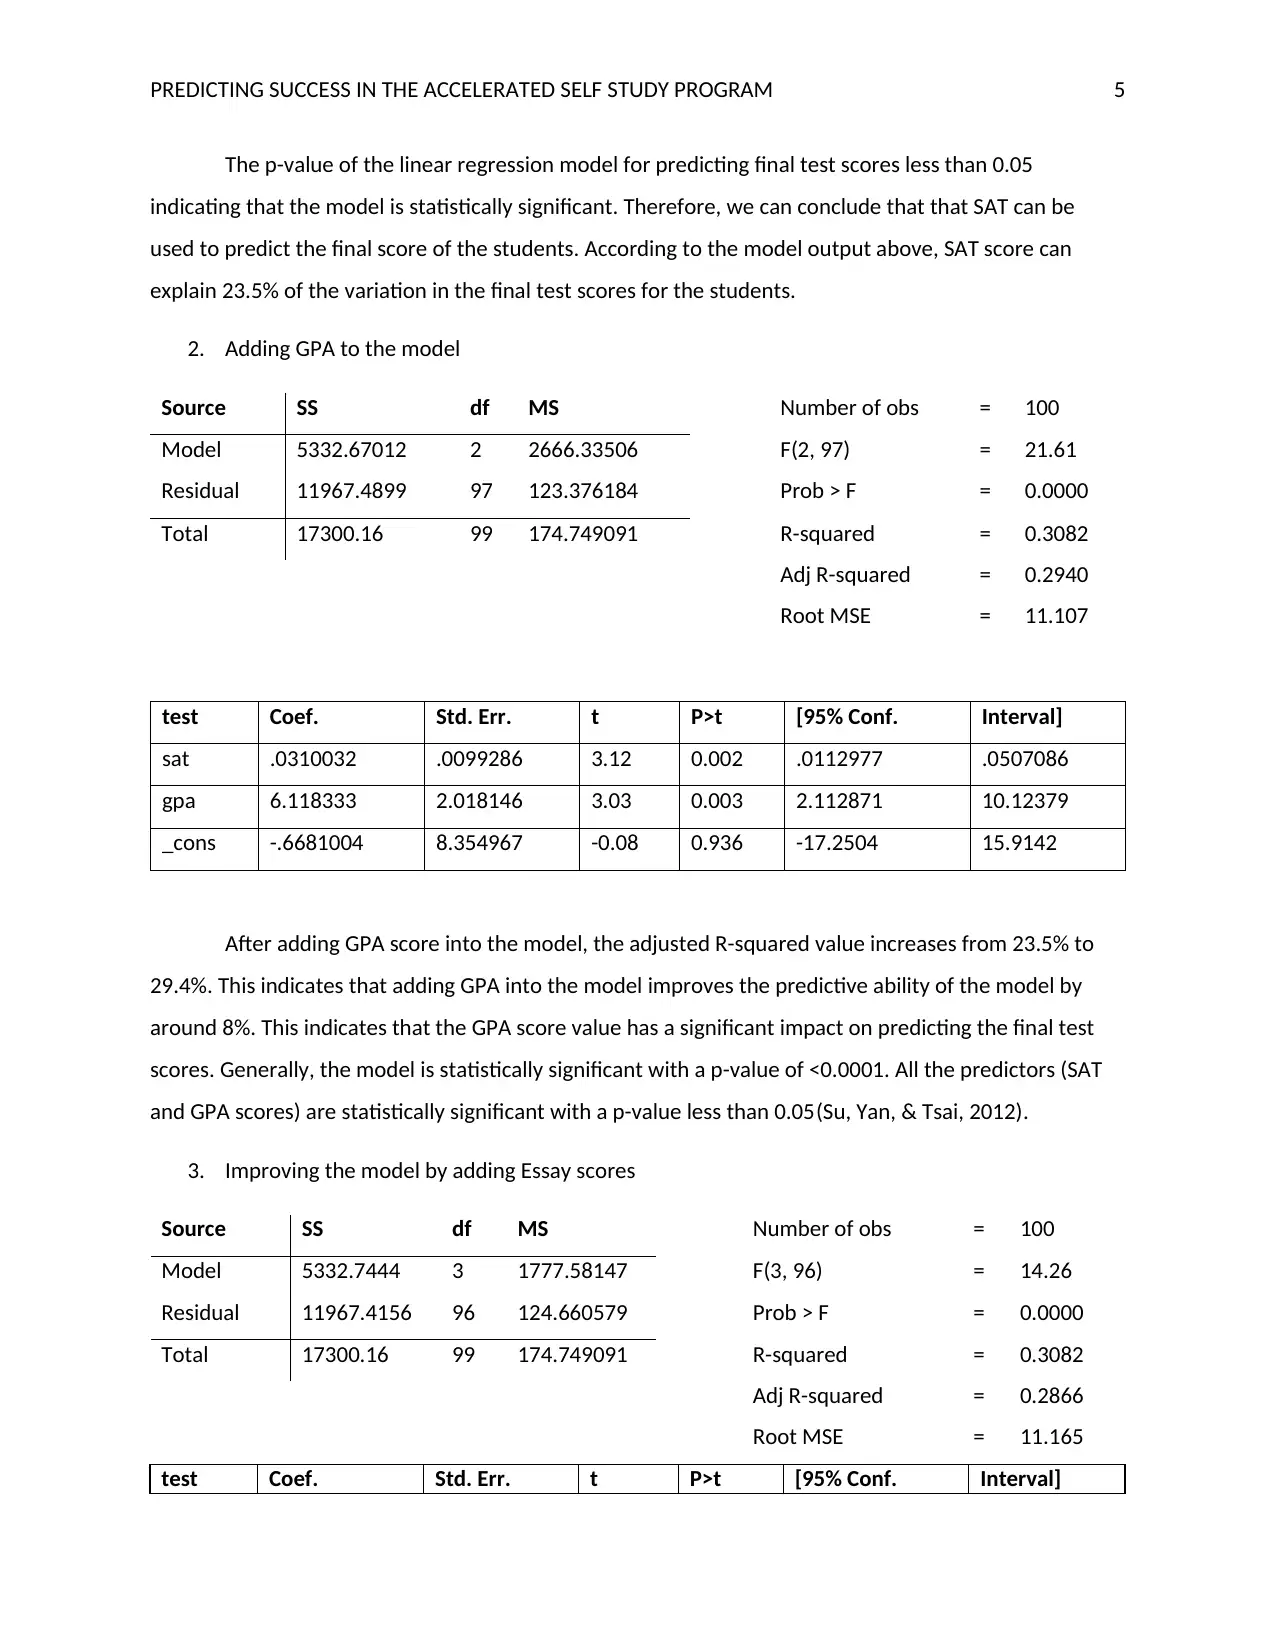
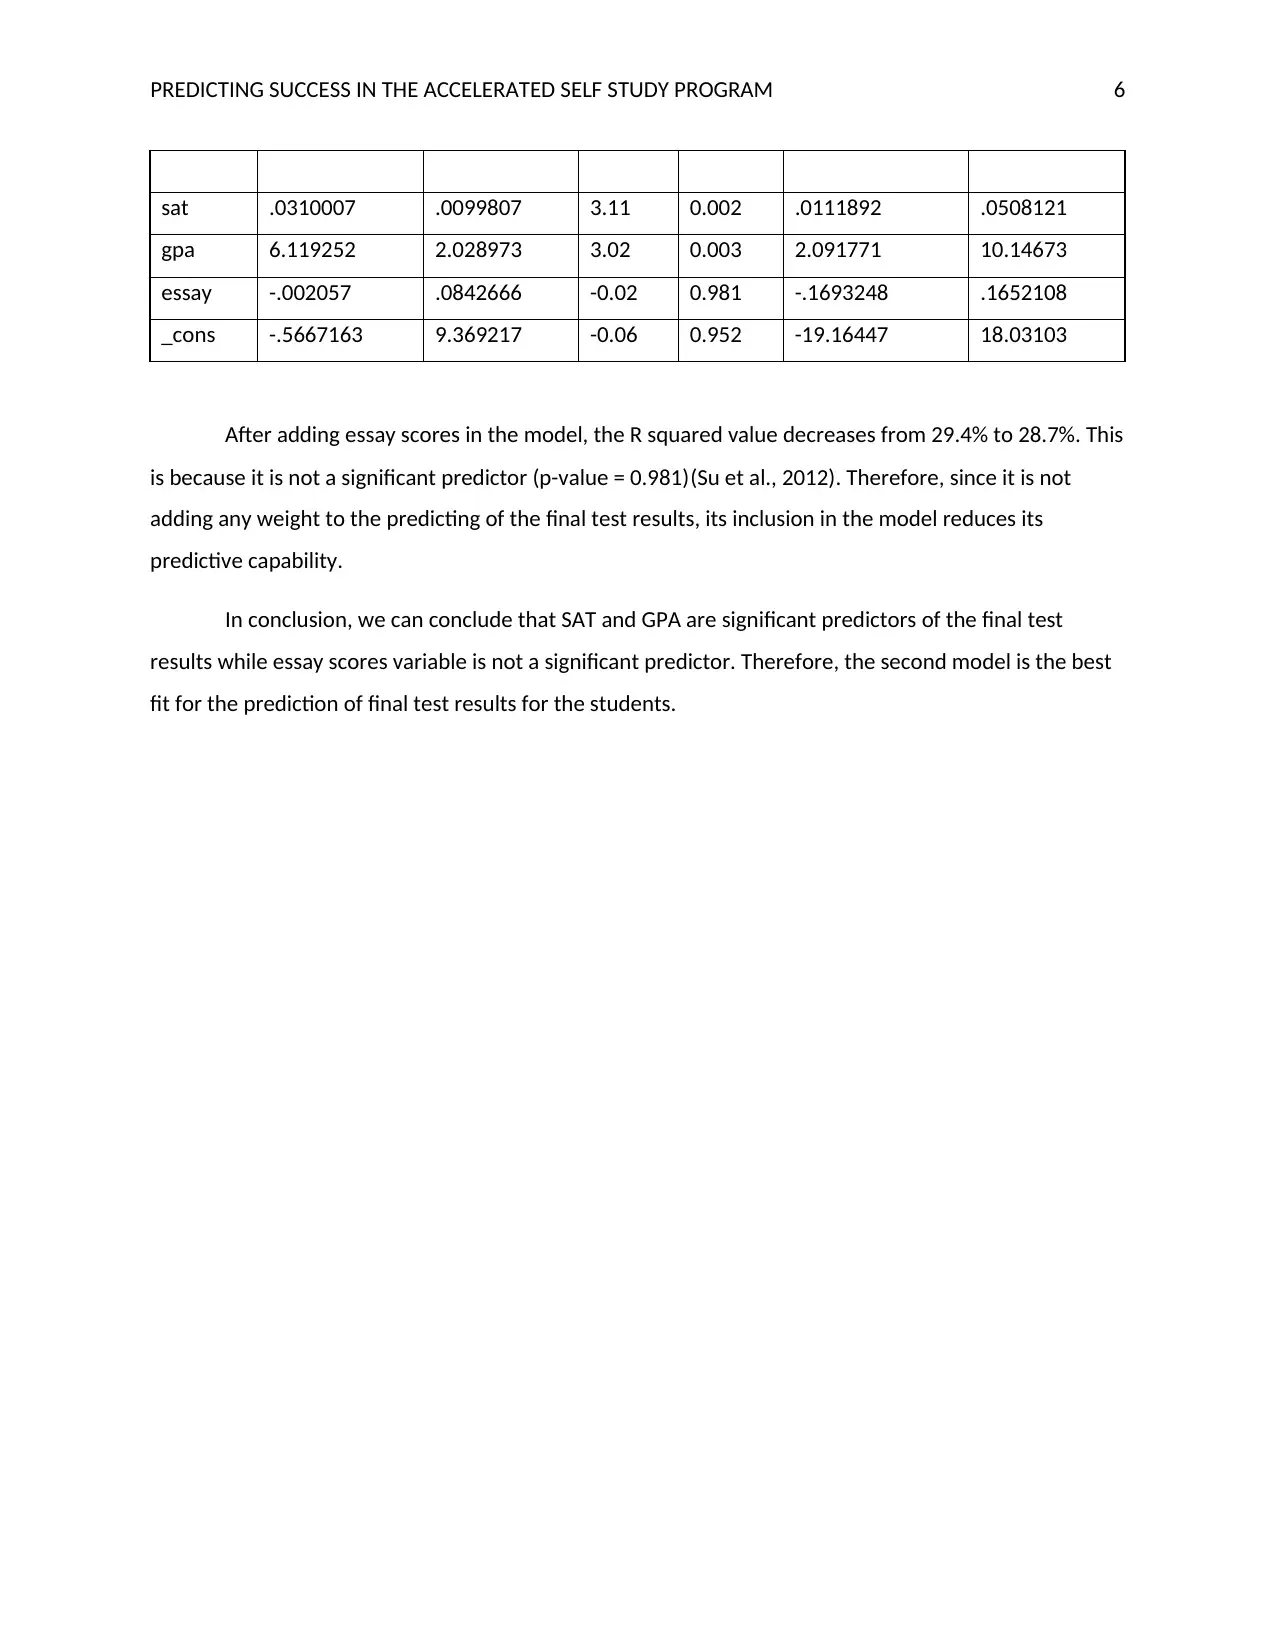
This report investigates the prediction of student success in an accelerated self-study program using descriptive statistics and regression analysis. The analysis includes variables such as SAT scores, GPA, and essay scores to determine their predictive power on final test results. Descriptive statistics provide an overview of the data, including means and standard deviations for each variable. Scatter plots illustrate the relationships between the test scores and the predictor variables. Regression outputs are presented for three models: one using SAT scores as the only predictor, another adding GPA, and a third including essay scores. The adjusted R-squared values are compared to assess the improvement in predictive ability with each added variable. The findings indicate that SAT scores and GPA are significant predictors of final test results, while essay scores are not. The report concludes that a model including both SAT and GPA provides the best fit for predicting student performance in the accelerated self-study program.
Document Page
Running head: PREDICTING SUCCESS IN THE ACCELERATED SELF STUDY PROGRAM
Predicting Success in the Accelerated Self Study Program
Name
Course Number
Date
Faculty Name
tabler-icon-diamond-filled.svg

Paraphrase This Document

Need a fresh take? Get an instant paraphrase of this document with our AI Paraphraser
Document Page
PREDICTING SUCCESS IN THE ACCELERATED SELF STUDY PROGRAM 2
Predicting Success in the Accelerated Self Study Program
Descriptive statistics
Variable Obs Mean Std. Dev. Min Max
test 100 47.72 13.21927 19 87
sat 100 1008.2 135.9172 730 1400
gpa 100 2.7999 .6686659 1.4 4
essay 100 49.32 13.31884 22 79
On average, the students scored 47.42 on their final test with the last student scoring 19% and
87% for the best. Based on official records, the students had an average score of 1008.2 for SAT scores
with a standard deviation of 135.92. The lowest score to SAT score was 730 and a maximum of 1400.
From a sample of 100 participants, the best-performed students from the high school results had a GPA
of 4 and the poorest performer has a GPA score of 1.4 with an average of 2.8. the essay performance
had an average score of 49.32with a standard deviation of 13.32.
0 . 0 1 . 0 2 . 0 3 . 0 4
D e n s i t y
20 40 60 80 100
Test
Histogram of Performance
Figure 1: Histogram of students' performance
The test marks are approximately normally distributed with a mean of 47.72% and a standard
deviation of 13.22. This can be affirmed by the histogram in figure one. Therefore, we can model the
Document Page
PREDICTING SUCCESS IN THE ACCELERATED SELF STUDY PROGRAM 3
test results using linear regression because the normally has been achieved(Tsokos, Wooten, Tsokos, &
Wooten, 2016).
Scatter Plots
2 0 4 0 6 0 8 0 1 0 0
600 800 1000 1200 1400
SAT
Test Fitted values
Scatter plot of Test by SAT
Figure 2: A scatter plot of SAT by Test
According to figure 2 above, there is a positive correlation between SAT and Test scores.
2 0 4 0 6 0 8 0 1 0 0
1.5 2 2.5 3 3.5 4
GPA
Test Fitted values
Scatter plot of Test by GPA
Figure 3: Scatter plot of Test by GPA
Document Page
PREDICTING SUCCESS IN THE ACCELERATED SELF STUDY PROGRAM 4
2 0 4 0 6 0 8 0 1 0 0
20 40 60 80
Essay
Test Fitted values
Scatter plot of Test by Essay scores
Figure 4: Scatter plot of test scores by Essay scores
According to figure 4 above, we can conclude that linear fitted values might not be sufficient to predict
the final performance of the students(Sainani, 2013).
Regression outputs
1. SAT as the only predictor of final test scores
Source SS df MS Number of obs = 100
Model 4198.72468 1 4198.72468 F(1, 98) = 31.41
Residual 13101.4353 98 133.688116 Prob > F = 0.0000
Total 17300.16 99 174.749091 R-squared = 0.2427
Adj R-squared = 0.2350
Root MSE = 11.562
test Coef. Std. Err. t P>t [95% Conf. Interval]
sat .0479145 .0085498 5.60 0.000 .0309477 .0648812
_cons -.5873553 8.697076 -0.07 0.946 -17.84642 16.67171
tabler-icon-diamond-filled.svg

Paraphrase This Document

Need a fresh take? Get an instant paraphrase of this document with our AI Paraphraser
Document Page
PREDICTING SUCCESS IN THE ACCELERATED SELF STUDY PROGRAM 5
The p-value of the linear regression model for predicting final test scores less than 0.05
indicating that the model is statistically significant. Therefore, we can conclude that that SAT can be
used to predict the final score of the students. According to the model output above, SAT score can
explain 23.5% of the variation in the final test scores for the students.
2. Adding GPA to the model
Source SS df MS Number of obs = 100
Model 5332.67012 2 2666.33506 F(2, 97) = 21.61
Residual 11967.4899 97 123.376184 Prob > F = 0.0000
Total 17300.16 99 174.749091 R-squared = 0.3082
Adj R-squared = 0.2940
Root MSE = 11.107
test Coef. Std. Err. t P>t [95% Conf. Interval]
sat .0310032 .0099286 3.12 0.002 .0112977 .0507086
gpa 6.118333 2.018146 3.03 0.003 2.112871 10.12379
_cons -.6681004 8.354967 -0.08 0.936 -17.2504 15.9142
After adding GPA score into the model, the adjusted R-squared value increases from 23.5% to
29.4%. This indicates that adding GPA into the model improves the predictive ability of the model by
around 8%. This indicates that the GPA score value has a significant impact on predicting the final test
scores. Generally, the model is statistically significant with a p-value of <0.0001. All the predictors (SAT
and GPA scores) are statistically significant with a p-value less than 0.05(Su, Yan, & Tsai, 2012).
3. Improving the model by adding Essay scores
Source SS df MS Number of obs = 100
Model 5332.7444 3 1777.58147 F(3, 96) = 14.26
Residual 11967.4156 96 124.660579 Prob > F = 0.0000
Total 17300.16 99 174.749091 R-squared = 0.3082
Adj R-squared = 0.2866
Root MSE = 11.165
test Coef. Std. Err. t P>t [95% Conf. Interval]
Document Page
PREDICTING SUCCESS IN THE ACCELERATED SELF STUDY PROGRAM 6
sat .0310007 .0099807 3.11 0.002 .0111892 .0508121
gpa 6.119252 2.028973 3.02 0.003 2.091771 10.14673
essay -.002057 .0842666 -0.02 0.981 -.1693248 .1652108
_cons -.5667163 9.369217 -0.06 0.952 -19.16447 18.03103
After adding essay scores in the model, the R squared value decreases from 29.4% to 28.7%. This
is because it is not a significant predictor (p-value = 0.981)(Su et al., 2012). Therefore, since it is not
adding any weight to the predicting of the final test results, its inclusion in the model reduces its
predictive capability.
In conclusion, we can conclude that SAT and GPA are significant predictors of the final test
results while essay scores variable is not a significant predictor. Therefore, the second model is the best
fit for the prediction of final test results for the students.
Document Page
PREDICTING SUCCESS IN THE ACCELERATED SELF STUDY PROGRAM 7
References
Sainani, K. L. (2013). Understanding linear regression. PM and R, 5(12), 1063–1068.
https://doi.org/10.1016/j.pmrj.2013.10.002
Su, X., Yan, X., & Tsai, C.-L. (2012). Linear regression. Wiley Interdisciplinary Reviews: Computational
Statistics, 4(3), 275–294. https://doi.org/10.1002/wics.1198
Tsokos, C., Wooten, R., Tsokos, C., & Wooten, R. (2016). Normal Probability. In The Joy of Finite
Mathematics (pp. 231–263). https://doi.org/10.1016/B978-0-12-802967-1.00007-3
tabler-icon-diamond-filled.svg

Paraphrase This Document

Need a fresh take? Get an instant paraphrase of this document with our AI Paraphraser
Document Page
PREDICTING SUCCESS IN THE ACCELERATED SELF STUDY PROGRAM 8
Appendix: Stata Code
import delimited C:\Users\John\Documents\selfstudy.csv
describe test sat gpa essay
summ test sat gpa essay
graph box test
twoway (scatter test sat) (lfit test sat), title("Scatter plot of Test by SAT")
twoway (scatter test gpa) (lfit test gpa), title("Scatter plot of Test by GPA")
twoway (scatter test essay) (lfit test essay), title("Scatter plot of Test by Essay scores")
reg test sat
reg test sat gpa
reg test sat gpa essay
chevron_up_icon
1 out of 8
circle_padding
hide_on_mobile
zoom_out_icon
[object Object]