MIS772: Predictive Analysis of Airline Recommendations Report

Verified

Added on  2023/06/14

|16
|1535
|365
Report
AI Summary
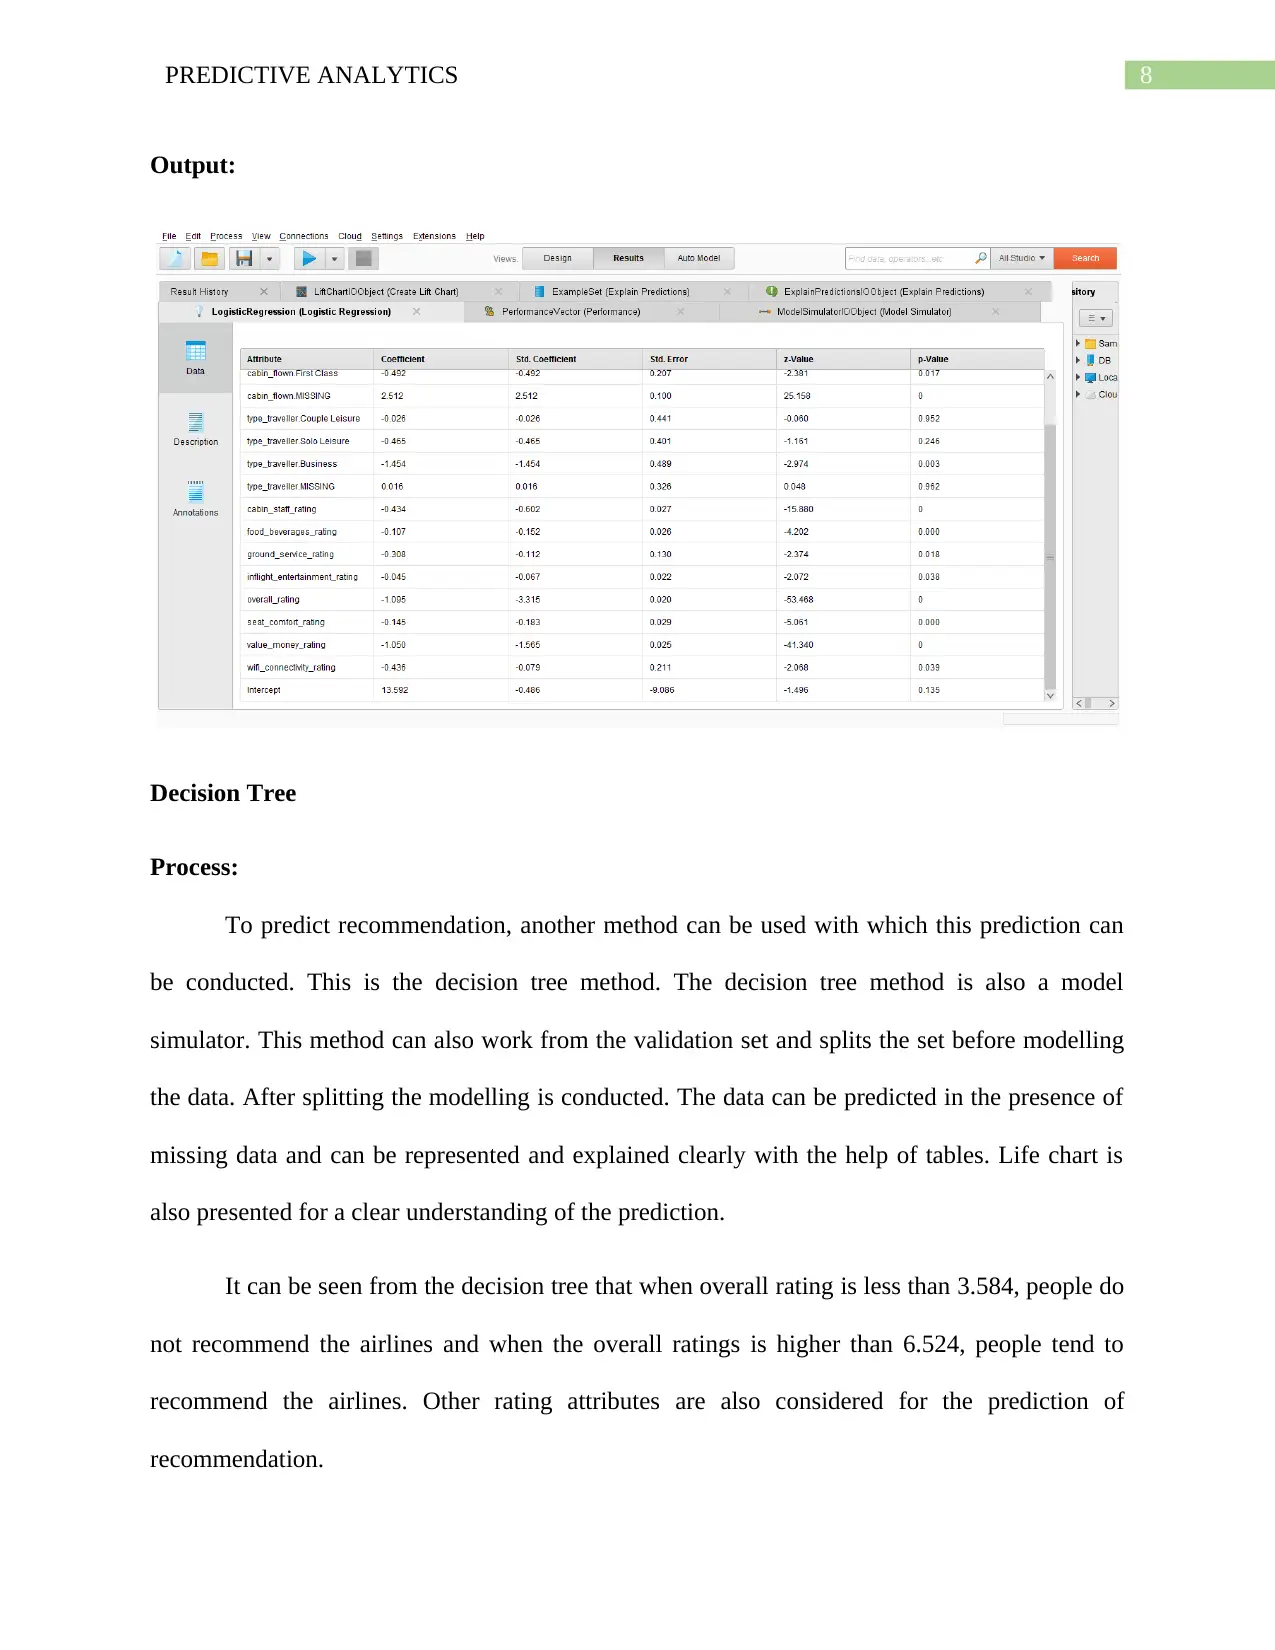
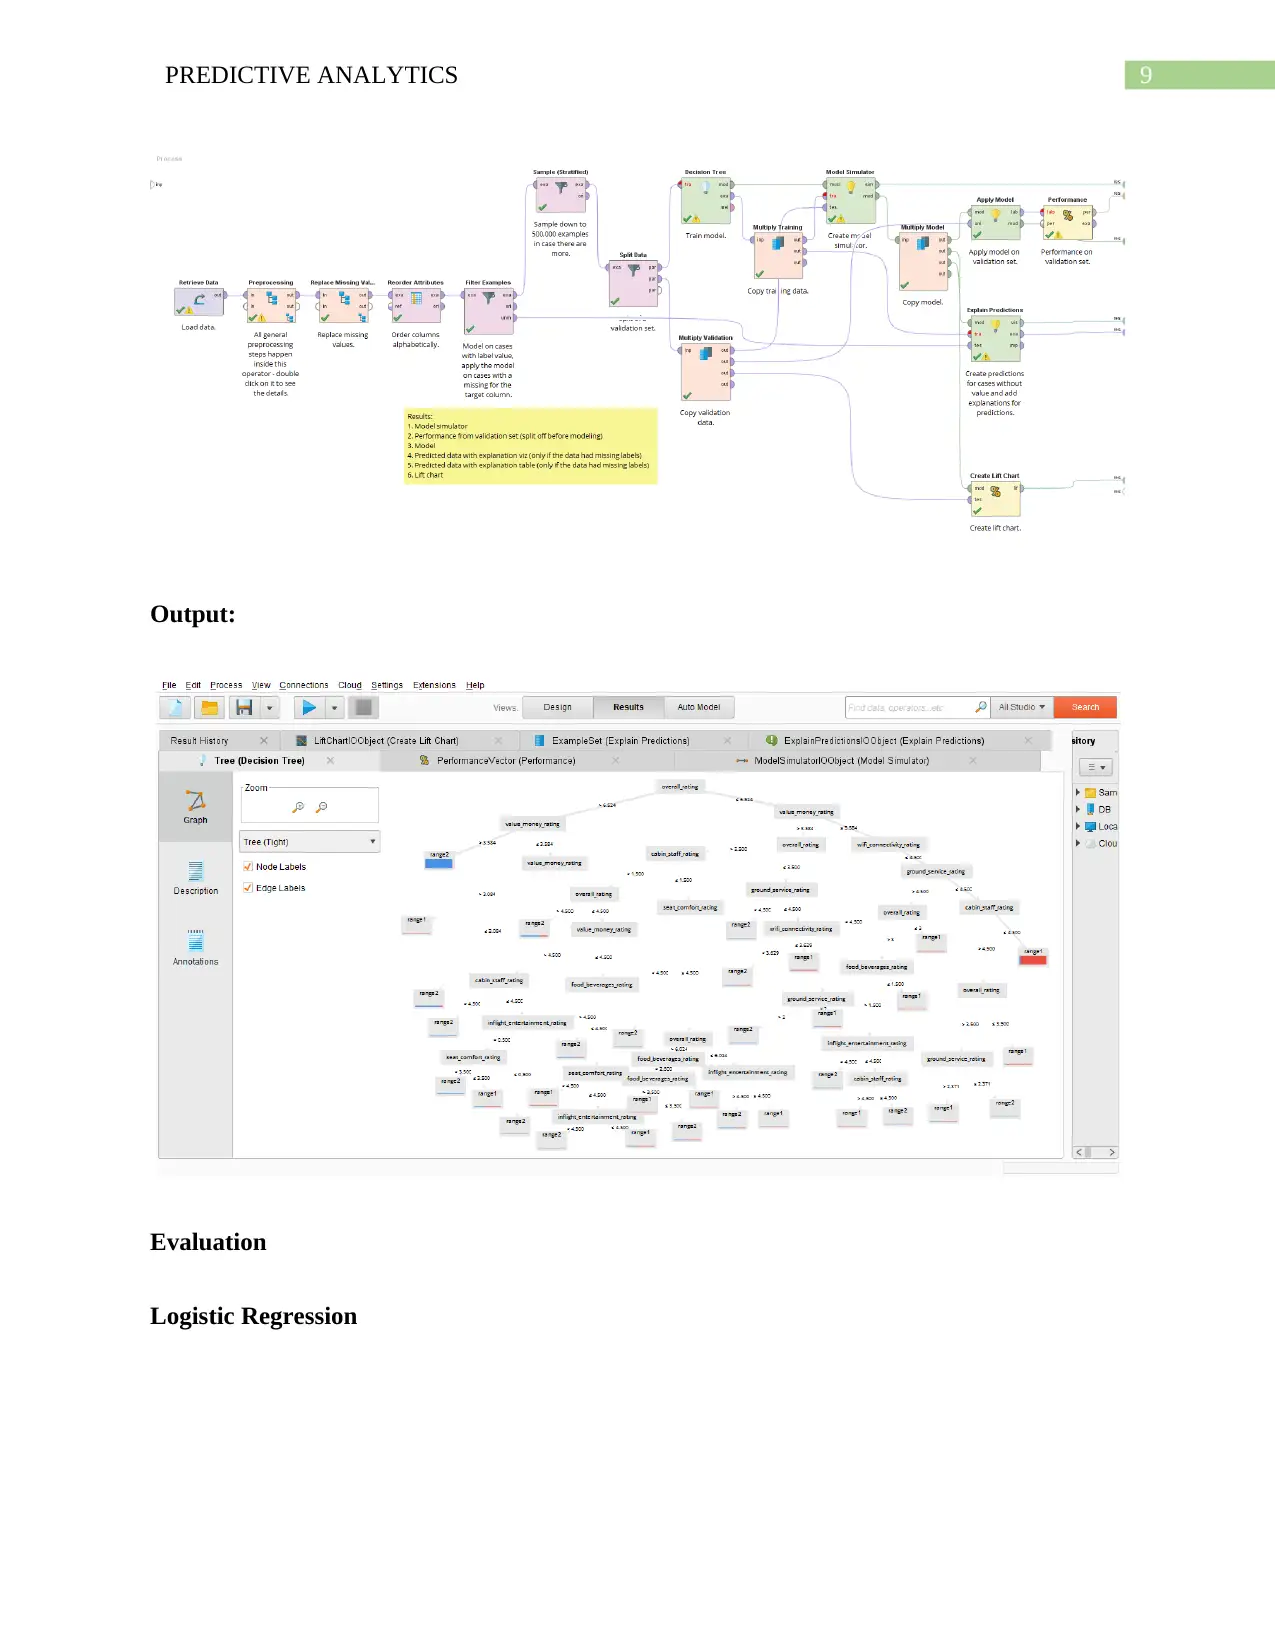
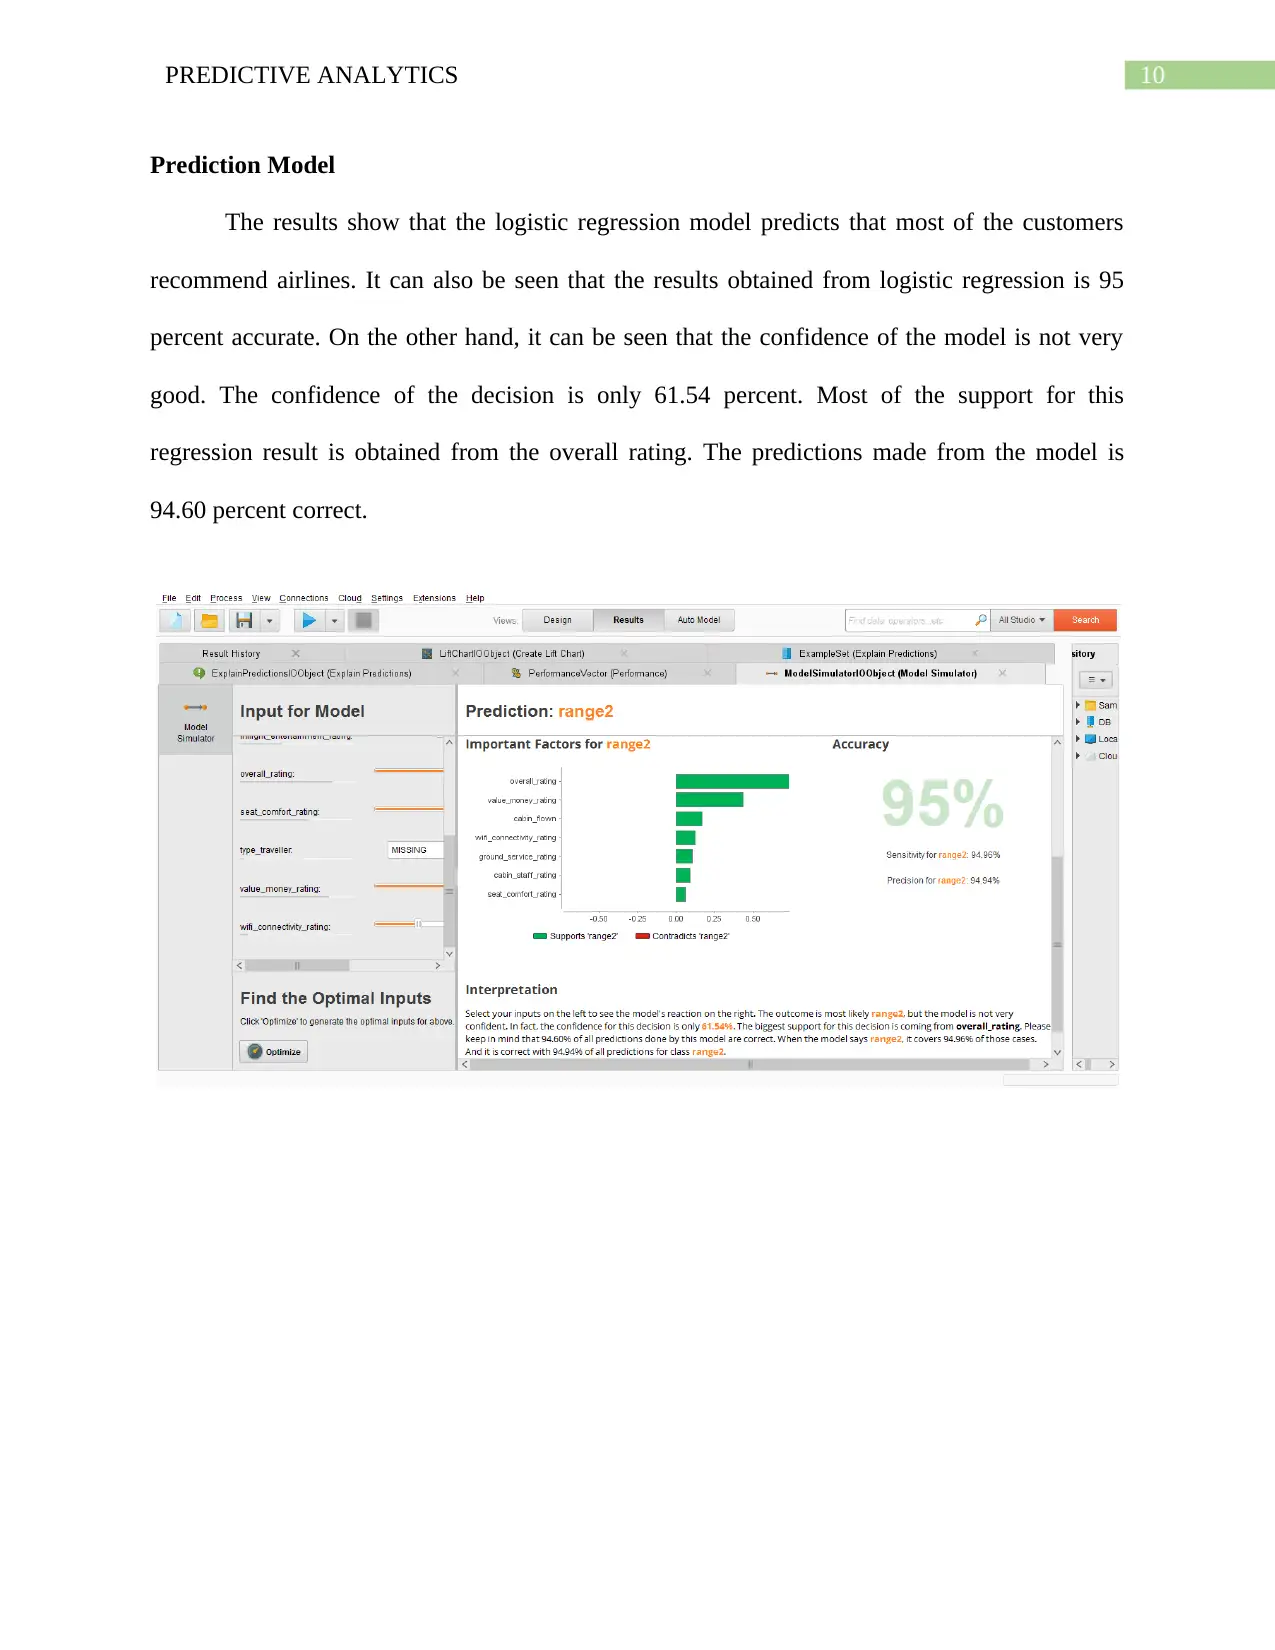
This report predicts airline recommendations using customer ratings data collected by Skytrax. Two models, logistic regression and decision tree, were employed to determine the factors influencing customer recommendations. The analysis reveals that customer ratings on food and beverage, ground service, inflight entertainment, seat comfort, Wi-Fi connectivity, value for money, and overall rating are significant predictors. The decision tree model was found to be more accurate than logistic regression in predicting recommendations. The report concludes with recommendations for the Airport Quality Agency to focus on service quality to enhance customer satisfaction and increase demand for airlines. Desklib provides access to similar solved assignments and past papers for students.
Document Page
Running Head: PREDICTIVE ANALYTICS
Predictive Analysis
Name of the Student
Name of the University
Author Note
tabler-icon-diamond-filled.svg

Paraphrase This Document

Need a fresh take? Get an instant paraphrase of this document with our AI Paraphraser
Document Page
1PREDICTIVE ANALYTICS
Executive Summary
This research is aimed towars providing a prediction for the Airport Quality Agency (AQA)
whether airlines are revommended by customers or not. To conduct the analysis, data has been
collected from a survey conducted by Skytrax. The survey was conducted on customer ratings on
various services provided by the Airport Quality Agency. Data on the ratings has been have been
used for the analysis. From basic analysis, it has been observed that most of the customers have
hiven a higher customer rating and most of the customers who have given higher ratings have
recommended airlines. Two different models have been used to predict the recommendations. It
has been observed that the decision tree model has been a better model in predicting the
recommendations.
Document Page
2PREDICTIVE ANALYTICS
Table of Contents
Background......................................................................................................................................3
Data Preparation..............................................................................................................................3
Discover relationship.......................................................................................................................4
Model Creation................................................................................................................................5
Logistic regression.......................................................................................................................5
Process.....................................................................................................................................5
Output:.....................................................................................................................................7
Decision Tree...............................................................................................................................7
Process:....................................................................................................................................7
Output:.....................................................................................................................................8
Evaluation........................................................................................................................................8
Logistic Regression.....................................................................................................................8
Prediction Model.....................................................................................................................9
ROC Curve:...........................................................................................................................10
Lift chart:...............................................................................................................................10
Accuracy................................................................................................................................11
Decision Tree.............................................................................................................................11
Prediction Model...................................................................................................................11
ROC Curve............................................................................................................................12
Document Page
3PREDICTIVE ANALYTICS
Lift Chart...............................................................................................................................13
Accuracy................................................................................................................................13
Overall Comparison...................................................................................................................13
Recommendations..........................................................................................................................14
tabler-icon-diamond-filled.svg

Paraphrase This Document

Need a fresh take? Get an instant paraphrase of this document with our AI Paraphraser
Document Page
4PREDICTIVE ANALYTICS
Background
Airport Quality Agency is interested to review all the different aspects that the passengers
travelling by air experience around the world. The main interest of the Airport Quality Agency is
to evaluate whether the customers are recommending the airlines to other non-existing
customers. Also, the factors that are responsible for the existing customers to recommend airlines
to others are also to be evaluated. A mini survey has been conducted on the existing passengers
and their reviews on different factors have been recorded. The survey has been conducted by
Skytrax. Customers reviews will be collected from different social media such as twitter and
facebook for future analysis. At present, the available data will be analysed using the rapid miner
tool. Here, the analysis has been conducted on the data on airlines collected by Skytrax. If more
people recommend airlines, then the number of customers travelling by flight will increase and
the demand for the flight will increase.
The objective of this research is to explore the data that is available from Skytrax on
Airlines and identify the factors that are significant for recommending airlines.
Data Preparation
The dataset on airlines contains a lot of variables. Among all the variables, the variables
which are considered for the prediction of recommendation are the ratings given by the
customers. The attributes on which the customers have provided ratings are food and beverage,
ground service, inflight entertainment, comfortability of the seats, wifi connectivity, value for
money ride and overall rating. All these ratings factors will be used to interpret the
recommendations given by customers for the airlines.
Document Page
5PREDICTIVE ANALYTICS
There are a lot of missing values in the data which will be manipulated while running the
analysis in rapidminer.
Discover relationship
It is important to find out whether airlines is recommended by customers.
Recommendation is supposed to be dependent on ratings given by the customers. From the
histogram obtained of the overall rating given by the customers, it can be seen that most of the
customers have given a higher rating. Thus, it can be said that most of the customers are satisfied
by the services provided by the airlines and thus is expected to recommend it to others.
From the correlation table, it is clear that all the ratings have a high positive correlation
with recommendation. Thus, from here, it can be said that the higher the ratings given by the
customers, the higher is the chance for that customer to recommend airline to other non-existing
customers.
Document Page
6PREDICTIVE ANALYTICS
Model Creation
The model has been developed using two different methods – Logistic Regression and
decision tree. The processes and outputs of running the two different prediction methods are
discussed in the following sections.
Logistic regression
Process
tabler-icon-diamond-filled.svg

Paraphrase This Document

Need a fresh take? Get an instant paraphrase of this document with our AI Paraphraser
Document Page
7PREDICTIVE ANALYTICS
The process followed for running logistic regression is given in the following figure.
Logistic regression has been used to predict recommendation from the customer ratings. This
model is one of the important model that can be used for prediction as logistic regression is a
model simulator. Sets the performance from validation by splitting off before starting the
modelling. After that the model is prepared. Logistic regression can also predict data with
explanation only if there are presence of missing values in the dataset. The modelling method
also provides explanation of the data with appropriate tables only if there are missing values in
the data. It also gives a life chart showing the trend of the data.
From the regression analysis, the variables that have been found significant in predicting
recommendations are food and beverage, ground service, inflight entertainment, comfortability
of the seats, wifi connectivity, value for money ride and overall rating
The regression model in predicting the recommendation for airlines is given by the
following equation:
Recommendation = 13.592 + (-0.434 * Cabin Staff Rating) + (- 0.107 * Food beverages rating) +
(- 0.308 * ground services rating) + (- 0.045 * inflight entertainment rating) + (- 1.095 * overall
rating) + (- 0.145 * seat comfort rating) + (- 1.050 * value money rating) + (- 0.436 * wifi
connectivity rating).
Document Page
8PREDICTIVE ANALYTICS
Output:
Decision Tree
Process:
To predict recommendation, another method can be used with which this prediction can
be conducted. This is the decision tree method. The decision tree method is also a model
simulator. This method can also work from the validation set and splits the set before modelling
the data. After splitting the modelling is conducted. The data can be predicted in the presence of
missing data and can be represented and explained clearly with the help of tables. Life chart is
also presented for a clear understanding of the prediction.
It can be seen from the decision tree that when overall rating is less than 3.584, people do
not recommend the airlines and when the overall ratings is higher than 6.524, people tend to
recommend the airlines. Other rating attributes are also considered for the prediction of
recommendation.
Document Page
9PREDICTIVE ANALYTICS
Output:
Evaluation
Logistic Regression
tabler-icon-diamond-filled.svg

Paraphrase This Document

Need a fresh take? Get an instant paraphrase of this document with our AI Paraphraser
Document Page
10PREDICTIVE ANALYTICS
Prediction Model
The results show that the logistic regression model predicts that most of the customers
recommend airlines. It can also be seen that the results obtained from logistic regression is 95
percent accurate. On the other hand, it can be seen that the confidence of the model is not very
good. The confidence of the decision is only 61.54 percent. Most of the support for this
regression result is obtained from the overall rating. The predictions made from the model is
94.60 percent correct.
Document Page
11PREDICTIVE ANALYTICS
ROC Curve:
Lift chart:
Document Page
12PREDICTIVE ANALYTICS
Accuracy
Decision Tree
Prediction Model
The results show that the decision tree model also predicts that most of the customers
recommend airlines. It can also be seen that the results obtained from decision tree is 95 percent
accurate. On the other hand, it can be seen that the confidence of the model is extremely good.
The model is 99.4 percent confident in predicting that most of the customers recommend airlines.
It is worth mentioning that 95.44 percent of the predictions that has been obtained from the
model are correct. Thus, prediction of range 2 indicates that in 94.94 percent of the cases, airlines
is recommended and the prediction is correct with the percentage of 96.47 percent.
tabler-icon-diamond-filled.svg

Paraphrase This Document

Need a fresh take? Get an instant paraphrase of this document with our AI Paraphraser
Document Page
13PREDICTIVE ANALYTICS
ROC Curve
Document Page
14PREDICTIVE ANALYTICS
Lift Chart
Accuracy
Overall Comparison
Document Page
15PREDICTIVE ANALYTICS
Thus, comparing the two prediction models, it can be seen that the logistic regression is
92.9 percent accurate in predicting the outcome correctly in this case and the decision tree
approach of prediction is 95.4 percent accurate in predicting the outcome correctly. Thus, the
decision tree approach is much more effective as a prediction model than the logistic regression
model.
Recommendations
As most people recommend airlines for the purpose of travel, the demand for airlines is
most likely to increase with the advancement of time. Thus, the Airport Quality Agency must
take care of the service qualities so that the satisfaction of the customers increases.
chevron_up_icon
1 out of 16
circle_padding
hide_on_mobile
zoom_out_icon
[object Object]