MIS772 Predictive Analytics Assignment A2 - Wine Rating Prediction
VerifiedAdded on 2022/11/28
|15
|2141
|417
Project
AI Summary
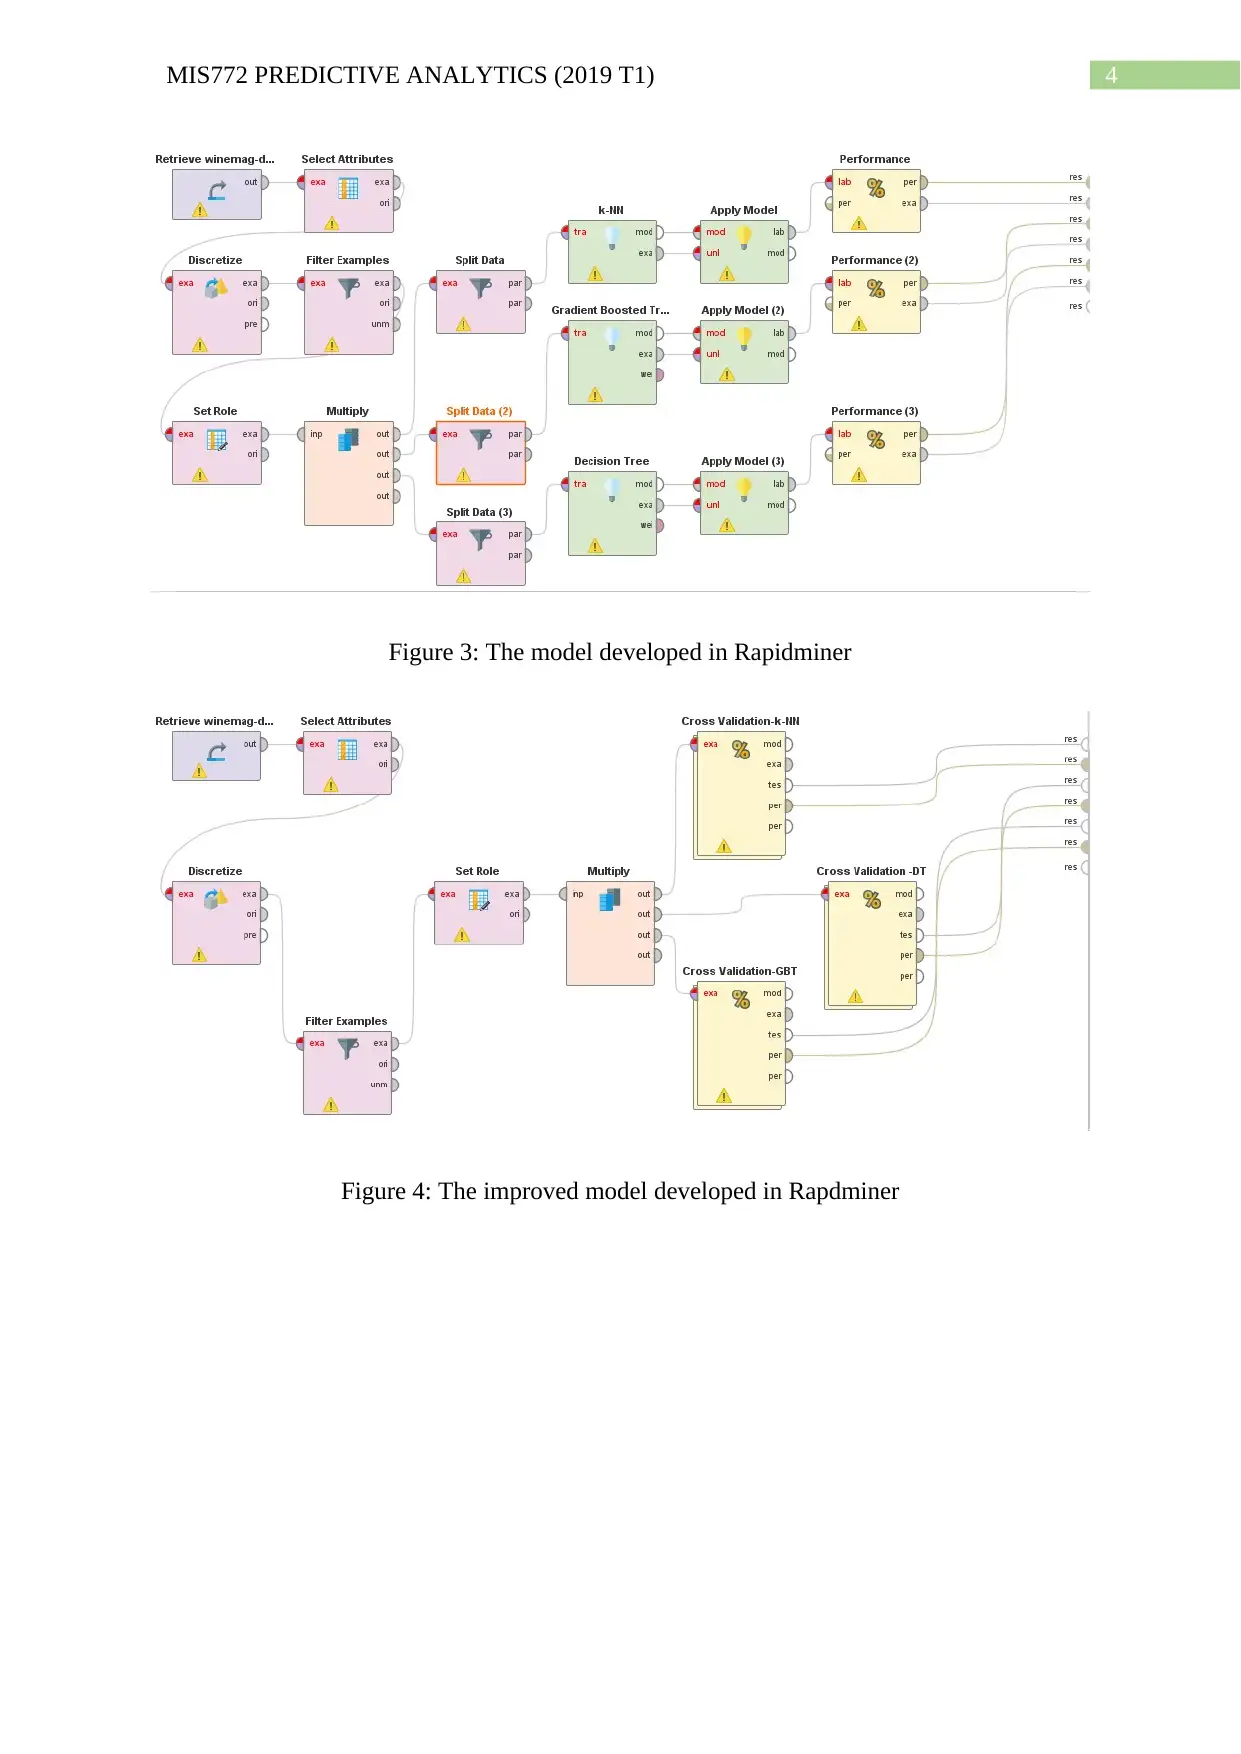
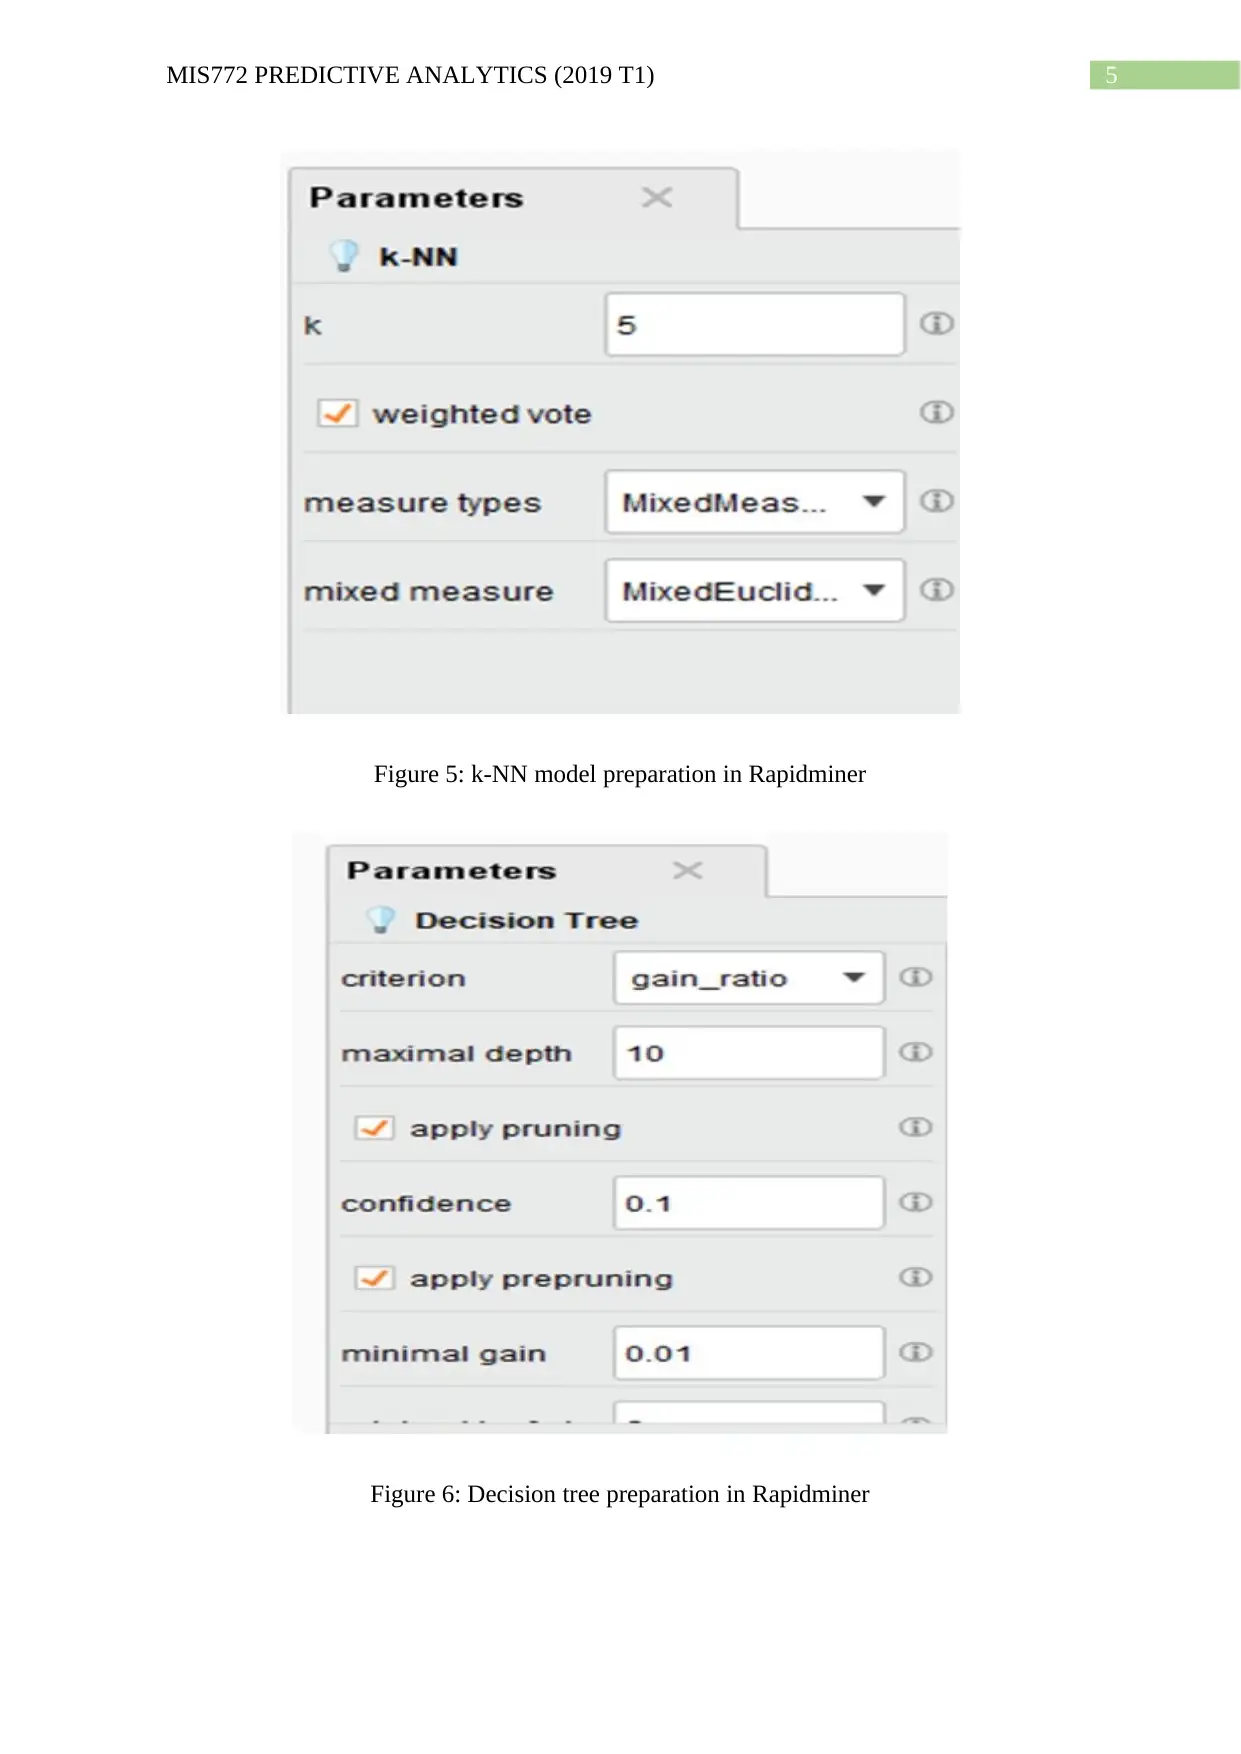
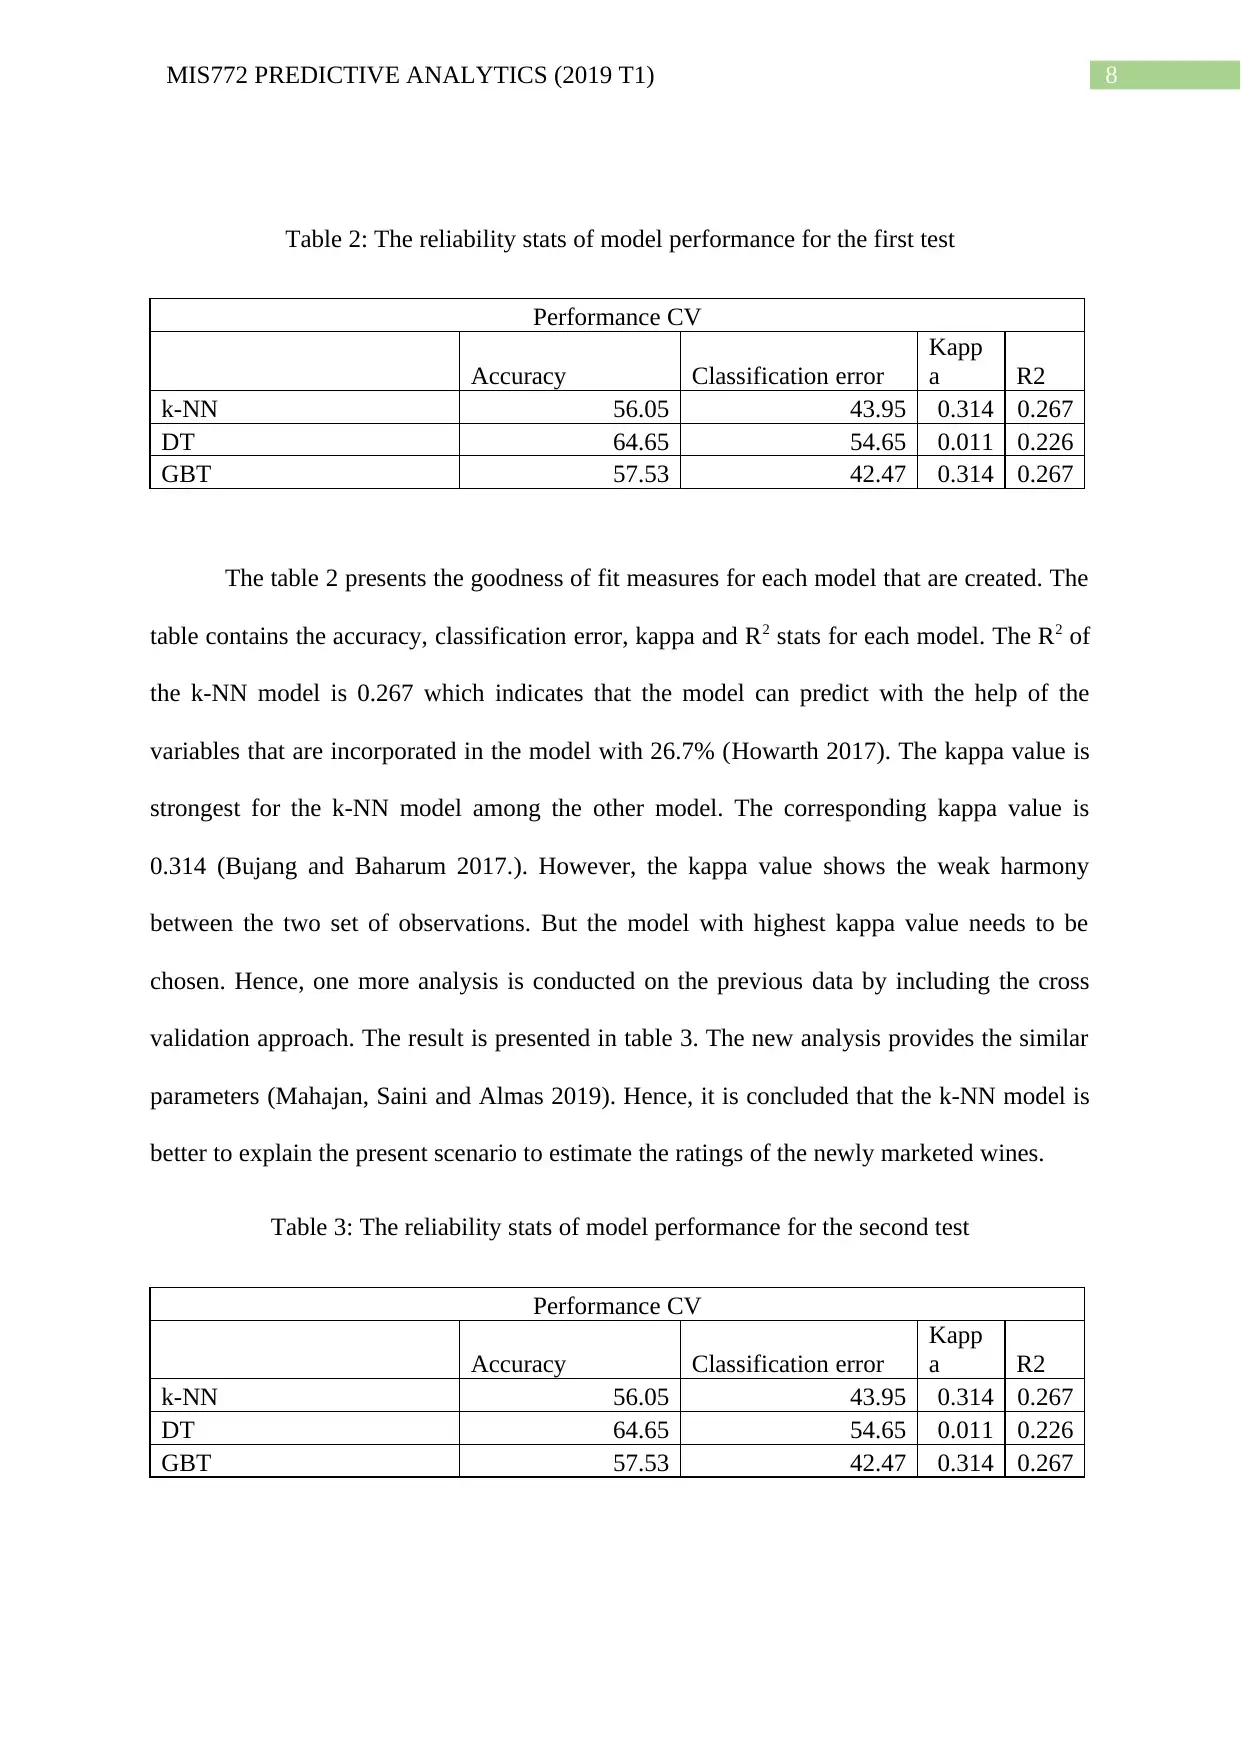
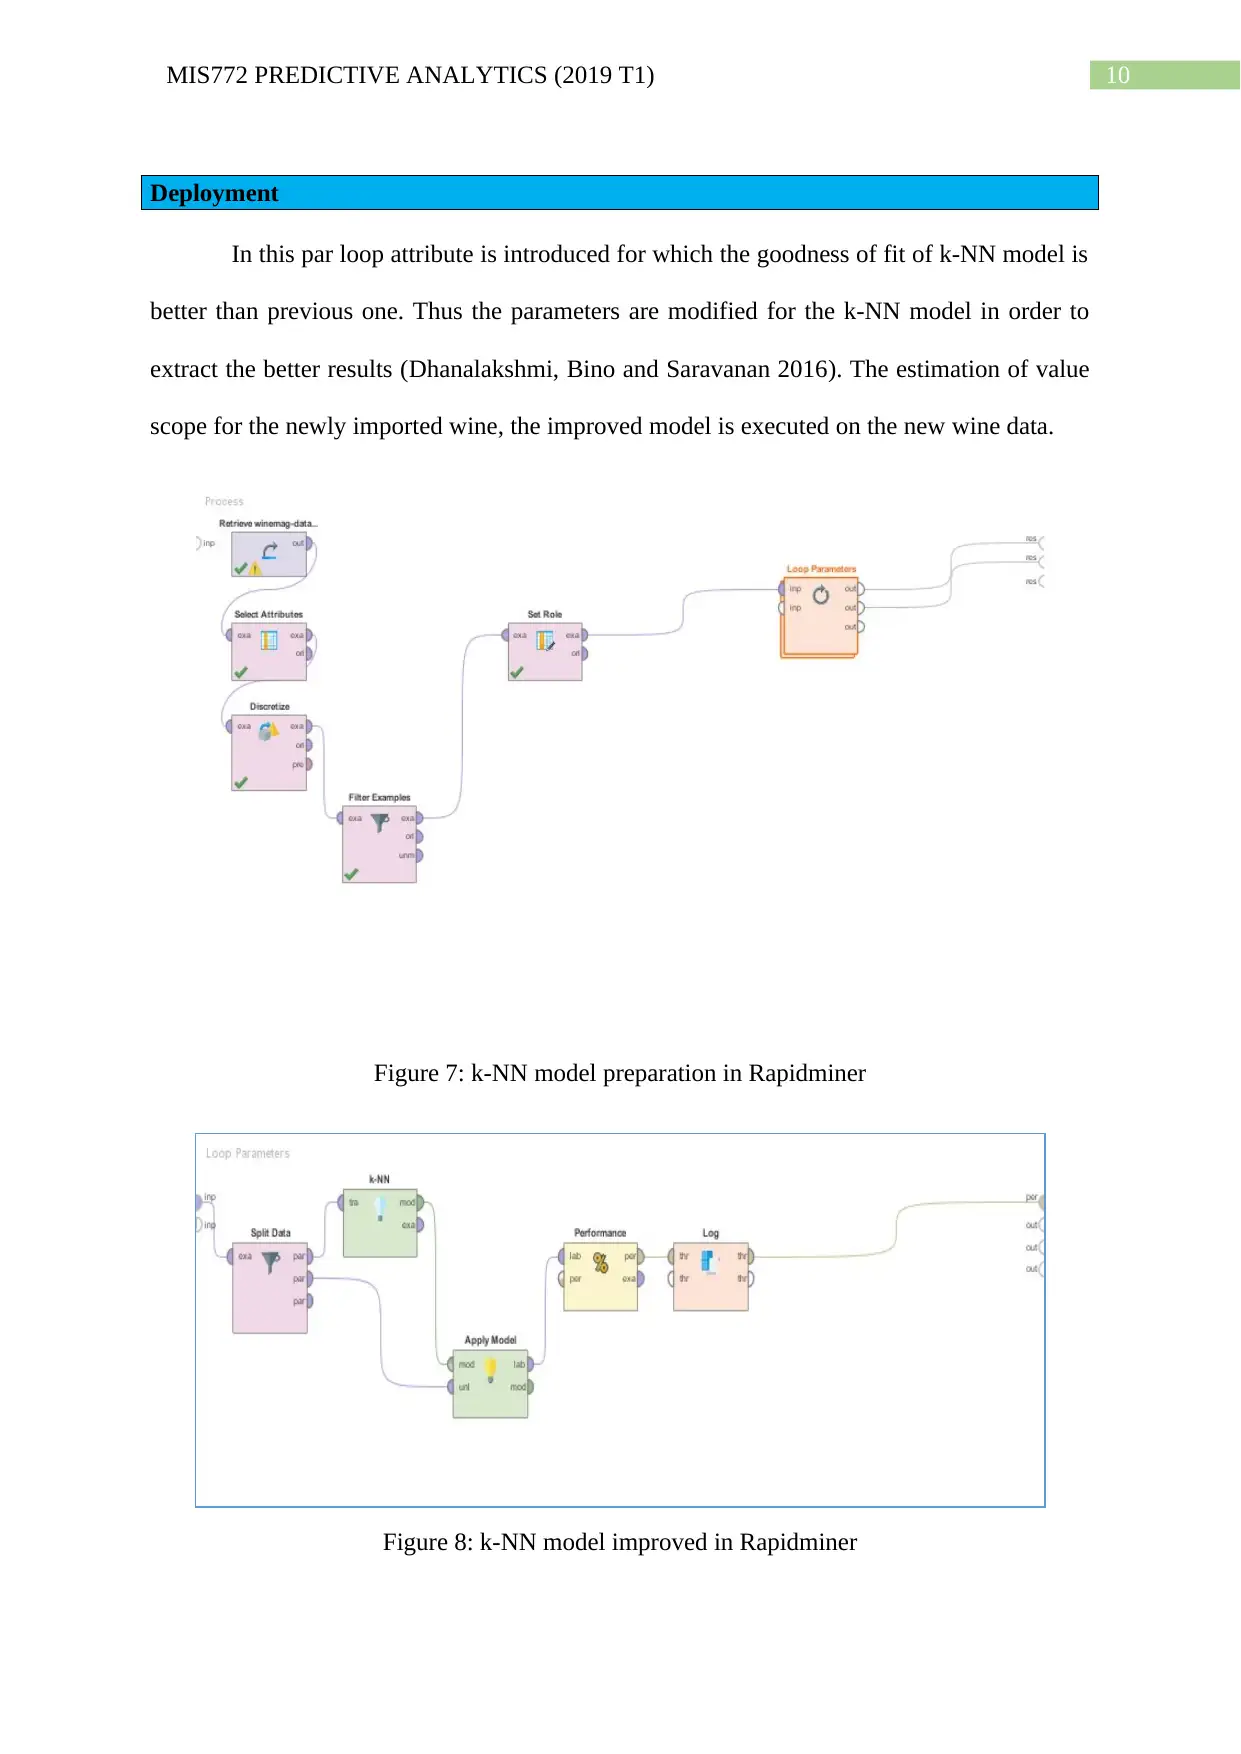
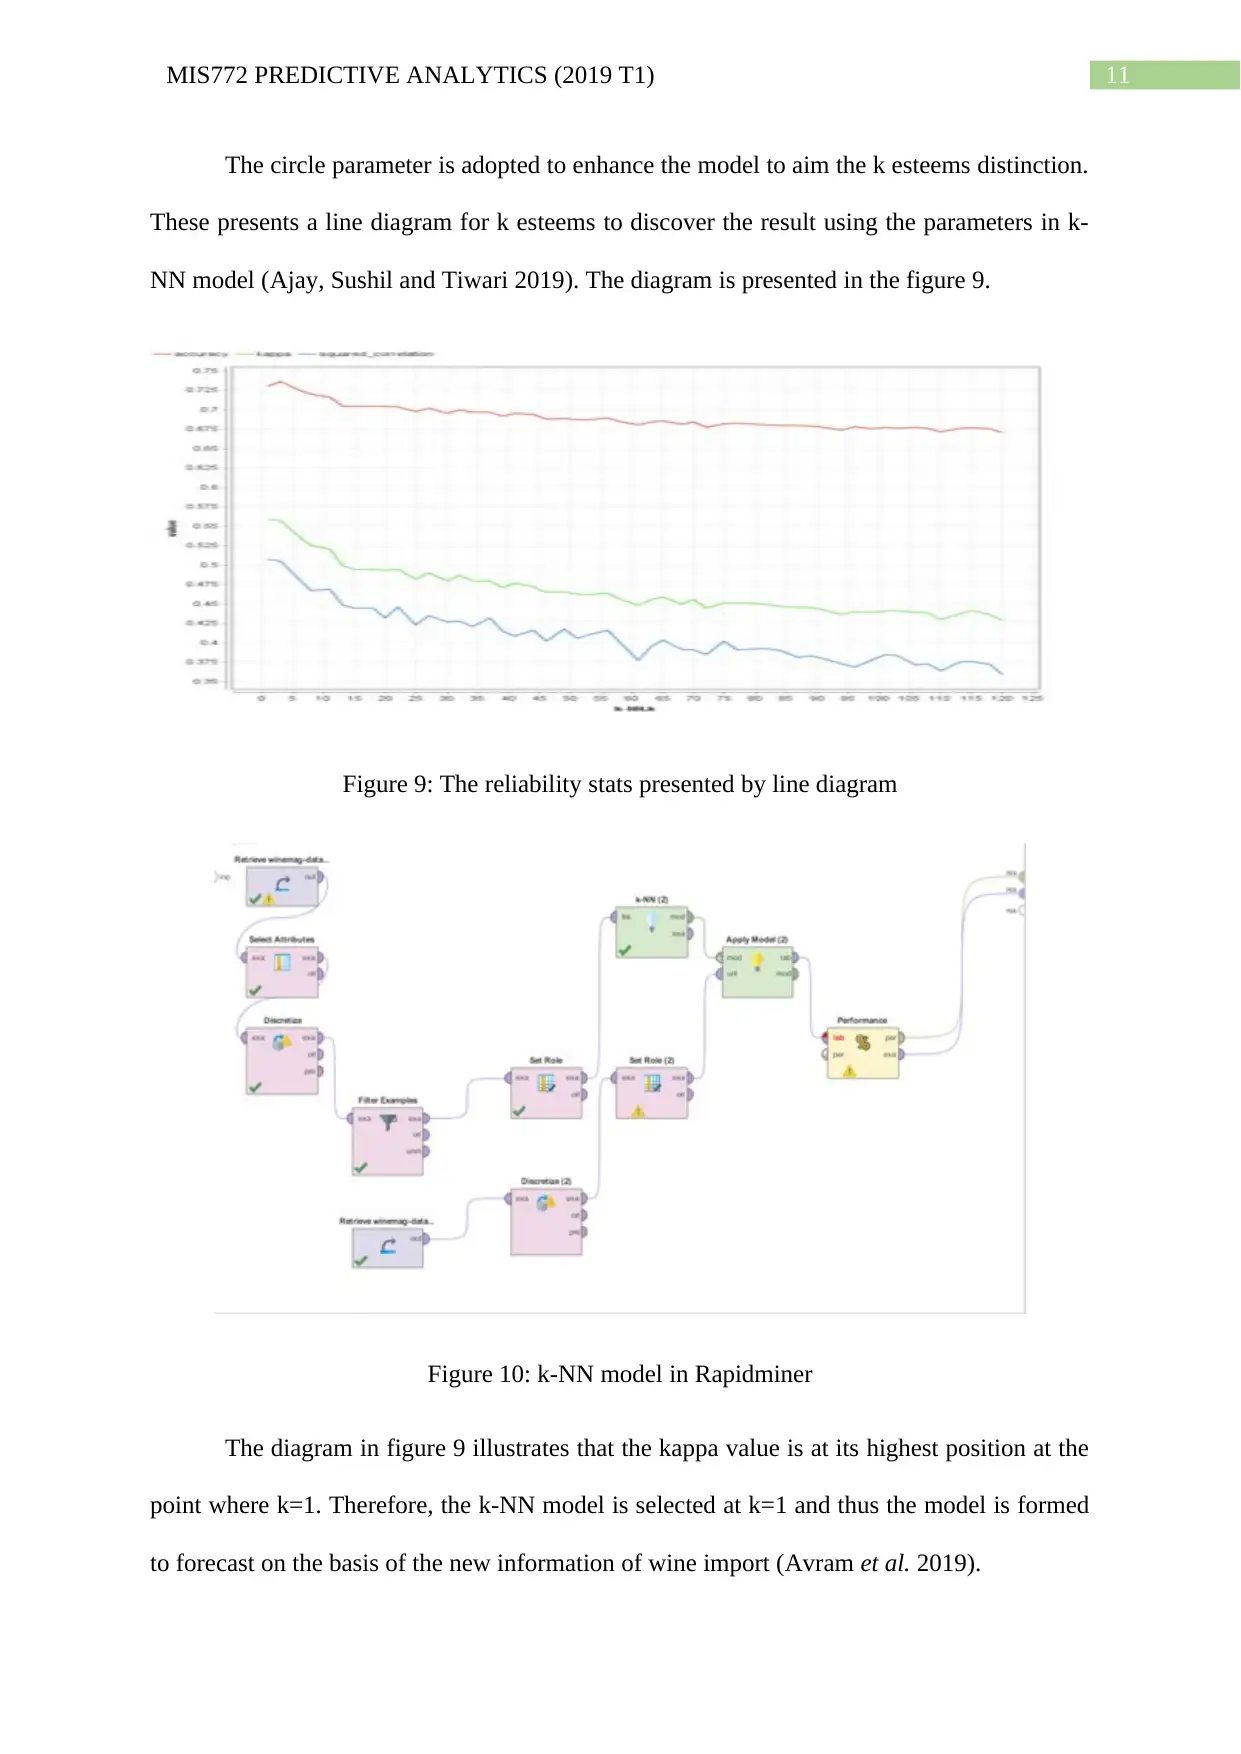
This assignment explores the application of predictive analytics to estimate and classify imported wines based on their price and quality. The student utilized a dataset of 130,000 wine samples, employing data mining techniques and the RapidMiner platform to build and evaluate predictive models. Th...

Running head: MIS772 PREDICTIVE ANALYTICS (2019 T1)
MIS772 Predictive Analytics (2019 T1)
Individual Assignment A2-LP4 / All Workshops
Name of the Student:
Name of the University:
Author Note:
MIS772 Predictive Analytics (2019 T1)
Individual Assignment A2-LP4 / All Workshops
Name of the Student:
Name of the University:
Author Note:
Paraphrase This Document
Need a fresh take? Get an instant paraphrase of this document with our AI Paraphraser

1MIS772 PREDICTIVE ANALYTICS (2019 T1)
Executive Summary
The Australian Wine Importers (AWI) is larger than most of the other wine producers
in Australia. The AWI aims to estimate and classify new imported wines based on the price
and quality of wine through developing data and text mining method. As, the estimation and
classification is going to be done on the basis of price, the variable have to be in a proper
form for better interpretation. Hence, the price category is divided in to equal size bins. Wine
testing result of 130000 sample is available to develop a model through the application of
data mining. The data contains information on the name of tester, name of wine, country,
province, region, variety, winery, description, designation, price and points. These all
variables are not necessary to be included in the analysis and that is why unnecessary
variables are dropped from the data set. Now, the variables that are going to be used in the
process are country, province, region, variety, winery, designation, price and points. In order
to get the bets result three models are formulated and the models are k-NN, decision tree and
gradient boost tree. The outcomes of these three models are examined to choose the better
one. Moreover, to predict the rating on the basis of points associated to each wine a predictive
model is also formulated and explained.

2MIS772 PREDICTIVE ANALYTICS (2019 T1)
Model Creation
Data processing is the key step to create the model to predict the rating and for
classification of wines on the basis of price. The indeterminate variables that are present in
the dataset are country, designation, province, region, variety and winery. The nominal
variables present in the data set are price and points that are going to play a significantly role
in the model creation. Now, the rating of the wine is categorized in 5 sub-categories that are
under average wine, average wine, good wine, very good wine and excellent wine on the
basis of given points to each wines. The range of points for each sub-categories is mentioned
in the table 1 (Abidi et al. 2019).
Table 1: The standard categories of wines according to the rating of the wines.
Categories of Wine according to Rating Distributed Points Range
Under average wine 80-84
Average wine 84-88
Good wine 88-92
Very good wine 92-96
Excellent wine 96-100
The figure 1 and figure 2 presents the price of wine against the sub category of wine
ratings and the points of wine against various countries respectively. The relationship or the
connection between the price of the wine and the quality rating of the wine as well as the
connection between the points of wine and the country is presented by the following bar
chart. Thus, the visualisation of the distribution is presented by using the given set of data on
wine test.
⊘ This is a preview!⊘
Do you want full access?
Subscribe today to unlock all pages.

Trusted by 1+ million students worldwide

3MIS772 PREDICTIVE ANALYTICS (2019 T1)
Figure 1: Bar chart: The categories of wine and the price.
Figure 2: Bar chart: Wines in different countries with their ratings.
Figure 1: Bar chart: The categories of wine and the price.
Figure 2: Bar chart: Wines in different countries with their ratings.
Paraphrase This Document
Need a fresh take? Get an instant paraphrase of this document with our AI Paraphraser

4MIS772 PREDICTIVE ANALYTICS (2019 T1)
Figure 3: The model developed in Rapidminer
Figure 4: The improved model developed in Rapdminer
Figure 3: The model developed in Rapidminer
Figure 4: The improved model developed in Rapdminer

5MIS772 PREDICTIVE ANALYTICS (2019 T1)
Figure 5: k-NN model preparation in Rapidminer
Figure 6: Decision tree preparation in Rapidminer
Figure 5: k-NN model preparation in Rapidminer
Figure 6: Decision tree preparation in Rapidminer
⊘ This is a preview!⊘
Do you want full access?
Subscribe today to unlock all pages.

Trusted by 1+ million students worldwide

6MIS772 PREDICTIVE ANALYTICS (2019 T1)
The model is prepared to estimate the rating of newly imported wine. So, three
models are created and the models are k-NN model, gradient boost tree and decision tree
model that are created to predict the rating of newly imported wine. The Rapidminer is used
to train on the 70% data of the original data and to test on the 30% data of the original data.
The above two figure 5 and 6 represents the information about the modelling. The k-NN
model has incorporated 5 k fold and the gain ratio tree also considered the 5 k fold. The
decision tree has considered the depth as 10.
Paraphrase This Document
Need a fresh take? Get an instant paraphrase of this document with our AI Paraphraser

7MIS772 PREDICTIVE ANALYTICS (2019 T1)
Evaluation
The three models that are formed to analyse in order to fulfil the objective of the
paper are explained with the statistics like kappa, R2 and accuracy. The goodness of fit of the
models can be explained better with these stat that are explained below:
Accuracy of a model is simply determined by the percentage of the prediction of
sample that are correct to the total number of sample used in the model. The determination of
accuracy itself describes the function of the stat that it says how much the model is accurate.
Although there are some limitations of these stat and the model can be predicted more
inherently with other stats.
Classification error is determined by the percentage of the prediction of sample that
are wrong to the total number of sample used in the model. The definition says that the stat
describes how much error is carried by the model. It also can be said that addition of
classification error and accuracy stat is equal to 100%.
The kappa stat is a measure of goodness of fit that is obtained from the confusion
matrix. The value of kappa lies between 0 to 1. This stat is basically used to describe the
unbalanced samples. The kappa value equals to 0 implies no harmony between two set of
observations. The kappa value equal to 1 implies perfect harmony between two set of
observations. Usually, a kappa value greater than 0.5 is considered as enough to present the
moderate harmony between two set of observations (Flight and Julious 2015).
R2 is also a measure of goodness of fit that is widely used in statistical studies to test
the overall goodness of fit of a model. The value of R2 lies between 0 to 1. The value 0
indicates the worst fitness of the model as it contains 100% errors. The value 1 indicates that
the best fitness of the model as it contains no error (D'Agostino 2017).

8MIS772 PREDICTIVE ANALYTICS (2019 T1)
Table 2: The reliability stats of model performance for the first test
Performance CV
Accuracy Classification error
Kapp
a R2
k-NN 56.05 43.95 0.314 0.267
DT 64.65 54.65 0.011 0.226
GBT 57.53 42.47 0.314 0.267
The table 2 presents the goodness of fit measures for each model that are created. The
table contains the accuracy, classification error, kappa and R2 stats for each model. The R2 of
the k-NN model is 0.267 which indicates that the model can predict with the help of the
variables that are incorporated in the model with 26.7% (Howarth 2017). The kappa value is
strongest for the k-NN model among the other model. The corresponding kappa value is
0.314 (Bujang and Baharum 2017.). However, the kappa value shows the weak harmony
between the two set of observations. But the model with highest kappa value needs to be
chosen. Hence, one more analysis is conducted on the previous data by including the cross
validation approach. The result is presented in table 3. The new analysis provides the similar
parameters (Mahajan, Saini and Almas 2019). Hence, it is concluded that the k-NN model is
better to explain the present scenario to estimate the ratings of the newly marketed wines.
Table 3: The reliability stats of model performance for the second test
Performance CV
Accuracy Classification error
Kapp
a R2
k-NN 56.05 43.95 0.314 0.267
DT 64.65 54.65 0.011 0.226
GBT 57.53 42.47 0.314 0.267
⊘ This is a preview!⊘
Do you want full access?
Subscribe today to unlock all pages.

Trusted by 1+ million students worldwide

9MIS772 PREDICTIVE ANALYTICS (2019 T1)
Paraphrase This Document
Need a fresh take? Get an instant paraphrase of this document with our AI Paraphraser

10MIS772 PREDICTIVE ANALYTICS (2019 T1)
Deployment
In this par loop attribute is introduced for which the goodness of fit of k-NN model is
better than previous one. Thus the parameters are modified for the k-NN model in order to
extract the better results (Dhanalakshmi, Bino and Saravanan 2016). The estimation of value
scope for the newly imported wine, the improved model is executed on the new wine data.
Figure 7: k-NN model preparation in Rapidminer
Figure 8: k-NN model improved in Rapidminer

11MIS772 PREDICTIVE ANALYTICS (2019 T1)
The circle parameter is adopted to enhance the model to aim the k esteems distinction.
These presents a line diagram for k esteems to discover the result using the parameters in k-
NN model (Ajay, Sushil and Tiwari 2019). The diagram is presented in the figure 9.
Figure 9: The reliability stats presented by line diagram
Figure 10: k-NN model in Rapidminer
The diagram in figure 9 illustrates that the kappa value is at its highest position at the
point where k=1. Therefore, the k-NN model is selected at k=1 and thus the model is formed
to forecast on the basis of the new information of wine import (Avram et al. 2019).
⊘ This is a preview!⊘
Do you want full access?
Subscribe today to unlock all pages.

Trusted by 1+ million students worldwide

12MIS772 PREDICTIVE ANALYTICS (2019 T1)
Research
The Rapidminer is the open source that deals with data mining and predictive analysis
and most reliable to find and test the establishment of connection between two or more
variables from a large set of data. The benefits of the data mining are that it makes easy to
identify the proper and suitable system for specific cases to examine and test the process and
implements the system to predict the output from a given set of data using Rapidminer. Next
is to recognize the data and the variables and clarification for incorporating elements. The
connection and association of data needs to be researched.
Paraphrase This Document
Need a fresh take? Get an instant paraphrase of this document with our AI Paraphraser

13MIS772 PREDICTIVE ANALYTICS (2019 T1)
Reference
Abidi, S., Hussain, M., Xu, Y. and Zhang, W., 2019. Prediction of Confusion Attempting
Algebra Homework in an Intelligent Tutoring System through Machine Learning Techniques
for Educational Sustainable Development. Sustainability, 11(1), p.105.
Ajay, K., Sushil, R. and Tiwari, A., 2019. Cancer Survival Analysis Using Machine
Learning. Available at SSRN 3354469.
Avram, A., Matei, O., Pintea, C.M., Pop, P.C. and Anton, C.A., 2019, May. Context-Aware
Data Mining vs Classical Data Mining: Case Study on Predicting Soil Moisture.
In International Workshop on Soft Computing Models in Industrial and Environmental
Applications (pp. 199-208). Springer, Cham.
Bujang, M.A. and Baharum, N., 2017. Guidelines of the minimum sample size requirements
for Kappa agreement test. Epidemiology, Biostatistics and Public Health, 14(2).
D'Agostino, R., 2017. Goodness-of-fit-techniques. Routledge.
Dhanalakshmi, V., Bino, D. and Saravanan, A.M., 2016, March. Opinion mining from
student feedback data using supervised learning algorithms. In 2016 3rd MEC International
Conference on Big Data and Smart City (ICBDSC) (pp. 1-5). IEEE.
Flight, L. and Julious, S.A., 2015. The disagreeable behaviour of the kappa
statistic. Pharmaceutical statistics, 14(1), pp.74-78.
Halibas, A.S., Matthew, A.C., Pillai, I.G., Reazol, J.H., Delvo, E.G. and Reazol, L.B., 2019,
January. Determining the Intervening Effects of Exploratory Data Analysis and Feature
Engineering in Telecoms Customer Churn Modelling. In 2019 4th MEC International
Conference on Big Data and Smart City (ICBDSC) (pp. 1-7). IEEE.

14MIS772 PREDICTIVE ANALYTICS (2019 T1)
Howarth, R.J., 2017. r2 (r-squared, R-squared, coefficient of determination) The square of the
product-moment correlation coefficient; a measure of the goodness-of-fit of a regression.
Mahajan, G., Saini, B. and Almas, T., 2019. Taxonomy on RapidMiner Using Machine
Learning. Available at SSRN 3363071.
Roiger, R.J., 2017. Data mining: a tutorial-based primer. Chapman and Hall/CRC.
Saxena, R., Johri, A., Deep, V. and Sharma, P., 2019. Heart Diseases Prediction System
Using CHC-TSS Evolutionary, KNN, and Decision Tree Classification Algorithm.
In Emerging Technologies in Data Mining and Information Security (pp. 809-819). Springer,
Singapore.
⊘ This is a preview!⊘
Do you want full access?
Subscribe today to unlock all pages.

Trusted by 1+ million students worldwide
1 out of 15

Your All-in-One AI-Powered Toolkit for Academic Success.
+13062052269
info@desklib.com
Available 24*7 on WhatsApp / Email
Unlock your academic potential
© 2024 | Zucol Services PVT LTD | All rights reserved.