MIS772 Predictive Analytics: Classifying Wine Price Ranges
VerifiedAdded on 2023/04/21
|7
|2917
|189
Report
AI Summary
This report details the development of a classifier using RapidMiner to predict wine price ranges for American wine importers. The project aims to classify imported wines based on various attributes like price, variety, and winery, addressing the common problem of funding growth for wine exporters. The methodology involves data cleaning, exploration, and model creation using decision tree and random tree techniques. The model's performance is evaluated using accuracy and Kappa values, with the goal of minimizing classification errors and providing effective funding projections for Australian wine exporters. The report includes analysis of relationships between data attributes, model creation steps, and evaluation metrics, ultimately aiming to improve the accuracy of wine price range predictions.
MIS772 Predictive Analytics (2019 T1) Individual Assignment A1-LP2 / Workshops M1T1-M1T4
Assignment A1-LP2: Classification
Student
Name
(as per record) Student No Student number
My other group members A1
Group No
As per CloudDeakin group
number
Team
Names
(as per record) Student Nos Student number
(as per record) Student number
(as per record) Student number
Exceptional Meets expectations Issues noted Improve Unacceptable
Exec
Report
Discover
Relationships
Create
Models
Evaluate &
Improve
Provide
Solution
Research &
Extend
Brief
Comments Read these notes as we are really trying to help you out!
Remember: If it is not in this report, it does not exist and does not get marked!
You can use the above form to estimate the expected mark against the rubric (see the assignment “info”
document). Be realistic and note that we will find many problems you may not be aware of.
Assume that markers may be tired when assessing your work and they may miss some important aspects of
your submission when not presented clearly, or when you deviate from the structure of this template, or if you
do not include them in your report. So be clear, number all tables, charts and screen shots used as evidence,
describe all visuals, cross-reference your analysis with evidence.
Submit this report in PDF format to avoid accidental reformatting of the content.
Submit all RapidMiner processes (.RMP files) in a separate ZIP archive, so that if there is any doubt we could
load your work and replicate your results (we will not do this to find missing report parts).
Ensure that the report is readable and the font is no smaller than Arial 10 points. In the report include only the
most significant results for your analysis and recommendations.
You will be able to submit your work once only so make sure you get it right – check these before posting on
CloudDeakin: Is this your document? Is this the correct unit, assignment, year and trimester? Is your name
entered above? Is the group number included and is it correct? Are names of your group members entered as
well? Are all pages included? Does it all fit into the required page limit? Have you zipped all RapidMiner files
(.RMP files)? Is the report contents yours alone?
Then after the submission – check these: Has the PDF report been submitted? Has the Zip archive of RMP files
been submitted? Can you retrieve and reopen both back from your submission folder?
Note that the late penalty will be calculated on the date and time of the last submitted file.
Finally, as all reports will be inspected for plagiarism, ensure that your analysis, your evidence, your way of
thinking, your report and its presentation are unique and demonstrate your ability to create it all independently.
So if you work in a team compare your submission to those of your team members and make it quite distinct in
both contents and form. Any part of this report that bears any resemblance to another students’ report or any
information source written by others or by you for another unit (e.g. on the web) will be treated as plagiarism.
Total
1 of 7
Paraphrase This Document
Need a fresh take? Get an instant paraphrase of this document with our AI Paraphraser
MIS772 Predictive Analytics (2019 T1) Individual Assignment A1-LP2 / Workshops M1T1-M1T4
Executive summary (one page)
This project is uses the data mining method to develop a classifier which is used to determine the price range for
the new wines, by using the Rapid Miner data mining tool. Because, the American wine importers have asked the
user to develop a data mining method of classifying the imported wines based on price, variety, winery, country,
taster name, twitter handle, wine title, country, region, province and so on. The exporters are required to clean-up
and explore the wine tasting data to evaluate and develop a classifier, which determines the price range for new
wines. Moreover, it also wants to minimize the classification problems. Funding growth is considered as one of the
most common problem for the wine exporters. It is possible to ensure that the user are able to plan and manage
the funding appropriately for avoiding the problems, by developing data mining method for the provided wine data.
The main benefit of this project is to develop the classifier models to determine the price range for new wines.
The main objective of this project is to develop a data mining method for the provided wine data. The American
wine importers asked the user to develop a data mining method for classifying the imported wines based on the
following:
Price
Variety
Winery
Country
Taster Name
Twitter Handle
Wine Title
Region
Province and More.
The Australian Wine importers want to clean-up and explore the wine tasting data, then evaluate and develop a
classifier to determine the price range for the new wines and also wishes to minimize the classification problems.
One of the most common problems of the wine exporters is funding growth. Once the export comes into the
equation, financing requirements becomes even more important and many wine businesses need support to
enable them to fulfil their export and export-related contracts. So, each province is introducing new measures all
favouring their domestic producers and they differ between provinces. By developing data mining method for the
provided wine data with detailed funding projections, it is possible to ensure that the user is able to plan and
manage your funding accordingly, to avoid problems.
Therefore, classifier is being developed to determine the price range for new wines by using the Rapid Miner data
mining tool. To develop the classifier, a new model is created for the provided wine data, by using the two main
methods of data mining namely- Random tree and decision tree. And, also it evaluates and validates the created
model.
2 of 7
MIS772 Predictive Analytics (2019 T1) Individual Assignment A1-LP2 / Workshops M1T1-M1T4
Discovering Relationships and Data Transformation in RapidMiner (one page)
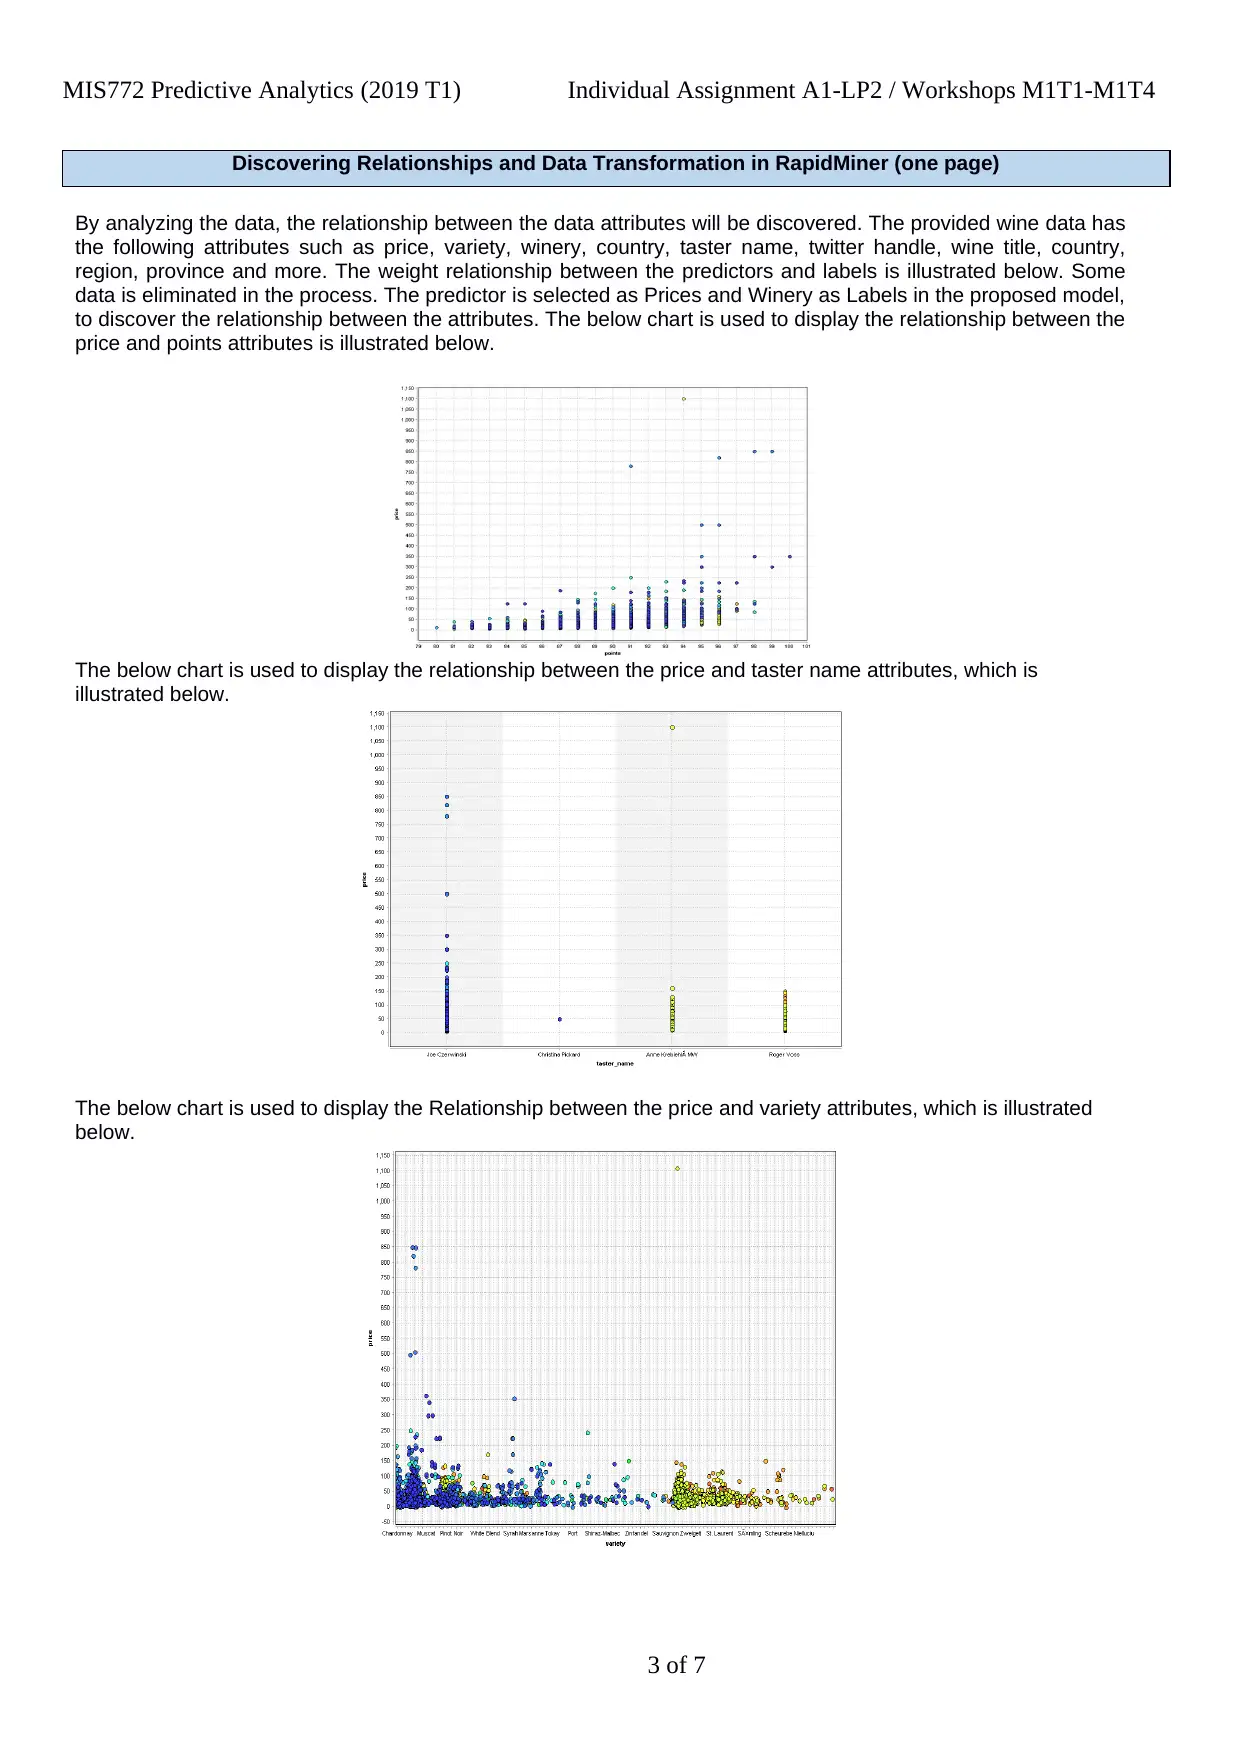
By analyzing the data, the relationship between the data attributes will be discovered. The provided wine data has
the following attributes such as price, variety, winery, country, taster name, twitter handle, wine title, country,
region, province and more. The weight relationship between the predictors and labels is illustrated below. Some
data is eliminated in the process. The predictor is selected as Prices and Winery as Labels in the proposed model,
to discover the relationship between the attributes. The below chart is used to display the relationship between the
price and points attributes is illustrated below.
The below chart is used to display the relationship between the price and taster name attributes, which is
illustrated below.
The below chart is used to display the Relationship between the price and variety attributes, which is illustrated
below.
3 of 7
Discovering Relationships and Data Transformation in RapidMiner (one page)
By analyzing the data, the relationship between the data attributes will be discovered. The provided wine data has
the following attributes such as price, variety, winery, country, taster name, twitter handle, wine title, country,
region, province and more. The weight relationship between the predictors and labels is illustrated below. Some
data is eliminated in the process. The predictor is selected as Prices and Winery as Labels in the proposed model,
to discover the relationship between the attributes. The below chart is used to display the relationship between the
price and points attributes is illustrated below.
The below chart is used to display the relationship between the price and taster name attributes, which is
illustrated below.
The below chart is used to display the Relationship between the price and variety attributes, which is illustrated
below.
3 of 7
⊘ This is a preview!⊘
Do you want full access?
Subscribe today to unlock all pages.
Trusted by 1+ million students worldwide
MIS772 Predictive Analytics (2019 T1) Individual Assignment A1-LP2 / Workshops M1T1-M1T4
Create a Model(s) in RapidMiner (one page limit)
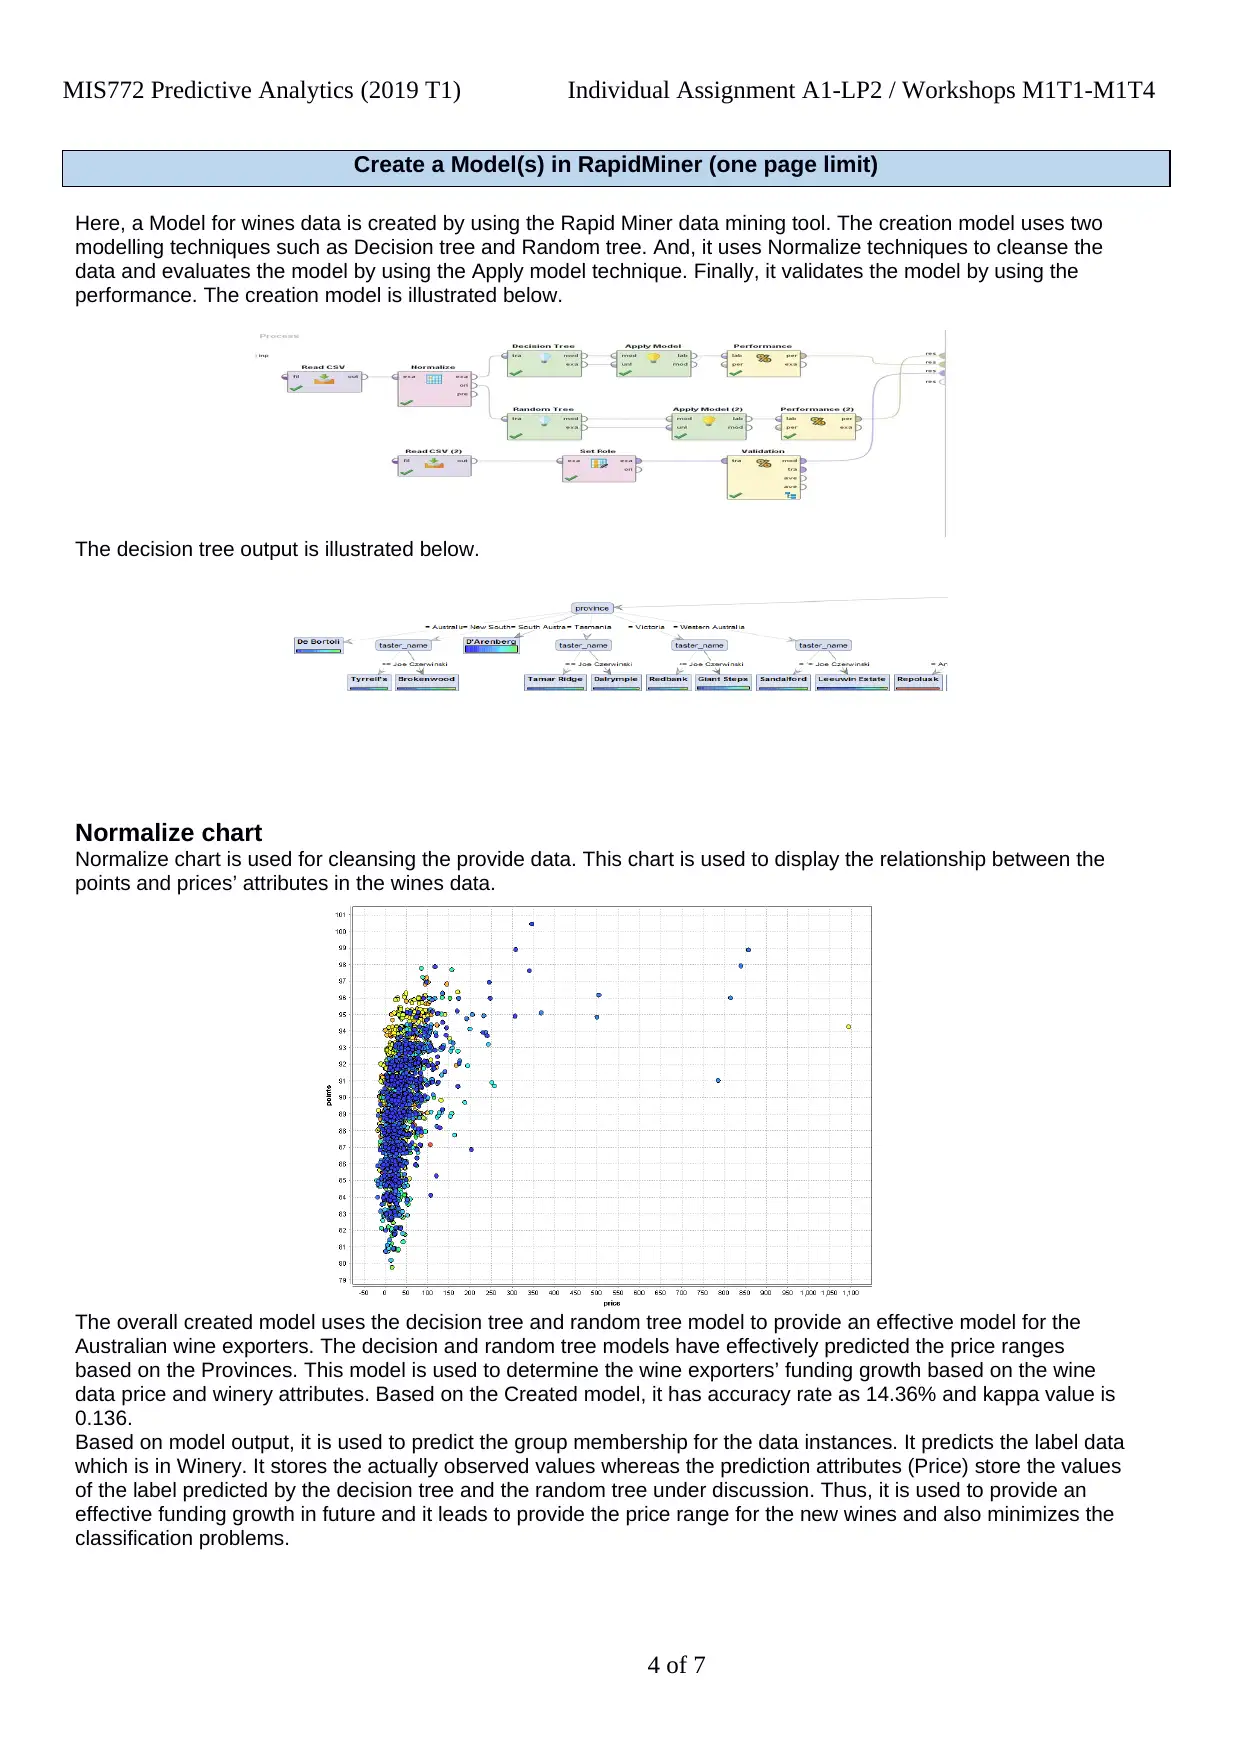
Here, a Model for wines data is created by using the Rapid Miner data mining tool. The creation model uses two
modelling techniques such as Decision tree and Random tree. And, it uses Normalize techniques to cleanse the
data and evaluates the model by using the Apply model technique. Finally, it validates the model by using the
performance. The creation model is illustrated below.
The decision tree output is illustrated below.
Normalize chart
Normalize chart is used for cleansing the provide data. This chart is used to display the relationship between the
points and prices’ attributes in the wines data.
The overall created model uses the decision tree and random tree model to provide an effective model for the
Australian wine exporters. The decision and random tree models have effectively predicted the price ranges
based on the Provinces. This model is used to determine the wine exporters’ funding growth based on the wine
data price and winery attributes. Based on the Created model, it has accuracy rate as 14.36% and kappa value is
0.136.
Based on model output, it is used to predict the group membership for the data instances. It predicts the label data
which is in Winery. It stores the actually observed values whereas the prediction attributes (Price) store the values
of the label predicted by the decision tree and the random tree under discussion. Thus, it is used to provide an
effective funding growth in future and it leads to provide the price range for the new wines and also minimizes the
classification problems.
4 of 7
Create a Model(s) in RapidMiner (one page limit)
Here, a Model for wines data is created by using the Rapid Miner data mining tool. The creation model uses two
modelling techniques such as Decision tree and Random tree. And, it uses Normalize techniques to cleanse the
data and evaluates the model by using the Apply model technique. Finally, it validates the model by using the
performance. The creation model is illustrated below.
The decision tree output is illustrated below.
Normalize chart
Normalize chart is used for cleansing the provide data. This chart is used to display the relationship between the
points and prices’ attributes in the wines data.
The overall created model uses the decision tree and random tree model to provide an effective model for the
Australian wine exporters. The decision and random tree models have effectively predicted the price ranges
based on the Provinces. This model is used to determine the wine exporters’ funding growth based on the wine
data price and winery attributes. Based on the Created model, it has accuracy rate as 14.36% and kappa value is
0.136.
Based on model output, it is used to predict the group membership for the data instances. It predicts the label data
which is in Winery. It stores the actually observed values whereas the prediction attributes (Price) store the values
of the label predicted by the decision tree and the random tree under discussion. Thus, it is used to provide an
effective funding growth in future and it leads to provide the price range for the new wines and also minimizes the
classification problems.
4 of 7
Paraphrase This Document
Need a fresh take? Get an instant paraphrase of this document with our AI Paraphraser
MIS772 Predictive Analytics (2019 T1) Individual Assignment A1-LP2 / Workshops M1T1-M1T4
Evaluate and Improve the Model(s) in RapidMiner (one page)
The created model is evaluated by using the R2 performance which is Apply model and Performance operators.
This technique is used to evaluate the created model to provide effective results for their wine data. Apply model
is one of evaluation model in the Rapid Miner. Also, the validation operator is used to evaluate the overall
performance for the created models. The cross validation is used to estimate the statistical performance of a
models. It has two sub processes such as training and testing sub processes. It takes input as training and test
sub processes. It delivers the output is based on prediction model trained on the whole example set. The
performance operator is used to evaluate the statistical performance evolution of the provided wine data. It is used
to deliver a list of performance criteria values of the classification task. This is only used for classification task;
here the two classification task are used such as Decision tree and random tree. The performance operators are
automatically determining the learning task type and calculates the most common criteria for the provided data.
The performance operator input is based on the apply model. The performance operator provides the input port
exporters as labelled as example set. The performance operator is used to deliver the performance vector. The
performance vector is used to list the performance criteria values for the provided data. It is calculated on the
basic of the label attributes which is winery and prediction attributes which is price.
The performance vector output provides the example set that was given as input is passed without changing the
output through this port. It provides that the output is based on two parameters such as Accuracy and Kappa
attributes. The accuracy parameter is used to display the percentage of predictions. The kappa parameters are
used to measure the simple percentage of correct prediction calculation and it takes into account the correct
prediction occurring by chance.
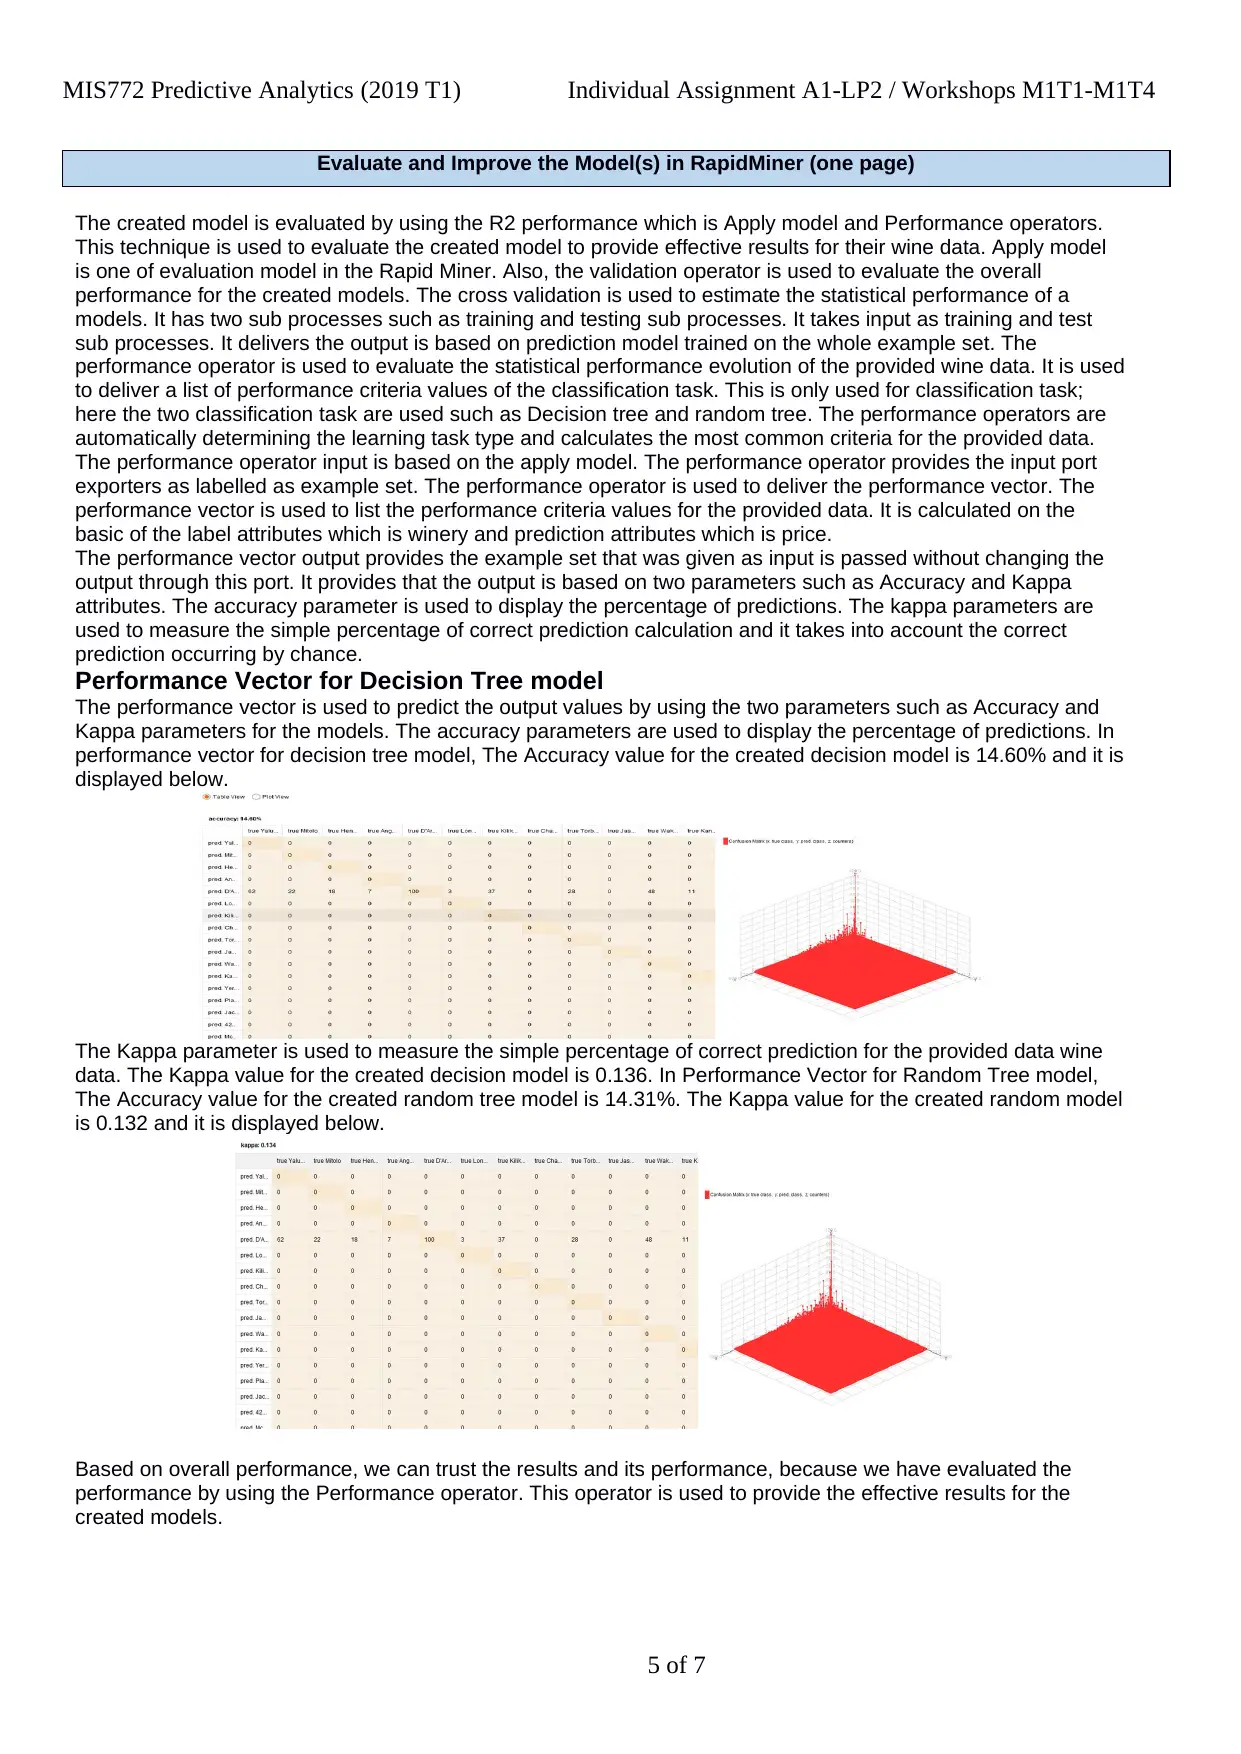
Performance Vector for Decision Tree model
The performance vector is used to predict the output values by using the two parameters such as Accuracy and
Kappa parameters for the models. The accuracy parameters are used to display the percentage of predictions. In
performance vector for decision tree model, The Accuracy value for the created decision model is 14.60% and it is
displayed below.
The Kappa parameter is used to measure the simple percentage of correct prediction for the provided data wine
data. The Kappa value for the created decision model is 0.136. In Performance Vector for Random Tree model,
The Accuracy value for the created random tree model is 14.31%. The Kappa value for the created random model
is 0.132 and it is displayed below.
Based on overall performance, we can trust the results and its performance, because we have evaluated the
performance by using the Performance operator. This operator is used to provide the effective results for the
created models.
5 of 7
Evaluate and Improve the Model(s) in RapidMiner (one page)
The created model is evaluated by using the R2 performance which is Apply model and Performance operators.
This technique is used to evaluate the created model to provide effective results for their wine data. Apply model
is one of evaluation model in the Rapid Miner. Also, the validation operator is used to evaluate the overall
performance for the created models. The cross validation is used to estimate the statistical performance of a
models. It has two sub processes such as training and testing sub processes. It takes input as training and test
sub processes. It delivers the output is based on prediction model trained on the whole example set. The
performance operator is used to evaluate the statistical performance evolution of the provided wine data. It is used
to deliver a list of performance criteria values of the classification task. This is only used for classification task;
here the two classification task are used such as Decision tree and random tree. The performance operators are
automatically determining the learning task type and calculates the most common criteria for the provided data.
The performance operator input is based on the apply model. The performance operator provides the input port
exporters as labelled as example set. The performance operator is used to deliver the performance vector. The
performance vector is used to list the performance criteria values for the provided data. It is calculated on the
basic of the label attributes which is winery and prediction attributes which is price.
The performance vector output provides the example set that was given as input is passed without changing the
output through this port. It provides that the output is based on two parameters such as Accuracy and Kappa
attributes. The accuracy parameter is used to display the percentage of predictions. The kappa parameters are
used to measure the simple percentage of correct prediction calculation and it takes into account the correct
prediction occurring by chance.
Performance Vector for Decision Tree model
The performance vector is used to predict the output values by using the two parameters such as Accuracy and
Kappa parameters for the models. The accuracy parameters are used to display the percentage of predictions. In
performance vector for decision tree model, The Accuracy value for the created decision model is 14.60% and it is
displayed below.
The Kappa parameter is used to measure the simple percentage of correct prediction for the provided data wine
data. The Kappa value for the created decision model is 0.136. In Performance Vector for Random Tree model,
The Accuracy value for the created random tree model is 14.31%. The Kappa value for the created random model
is 0.132 and it is displayed below.
Based on overall performance, we can trust the results and its performance, because we have evaluated the
performance by using the Performance operator. This operator is used to provide the effective results for the
created models.
5 of 7
MIS772 Predictive Analytics (2019 T1) Individual Assignment A1-LP2 / Workshops M1T1-M1T4
Deployment in RapidMiner (one page)
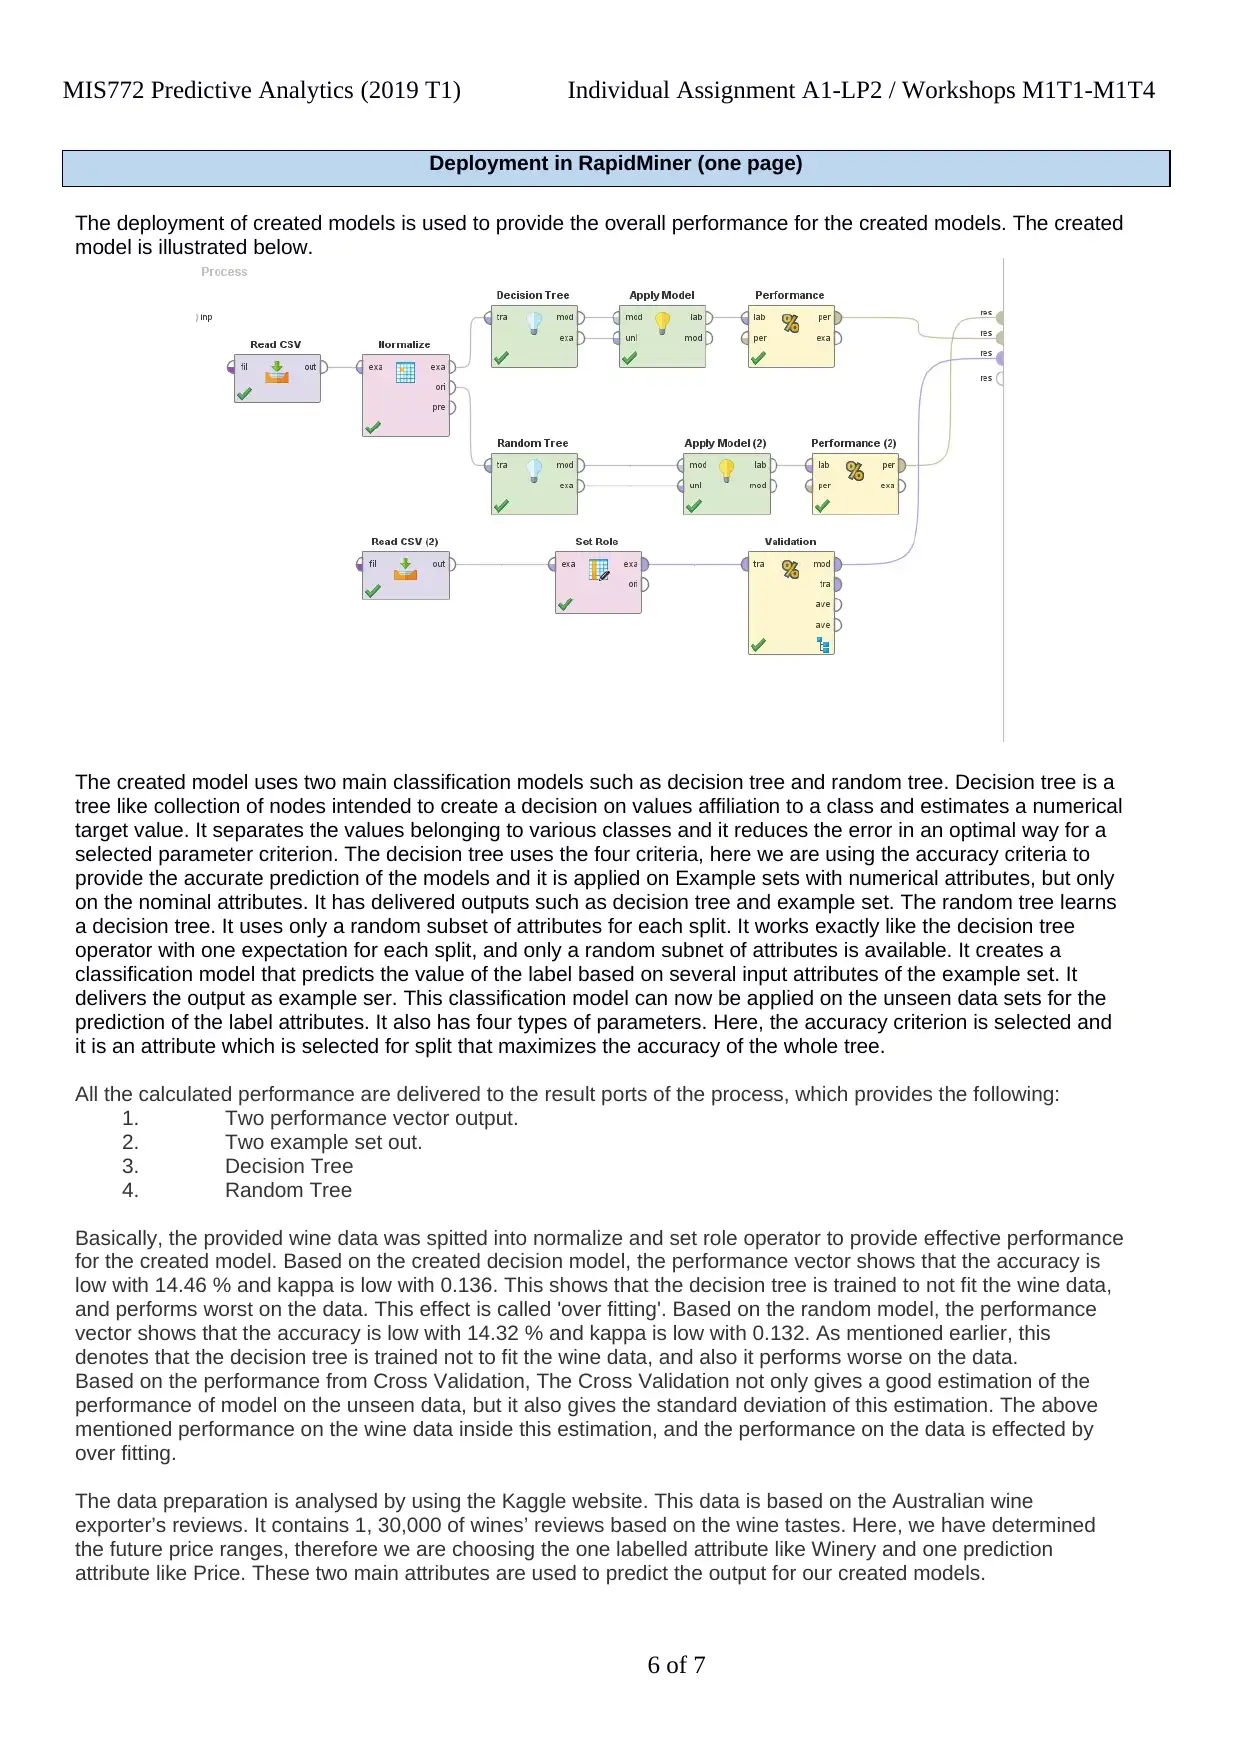
The deployment of created models is used to provide the overall performance for the created models. The created
model is illustrated below.
The created model uses two main classification models such as decision tree and random tree. Decision tree is a
tree like collection of nodes intended to create a decision on values affiliation to a class and estimates a numerical
target value. It separates the values belonging to various classes and it reduces the error in an optimal way for a
selected parameter criterion. The decision tree uses the four criteria, here we are using the accuracy criteria to
provide the accurate prediction of the models and it is applied on Example sets with numerical attributes, but only
on the nominal attributes. It has delivered outputs such as decision tree and example set. The random tree learns
a decision tree. It uses only a random subset of attributes for each split. It works exactly like the decision tree
operator with one expectation for each split, and only a random subnet of attributes is available. It creates a
classification model that predicts the value of the label based on several input attributes of the example set. It
delivers the output as example ser. This classification model can now be applied on the unseen data sets for the
prediction of the label attributes. It also has four types of parameters. Here, the accuracy criterion is selected and
it is an attribute which is selected for split that maximizes the accuracy of the whole tree.
All the calculated performance are delivered to the result ports of the process, which provides the following:
1. Two performance vector output.
2. Two example set out.
3. Decision Tree
4. Random Tree
Basically, the provided wine data was spitted into normalize and set role operator to provide effective performance
for the created model. Based on the created decision model, the performance vector shows that the accuracy is
low with 14.46 % and kappa is low with 0.136. This shows that the decision tree is trained to not fit the wine data,
and performs worst on the data. This effect is called 'over fitting'. Based on the random model, the performance
vector shows that the accuracy is low with 14.32 % and kappa is low with 0.132. As mentioned earlier, this
denotes that the decision tree is trained not to fit the wine data, and also it performs worse on the data.
Based on the performance from Cross Validation, The Cross Validation not only gives a good estimation of the
performance of model on the unseen data, but it also gives the standard deviation of this estimation. The above
mentioned performance on the wine data inside this estimation, and the performance on the data is effected by
over fitting.
The data preparation is analysed by using the Kaggle website. This data is based on the Australian wine
exporter’s reviews. It contains 1, 30,000 of wines’ reviews based on the wine tastes. Here, we have determined
the future price ranges, therefore we are choosing the one labelled attribute like Winery and one prediction
attribute like Price. These two main attributes are used to predict the output for our created models.
6 of 7
Deployment in RapidMiner (one page)
The deployment of created models is used to provide the overall performance for the created models. The created
model is illustrated below.
The created model uses two main classification models such as decision tree and random tree. Decision tree is a
tree like collection of nodes intended to create a decision on values affiliation to a class and estimates a numerical
target value. It separates the values belonging to various classes and it reduces the error in an optimal way for a
selected parameter criterion. The decision tree uses the four criteria, here we are using the accuracy criteria to
provide the accurate prediction of the models and it is applied on Example sets with numerical attributes, but only
on the nominal attributes. It has delivered outputs such as decision tree and example set. The random tree learns
a decision tree. It uses only a random subset of attributes for each split. It works exactly like the decision tree
operator with one expectation for each split, and only a random subnet of attributes is available. It creates a
classification model that predicts the value of the label based on several input attributes of the example set. It
delivers the output as example ser. This classification model can now be applied on the unseen data sets for the
prediction of the label attributes. It also has four types of parameters. Here, the accuracy criterion is selected and
it is an attribute which is selected for split that maximizes the accuracy of the whole tree.
All the calculated performance are delivered to the result ports of the process, which provides the following:
1. Two performance vector output.
2. Two example set out.
3. Decision Tree
4. Random Tree
Basically, the provided wine data was spitted into normalize and set role operator to provide effective performance
for the created model. Based on the created decision model, the performance vector shows that the accuracy is
low with 14.46 % and kappa is low with 0.136. This shows that the decision tree is trained to not fit the wine data,
and performs worst on the data. This effect is called 'over fitting'. Based on the random model, the performance
vector shows that the accuracy is low with 14.32 % and kappa is low with 0.132. As mentioned earlier, this
denotes that the decision tree is trained not to fit the wine data, and also it performs worse on the data.
Based on the performance from Cross Validation, The Cross Validation not only gives a good estimation of the
performance of model on the unseen data, but it also gives the standard deviation of this estimation. The above
mentioned performance on the wine data inside this estimation, and the performance on the data is effected by
over fitting.
The data preparation is analysed by using the Kaggle website. This data is based on the Australian wine
exporter’s reviews. It contains 1, 30,000 of wines’ reviews based on the wine tastes. Here, we have determined
the future price ranges, therefore we are choosing the one labelled attribute like Winery and one prediction
attribute like Price. These two main attributes are used to predict the output for our created models.
6 of 7
⊘ This is a preview!⊘
Do you want full access?
Subscribe today to unlock all pages.
Trusted by 1+ million students worldwide
MIS772 Predictive Analytics (2019 T1) Individual Assignment A1-LP2 / Workshops M1T1-M1T4
Further Research and Extensions in RM (one page)
Based on the classification models, effective outcomes are provided for the wine data. It delivers the expected
price range category of the wine which is newly introduced to the Australia market, and it is identified by the
decision tree model. It clearly shows the price ranges based on winery. And, all the wine tasters in the data set
trust their tasting results based on the created models. These two models are evaluated and validated the tasting
results and price ranges. To see the overall visualization of our model, the performance and cross validation
models are used. Thus, these two models are beneficial in visualization of the model’s overall performance. The
user did not conduct independent research in the area related to the analyzed data set, to determine if the
predictions are able to confirm or extend the previously published results.
7 of 7
1 out of 7
Related Documents


Your All-in-One AI-Powered Toolkit for Academic Success.
+13062052269
info@desklib.com
Available 24*7 on WhatsApp / Email
![[object Object]](/_next/static/media/star-bottom.7253800d.svg)
Unlock your academic potential
Copyright © 2020–2026 A2Z Services. All Rights Reserved. Developed and managed by ZUCOL.