Predictive Analytics Assignment A1: Zomato Data Analysis for MIS772
VerifiedAdded on 2022/10/07
|8
|2397
|12
Project
AI Summary
This assignment analyzes Zomato data, focusing on the Indian market, to understand how factors like location, cuisine, and ratings affect restaurant sales. The analysis uses data collected via the Zomato API, including restaurant details, menus, and reviews, with data exploration and preparation conducted in RapidMiner. The study omits irrelevant data like menu items and reviews. The study discovers relationships and transforms data, highlighting preferences for home delivery and fast food in Bangalore, and identifying BTM and Koramangala as areas with the highest restaurant concentrations. K-NN and decision tree models are developed to predict optimal strategies for table bookings and online ordering, with k-NN showing higher accuracy. The models are improved through cross-validation, and the analysis reveals that North Indian and Chinese cuisines are popular. The project concludes with insights into restaurant success factors, emphasizing the importance of online services and the identification of well-rated restaurants.
MIS772 Predictive Analytics (2019 T2) Individual Assignment A1 / Workshops M1T1-M1T3
Assignment A1-LP2: Classification
Student
Name
(as per record) Student No Student number
My other group members A1
Group No
As per CloudDeakin group
number
Team
Names
(as per record) Student Nos Student number
(as per record) Student number
(as per record) Student number
Exceptional Meets expectations Issues noted Improve Unacceptable
Exec
Report
Use this area to self-assess your submission
Explore
Attributes
Be realistic as we will find problems in your work that you may not be aware of
Discover
Relationships
Create
Models
Evaluate &
Improve
Provide
Solution
Research &
Extend
Brief
Comments
Read these notes as we are really trying to help you out!
Remember: If it is not in this report, it does not exist and does not get marked!
Assume that markers could miss some important aspects of your submission unless presented clearly, or
when you deviate from the structure of this template (for which you will be penalised). So be clear, number
tables, charts and screen shots used as evidence, annotate all visuals, cross-reference your analysis with
evidence.
Use the A1 Word template to prepare this report. Submit it in PDF format to avoid its accidental reformatting.
Submit all RM processes (.RMP files only – not the whole project directory or data) in a separate ZIP archive.
Only work submitted via CloudDeakin assignment box will be marked (not via email or any other way).
Ensure that the report is readable and the font is no smaller than Arial 10 points. Include only the most
relevant and significant results for your analysis and recommendations.
You will be able to submit your work as many times until deadline. We will mark the last complete submission,
i.e. the report in PDF and the ZIP-ped RapidMiner processes.
Go over this checklist: Is this your document? Does it report your work and your work only? Is this the correct
unit, assignment, year and trimester? Is your name entered above? Is the group number included and is it
correct? Are names of your group members entered as well? Are all pages included? Are all report sections
within the required page limit?
Then after the submission – check these: Was it lodged on time? Has the PDF report been submitted? Has
the Zip archive of RMP files been submitted? Can you retrieve and reopen both back from your submission
folder?
We will be checking your work for plagiarism! If any parts of your work (report, screen shots or RM
processes) bear any resemblance to another students’ work, or by you for another unit, or anything
written by others without acknowledgement (e.g. on the web), it will be treated as plagiarism.
Total
Executive summary (one page)
1 of 8
Paraphrase This Document
Need a fresh take? Get an instant paraphrase of this document with our AI Paraphraser
MIS772 Predictive Analytics (2019 T2) Individual Assignment A1 / Workshops M1T1-M1T3
The case study that is considered for this research is ZOMATO. This is a restaurant searching as well as discovering
application for the food services in India. This application is used throughout India and all over the world. This
application helps its customer to order food from its nearby restaurants instantly.
The data that has been used for this research was collected using Zomato API. The data includes detailed
information about all restaurants registered by the application. The data includes the name of the restaurants, the
locations, the cuisines, ratings as well as all other related demographics that a customer wants for visiting a
restaurant or ordering food from there. There is a unique ID for all the restaurants registered in the application.
The intention behind this analysis is to study how the sales are affected by different factors like Location, Cuisine,
Ratings, etc and what is specifically dominating in an area concentrating more towards Indian market.
2 of 8
MIS772 Predictive Analytics (2019 T2) Individual Assignment A1 / Workshops M1T1-M1T3
Data exploration and preparation in RapidMiner (one page)
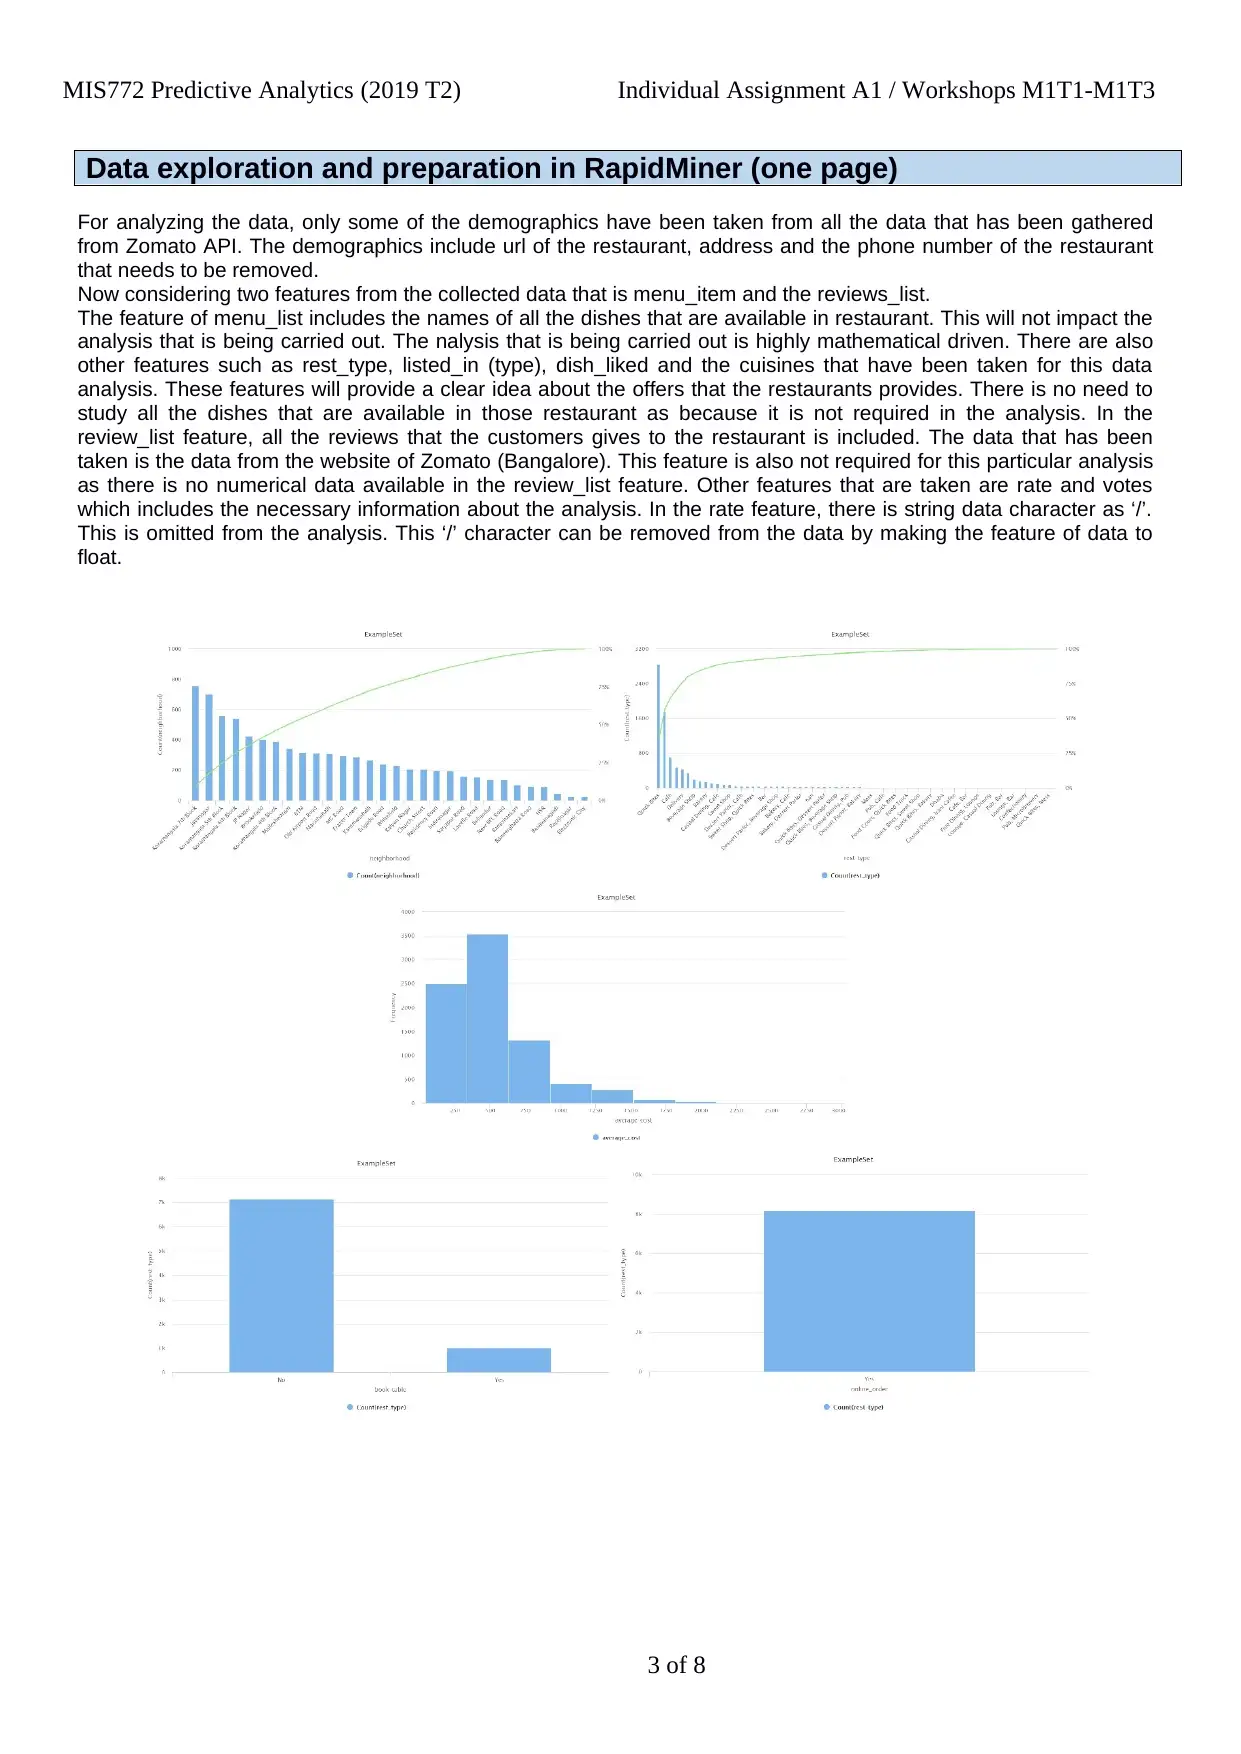
For analyzing the data, only some of the demographics have been taken from all the data that has been gathered
from Zomato API. The demographics include url of the restaurant, address and the phone number of the restaurant
that needs to be removed.
Now considering two features from the collected data that is menu_item and the reviews_list.
The feature of menu_list includes the names of all the dishes that are available in restaurant. This will not impact the
analysis that is being carried out. The nalysis that is being carried out is highly mathematical driven. There are also
other features such as rest_type, listed_in (type), dish_liked and the cuisines that have been taken for this data
analysis. These features will provide a clear idea about the offers that the restaurants provides. There is no need to
study all the dishes that are available in those restaurant as because it is not required in the analysis. In the
review_list feature, all the reviews that the customers gives to the restaurant is included. The data that has been
taken is the data from the website of Zomato (Bangalore). This feature is also not required for this particular analysis
as there is no numerical data available in the review_list feature. Other features that are taken are rate and votes
which includes the necessary information about the analysis. In the rate feature, there is string data character as ‘/’.
This is omitted from the analysis. This ‘/’ character can be removed from the data by making the feature of data to
float.
3 of 8
Data exploration and preparation in RapidMiner (one page)
For analyzing the data, only some of the demographics have been taken from all the data that has been gathered
from Zomato API. The demographics include url of the restaurant, address and the phone number of the restaurant
that needs to be removed.
Now considering two features from the collected data that is menu_item and the reviews_list.
The feature of menu_list includes the names of all the dishes that are available in restaurant. This will not impact the
analysis that is being carried out. The nalysis that is being carried out is highly mathematical driven. There are also
other features such as rest_type, listed_in (type), dish_liked and the cuisines that have been taken for this data
analysis. These features will provide a clear idea about the offers that the restaurants provides. There is no need to
study all the dishes that are available in those restaurant as because it is not required in the analysis. In the
review_list feature, all the reviews that the customers gives to the restaurant is included. The data that has been
taken is the data from the website of Zomato (Bangalore). This feature is also not required for this particular analysis
as there is no numerical data available in the review_list feature. Other features that are taken are rate and votes
which includes the necessary information about the analysis. In the rate feature, there is string data character as ‘/’.
This is omitted from the analysis. This ‘/’ character can be removed from the data by making the feature of data to
float.
3 of 8
⊘ This is a preview!⊘
Do you want full access?
Subscribe today to unlock all pages.
Trusted by 1+ million students worldwide
MIS772 Predictive Analytics (2019 T2) Individual Assignment A1 / Workshops M1T1-M1T3
Discovering Relationships and Data Transformation in RapidMiner (one page)
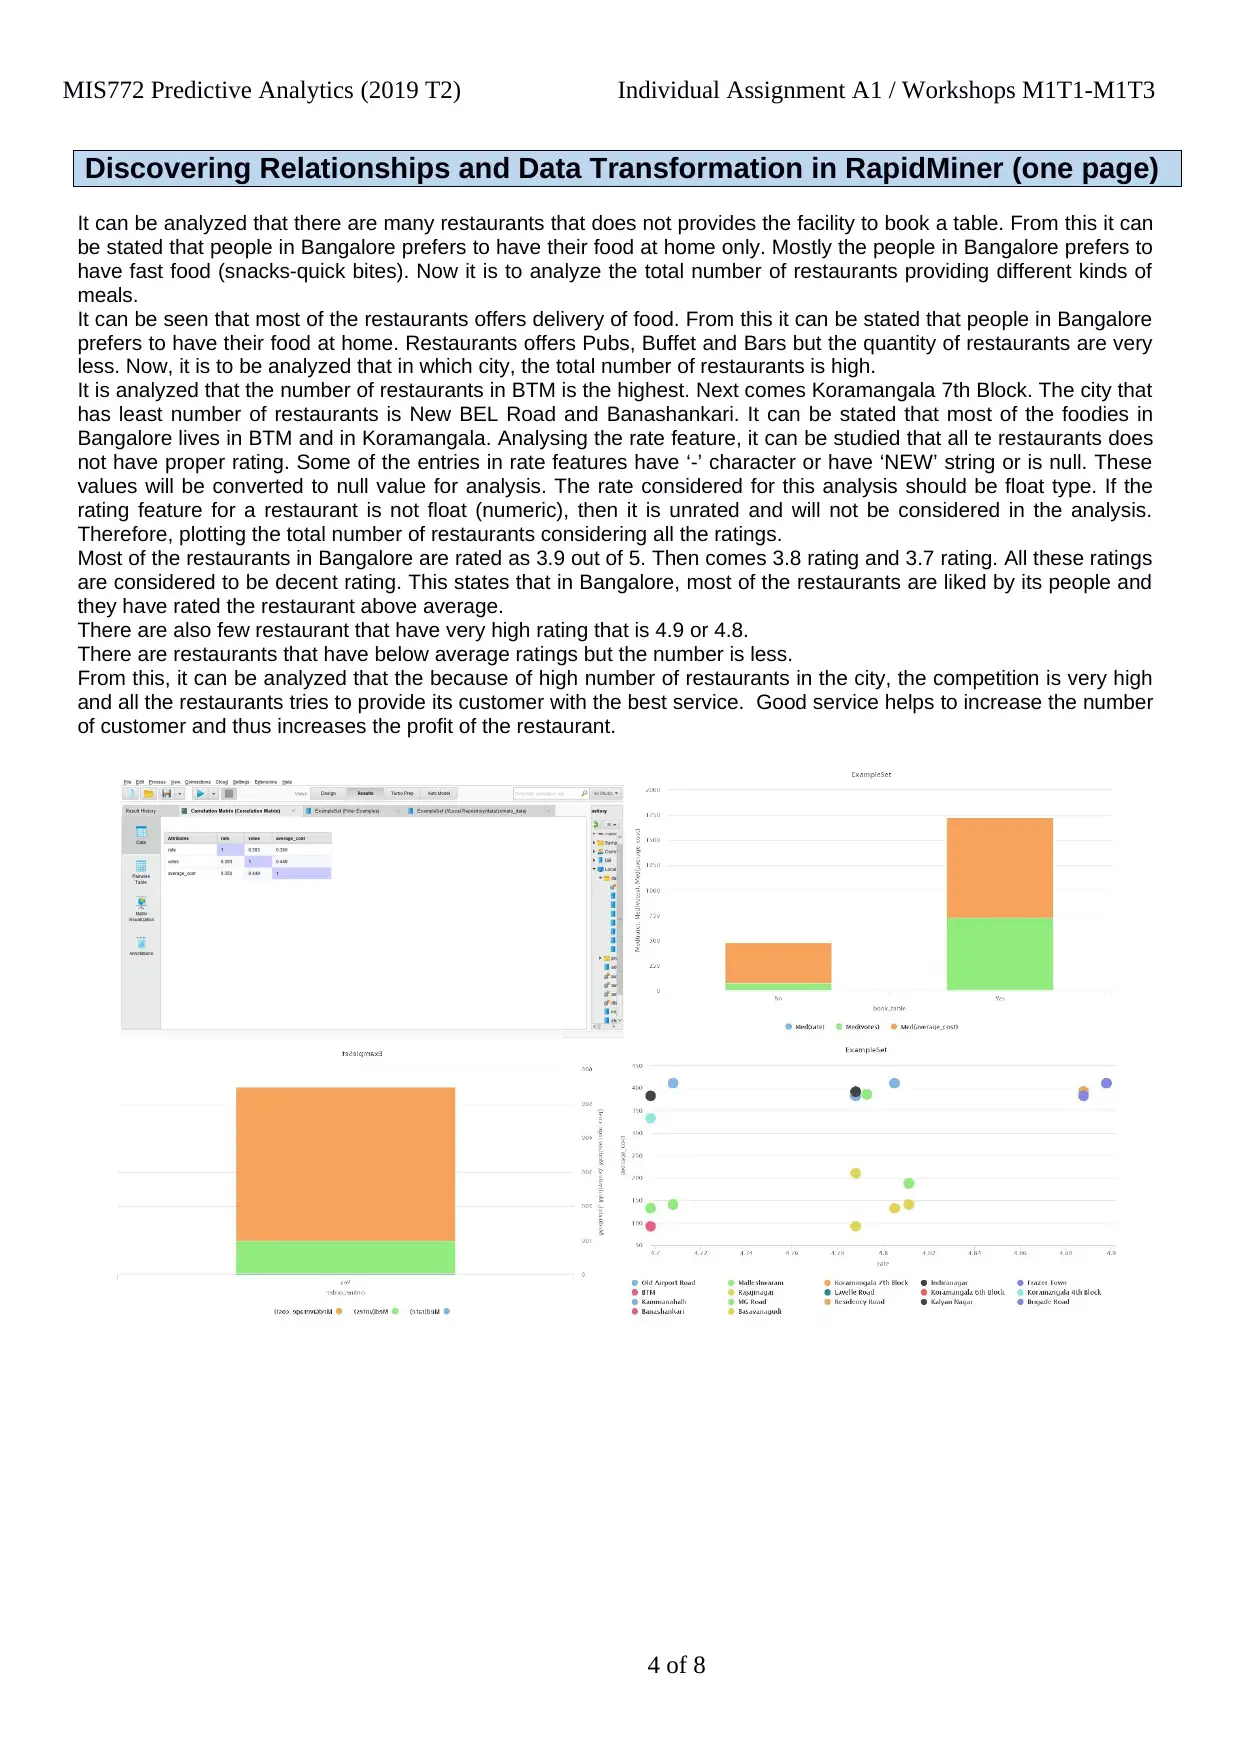
It can be analyzed that there are many restaurants that does not provides the facility to book a table. From this it can
be stated that people in Bangalore prefers to have their food at home only. Mostly the people in Bangalore prefers to
have fast food (snacks-quick bites). Now it is to analyze the total number of restaurants providing different kinds of
meals.
It can be seen that most of the restaurants offers delivery of food. From this it can be stated that people in Bangalore
prefers to have their food at home. Restaurants offers Pubs, Buffet and Bars but the quantity of restaurants are very
less. Now, it is to be analyzed that in which city, the total number of restaurants is high.
It is analyzed that the number of restaurants in BTM is the highest. Next comes Koramangala 7th Block. The city that
has least number of restaurants is New BEL Road and Banashankari. It can be stated that most of the foodies in
Bangalore lives in BTM and in Koramangala. Analysing the rate feature, it can be studied that all te restaurants does
not have proper rating. Some of the entries in rate features have ‘-’ character or have ‘NEW’ string or is null. These
values will be converted to null value for analysis. The rate considered for this analysis should be float type. If the
rating feature for a restaurant is not float (numeric), then it is unrated and will not be considered in the analysis.
Therefore, plotting the total number of restaurants considering all the ratings.
Most of the restaurants in Bangalore are rated as 3.9 out of 5. Then comes 3.8 rating and 3.7 rating. All these ratings
are considered to be decent rating. This states that in Bangalore, most of the restaurants are liked by its people and
they have rated the restaurant above average.
There are also few restaurant that have very high rating that is 4.9 or 4.8.
There are restaurants that have below average ratings but the number is less.
From this, it can be analyzed that the because of high number of restaurants in the city, the competition is very high
and all the restaurants tries to provide its customer with the best service. Good service helps to increase the number
of customer and thus increases the profit of the restaurant.
4 of 8
Discovering Relationships and Data Transformation in RapidMiner (one page)
It can be analyzed that there are many restaurants that does not provides the facility to book a table. From this it can
be stated that people in Bangalore prefers to have their food at home only. Mostly the people in Bangalore prefers to
have fast food (snacks-quick bites). Now it is to analyze the total number of restaurants providing different kinds of
meals.
It can be seen that most of the restaurants offers delivery of food. From this it can be stated that people in Bangalore
prefers to have their food at home. Restaurants offers Pubs, Buffet and Bars but the quantity of restaurants are very
less. Now, it is to be analyzed that in which city, the total number of restaurants is high.
It is analyzed that the number of restaurants in BTM is the highest. Next comes Koramangala 7th Block. The city that
has least number of restaurants is New BEL Road and Banashankari. It can be stated that most of the foodies in
Bangalore lives in BTM and in Koramangala. Analysing the rate feature, it can be studied that all te restaurants does
not have proper rating. Some of the entries in rate features have ‘-’ character or have ‘NEW’ string or is null. These
values will be converted to null value for analysis. The rate considered for this analysis should be float type. If the
rating feature for a restaurant is not float (numeric), then it is unrated and will not be considered in the analysis.
Therefore, plotting the total number of restaurants considering all the ratings.
Most of the restaurants in Bangalore are rated as 3.9 out of 5. Then comes 3.8 rating and 3.7 rating. All these ratings
are considered to be decent rating. This states that in Bangalore, most of the restaurants are liked by its people and
they have rated the restaurant above average.
There are also few restaurant that have very high rating that is 4.9 or 4.8.
There are restaurants that have below average ratings but the number is less.
From this, it can be analyzed that the because of high number of restaurants in the city, the competition is very high
and all the restaurants tries to provide its customer with the best service. Good service helps to increase the number
of customer and thus increases the profit of the restaurant.
4 of 8
Paraphrase This Document
Need a fresh take? Get an instant paraphrase of this document with our AI Paraphraser
MIS772 Predictive Analytics (2019 T2) Individual Assignment A1 / Workshops M1T1-M1T3
Create a Model(s) in RapidMiner (one page limit)
The analysis of Zomato food data start with developing models. Here, the analyst has adopted k-NN and Decision
tree model to analyse the same. To understand the application of both processes, the analyst has built an integrated
model. It starts with revised dataset as mentioned in the previous stage. As a first step, the analyst has included “Set
Role” attributes from Rapid Miner. Since, the aim was to understand what strategy would be the correct one for table
booking and online ordering for a new restaurant and for an already established restaurant, the analyst tried to
classify the given data set with the help of these above mentioned models. The next step was to develop two
process for two models. Since, both model required same data set, the analyst has used “Multiply” operator from
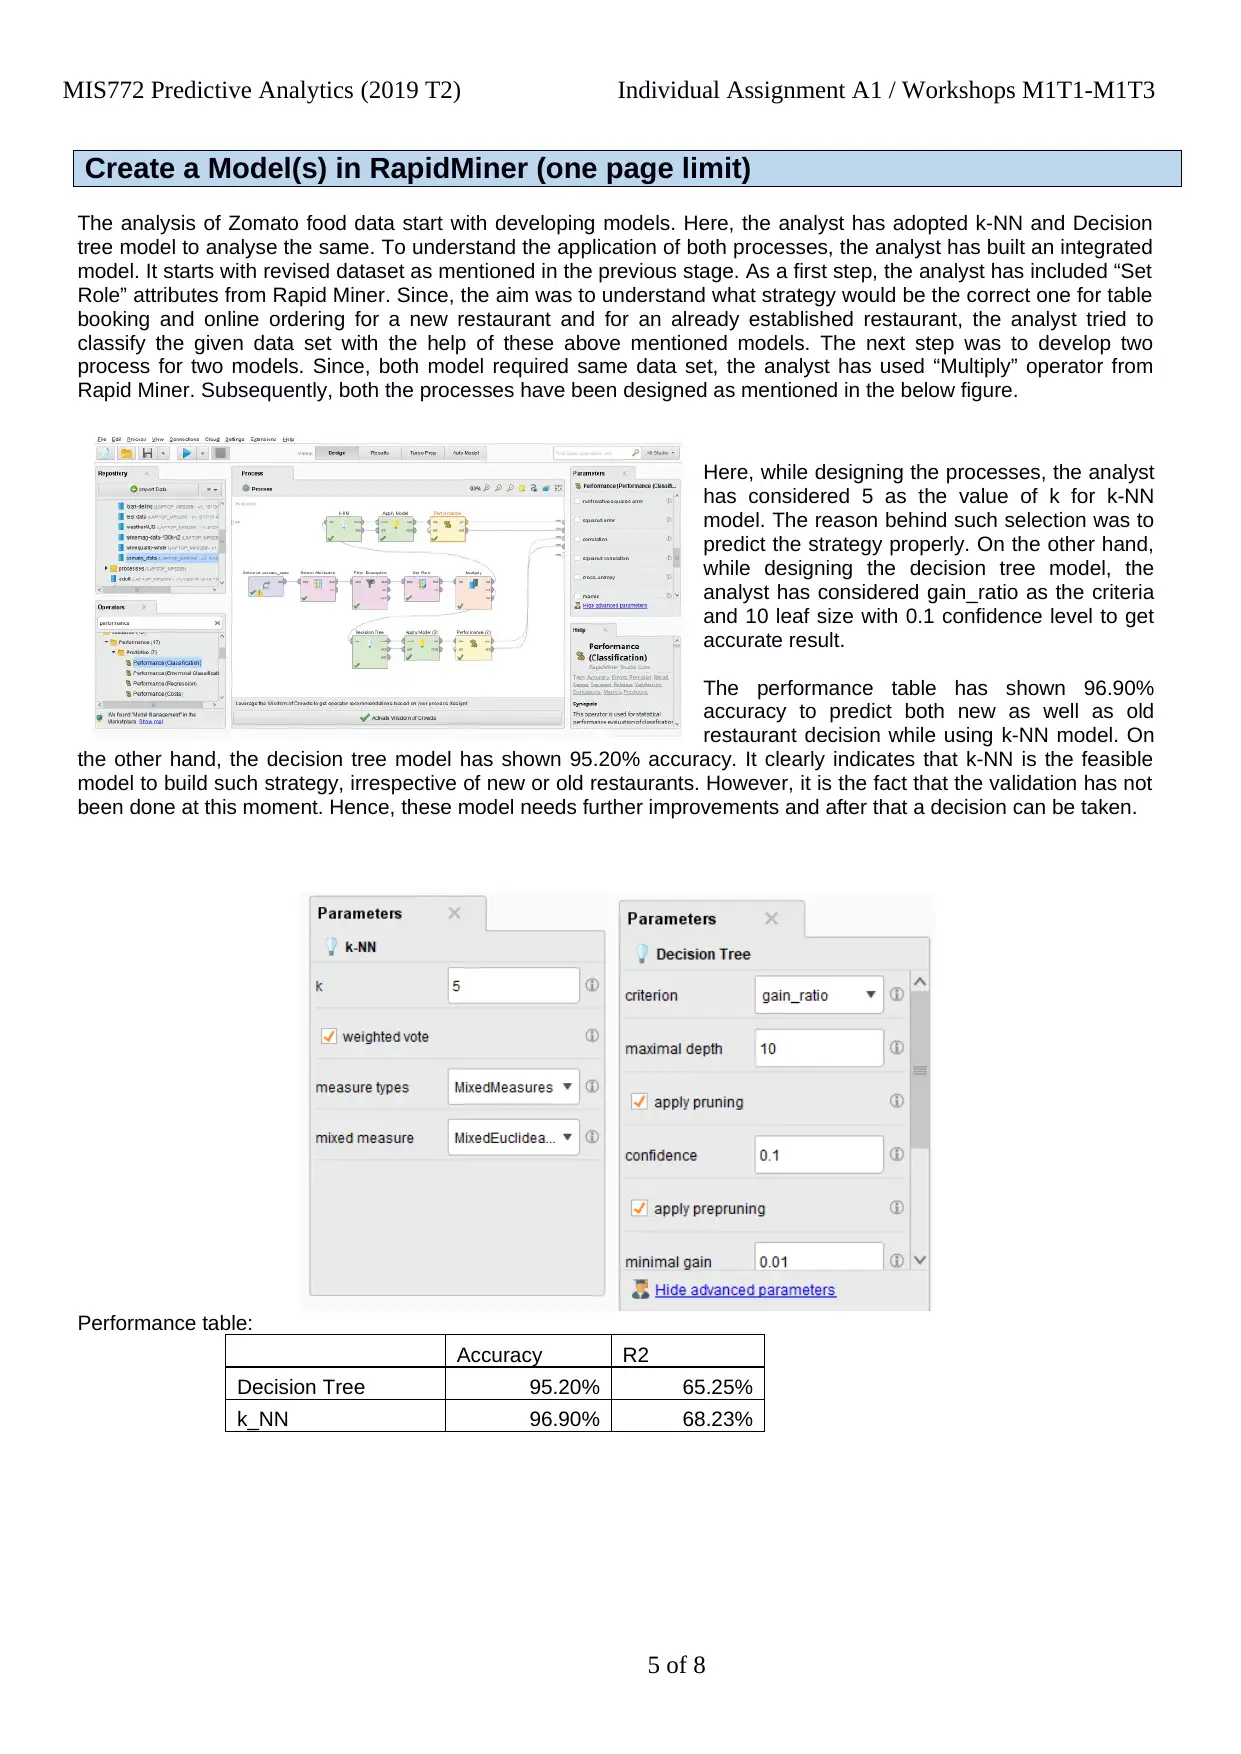
Rapid Miner. Subsequently, both the processes have been designed as mentioned in the below figure.
Here, while designing the processes, the analyst
has considered 5 as the value of k for k-NN
model. The reason behind such selection was to
predict the strategy properly. On the other hand,
while designing the decision tree model, the
analyst has considered gain_ratio as the criteria
and 10 leaf size with 0.1 confidence level to get
accurate result.
The performance table has shown 96.90%
accuracy to predict both new as well as old
restaurant decision while using k-NN model. On
the other hand, the decision tree model has shown 95.20% accuracy. It clearly indicates that k-NN is the feasible
model to build such strategy, irrespective of new or old restaurants. However, it is the fact that the validation has not
been done at this moment. Hence, these model needs further improvements and after that a decision can be taken.
Performance table:
Accuracy R2
Decision Tree 95.20% 65.25%
k_NN 96.90% 68.23%
5 of 8
Create a Model(s) in RapidMiner (one page limit)
The analysis of Zomato food data start with developing models. Here, the analyst has adopted k-NN and Decision
tree model to analyse the same. To understand the application of both processes, the analyst has built an integrated
model. It starts with revised dataset as mentioned in the previous stage. As a first step, the analyst has included “Set
Role” attributes from Rapid Miner. Since, the aim was to understand what strategy would be the correct one for table
booking and online ordering for a new restaurant and for an already established restaurant, the analyst tried to
classify the given data set with the help of these above mentioned models. The next step was to develop two
process for two models. Since, both model required same data set, the analyst has used “Multiply” operator from
Rapid Miner. Subsequently, both the processes have been designed as mentioned in the below figure.
Here, while designing the processes, the analyst
has considered 5 as the value of k for k-NN
model. The reason behind such selection was to
predict the strategy properly. On the other hand,
while designing the decision tree model, the
analyst has considered gain_ratio as the criteria
and 10 leaf size with 0.1 confidence level to get
accurate result.
The performance table has shown 96.90%
accuracy to predict both new as well as old
restaurant decision while using k-NN model. On
the other hand, the decision tree model has shown 95.20% accuracy. It clearly indicates that k-NN is the feasible
model to build such strategy, irrespective of new or old restaurants. However, it is the fact that the validation has not
been done at this moment. Hence, these model needs further improvements and after that a decision can be taken.
Performance table:
Accuracy R2
Decision Tree 95.20% 65.25%
k_NN 96.90% 68.23%
5 of 8
MIS772 Predictive Analytics (2019 T2) Individual Assignment A1 / Workshops M1T1-M1T3
Evaluate and Improve the Model(s) in RapidMiner (one page)
As mentioned in the previous step, the analyst has improved the model by introducing cross validation operator and
tried to measure the effectiveness using, accuracy, classification error, and kappa, R2, correlation, and AUC curve.
As an improvement strategy, the cross validation operator has helped the analyst to perform improvements on both
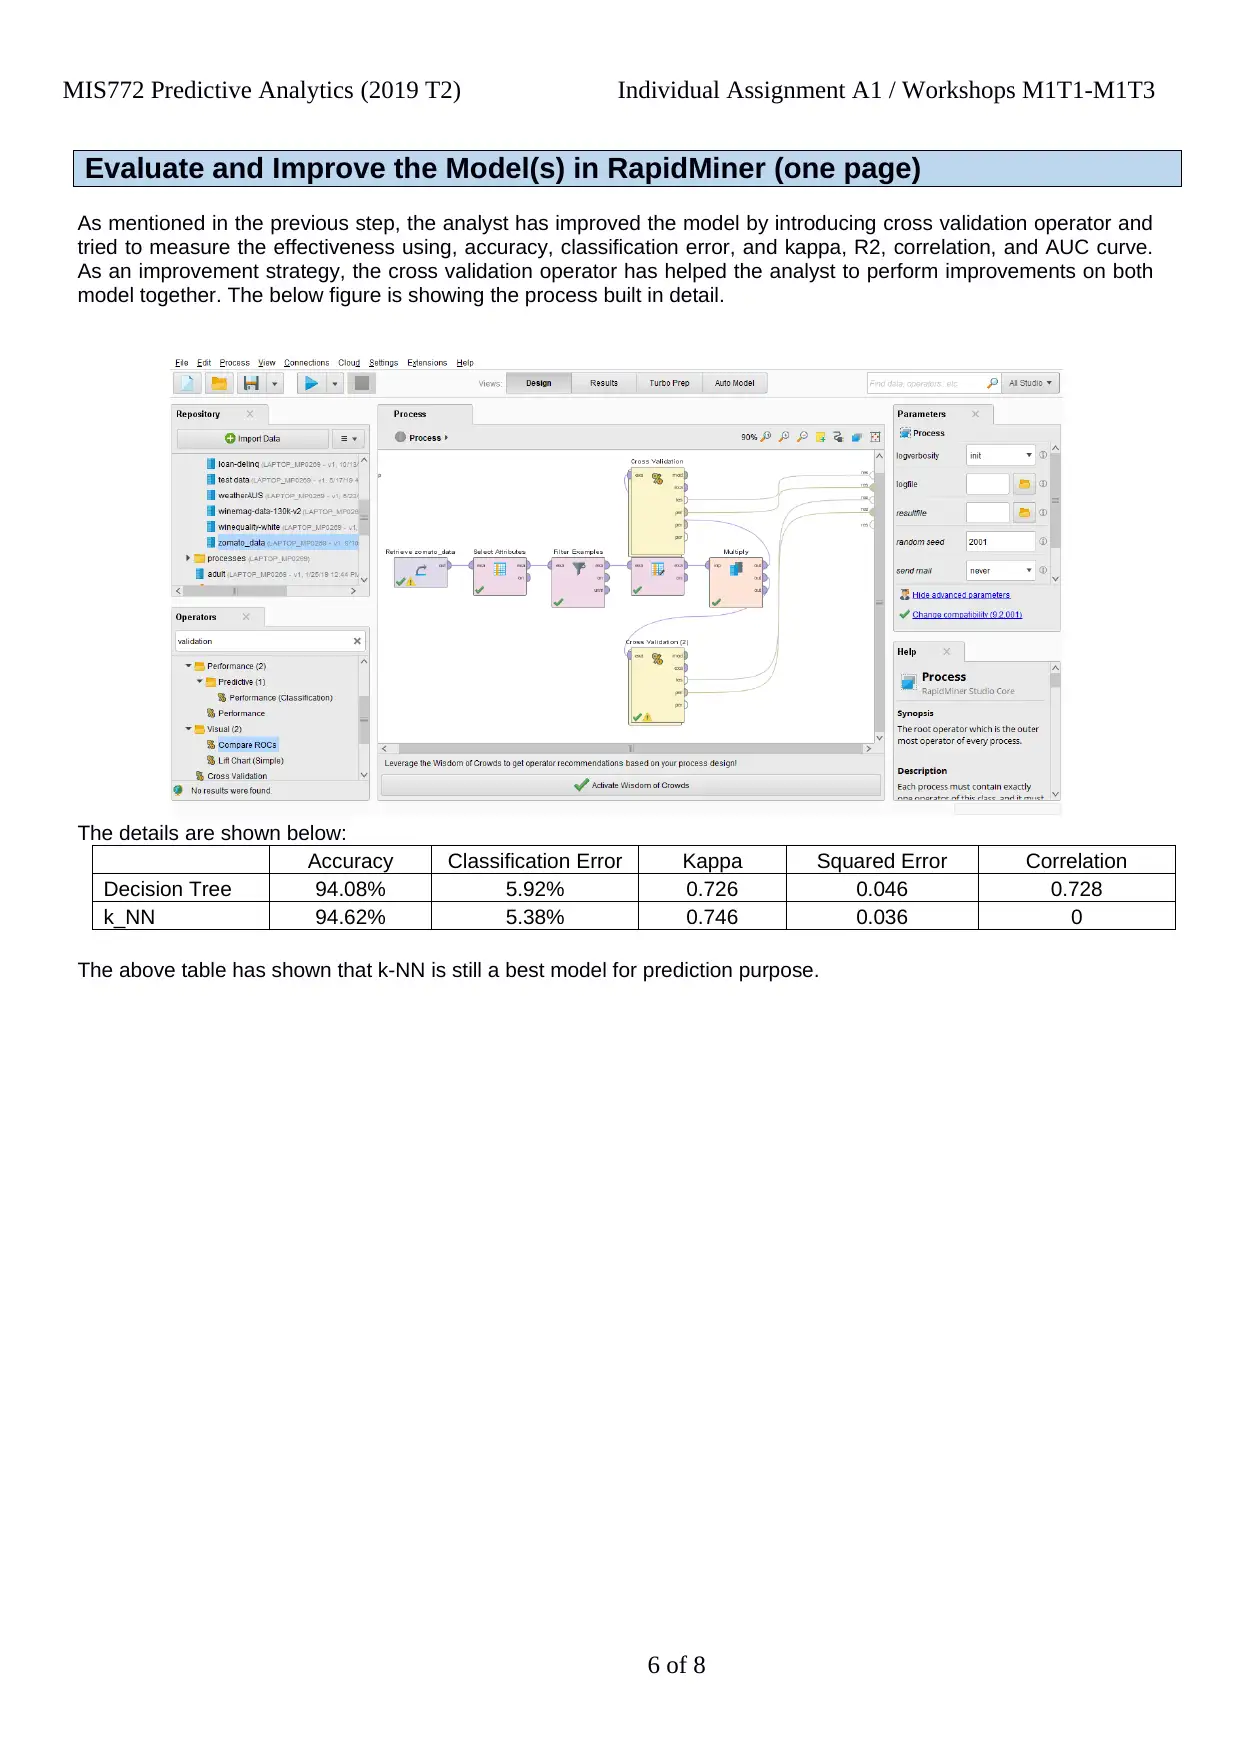
model together. The below figure is showing the process built in detail.
The details are shown below:
Accuracy Classification Error Kappa Squared Error Correlation
Decision Tree 94.08% 5.92% 0.726 0.046 0.728
k_NN 94.62% 5.38% 0.746 0.036 0
The above table has shown that k-NN is still a best model for prediction purpose.
6 of 8
Evaluate and Improve the Model(s) in RapidMiner (one page)
As mentioned in the previous step, the analyst has improved the model by introducing cross validation operator and
tried to measure the effectiveness using, accuracy, classification error, and kappa, R2, correlation, and AUC curve.
As an improvement strategy, the cross validation operator has helped the analyst to perform improvements on both
model together. The below figure is showing the process built in detail.
The details are shown below:
Accuracy Classification Error Kappa Squared Error Correlation
Decision Tree 94.08% 5.92% 0.726 0.046 0.728
k_NN 94.62% 5.38% 0.746 0.036 0
The above table has shown that k-NN is still a best model for prediction purpose.
6 of 8
⊘ This is a preview!⊘
Do you want full access?
Subscribe today to unlock all pages.
Trusted by 1+ million students worldwide
MIS772 Predictive Analytics (2019 T2) Individual Assignment A1 / Workshops M1T1-M1T3
Deployment in RapidMiner (one page)
It can be seen that North Indian food is offered by most number of eateries. This merits talking about, as Bangalore
is arranged in South India but then individuals there like to eat North Indian food. This can be because of the way
that was examined in the absolute starting point of this article individuals from a wide range of foundations dwell in
Bangalore, henceforth it can be concluded that North Indian and Chinese served by more number of cafés than
South Indian. Additionally, on the off chance that if one is an Indian than he/she may know the way that numerous
Indians like to eat Chinese. Note that cooking styles highlight contain less remarkable qualities when thinking about
the foods (for example North Indian, Chinese, South Indian and so on), anyway it contains different mixes of them.
Consequently, it can be stated that there are less number of eateries serving just North Indian + Chinese +
Continental + Biryani.
The most sold food are the Indian cooking however the very evaluated cooking are the American ones which can be
a solid zone for Zomato to develop. Individuals rate larger part cafés "Normal" or have not appraised so this can't be
considered as a solid factor to examine the achievement of an eatery. Eateries which give administrations like
booking table on the web and requesting on the web can have a higher shot of accomplishment contrasted with
others. We reason some extraordinary outcomes like which city has the most number of cafés and consequently
most noteworthy number of foodies, we likewise observed what city has high number of well-appraised eateries,
what all cooking styles are for the most part favoured by individuals and so forth. We even got ourselves some
extraordinary eateries and some not very good ones too.
7 of 8
Paraphrase This Document
Need a fresh take? Get an instant paraphrase of this document with our AI Paraphraser
MIS772 Predictive Analytics (2019 T2) Individual Assignment A1 / Workshops M1T1-M1T3
Further Research and Extensions in RM (one page)
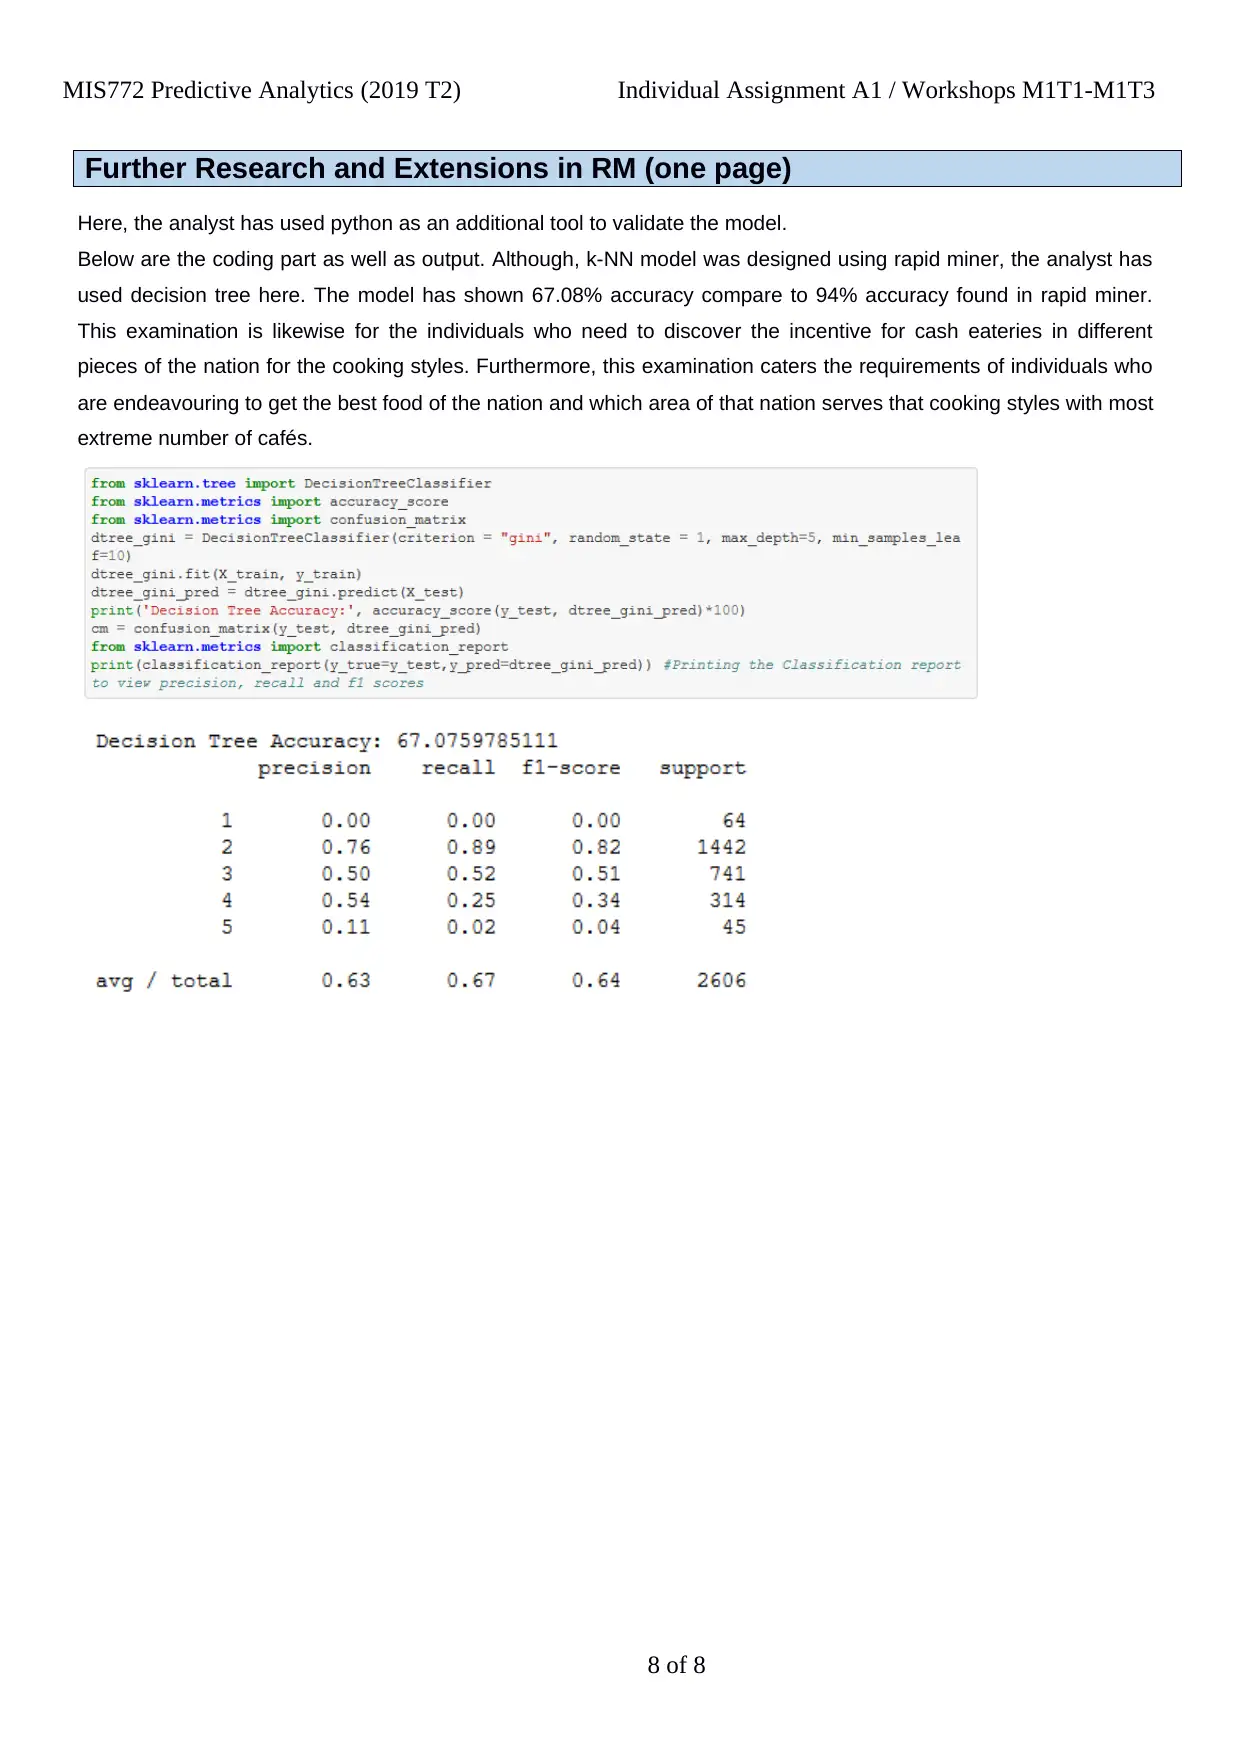
Here, the analyst has used python as an additional tool to validate the model.
Below are the coding part as well as output. Although, k-NN model was designed using rapid miner, the analyst has
used decision tree here. The model has shown 67.08% accuracy compare to 94% accuracy found in rapid miner.
This examination is likewise for the individuals who need to discover the incentive for cash eateries in different
pieces of the nation for the cooking styles. Furthermore, this examination caters the requirements of individuals who
are endeavouring to get the best food of the nation and which area of that nation serves that cooking styles with most
extreme number of cafés.
8 of 8
Further Research and Extensions in RM (one page)
Here, the analyst has used python as an additional tool to validate the model.
Below are the coding part as well as output. Although, k-NN model was designed using rapid miner, the analyst has
used decision tree here. The model has shown 67.08% accuracy compare to 94% accuracy found in rapid miner.
This examination is likewise for the individuals who need to discover the incentive for cash eateries in different
pieces of the nation for the cooking styles. Furthermore, this examination caters the requirements of individuals who
are endeavouring to get the best food of the nation and which area of that nation serves that cooking styles with most
extreme number of cafés.
8 of 8
1 out of 8
Related Documents


Your All-in-One AI-Powered Toolkit for Academic Success.
+13062052269
info@desklib.com
Available 24*7 on WhatsApp / Email
![[object Object]](/_next/static/media/star-bottom.7253800d.svg)
Unlock your academic potential
Copyright © 2020–2026 A2Z Services. All Rights Reserved. Developed and managed by ZUCOL.