Financial Analysis of Premier Investment Limited (Finance Module)
VerifiedAdded on  2022/12/29
|12
|1999
|87
Report
AI Summary
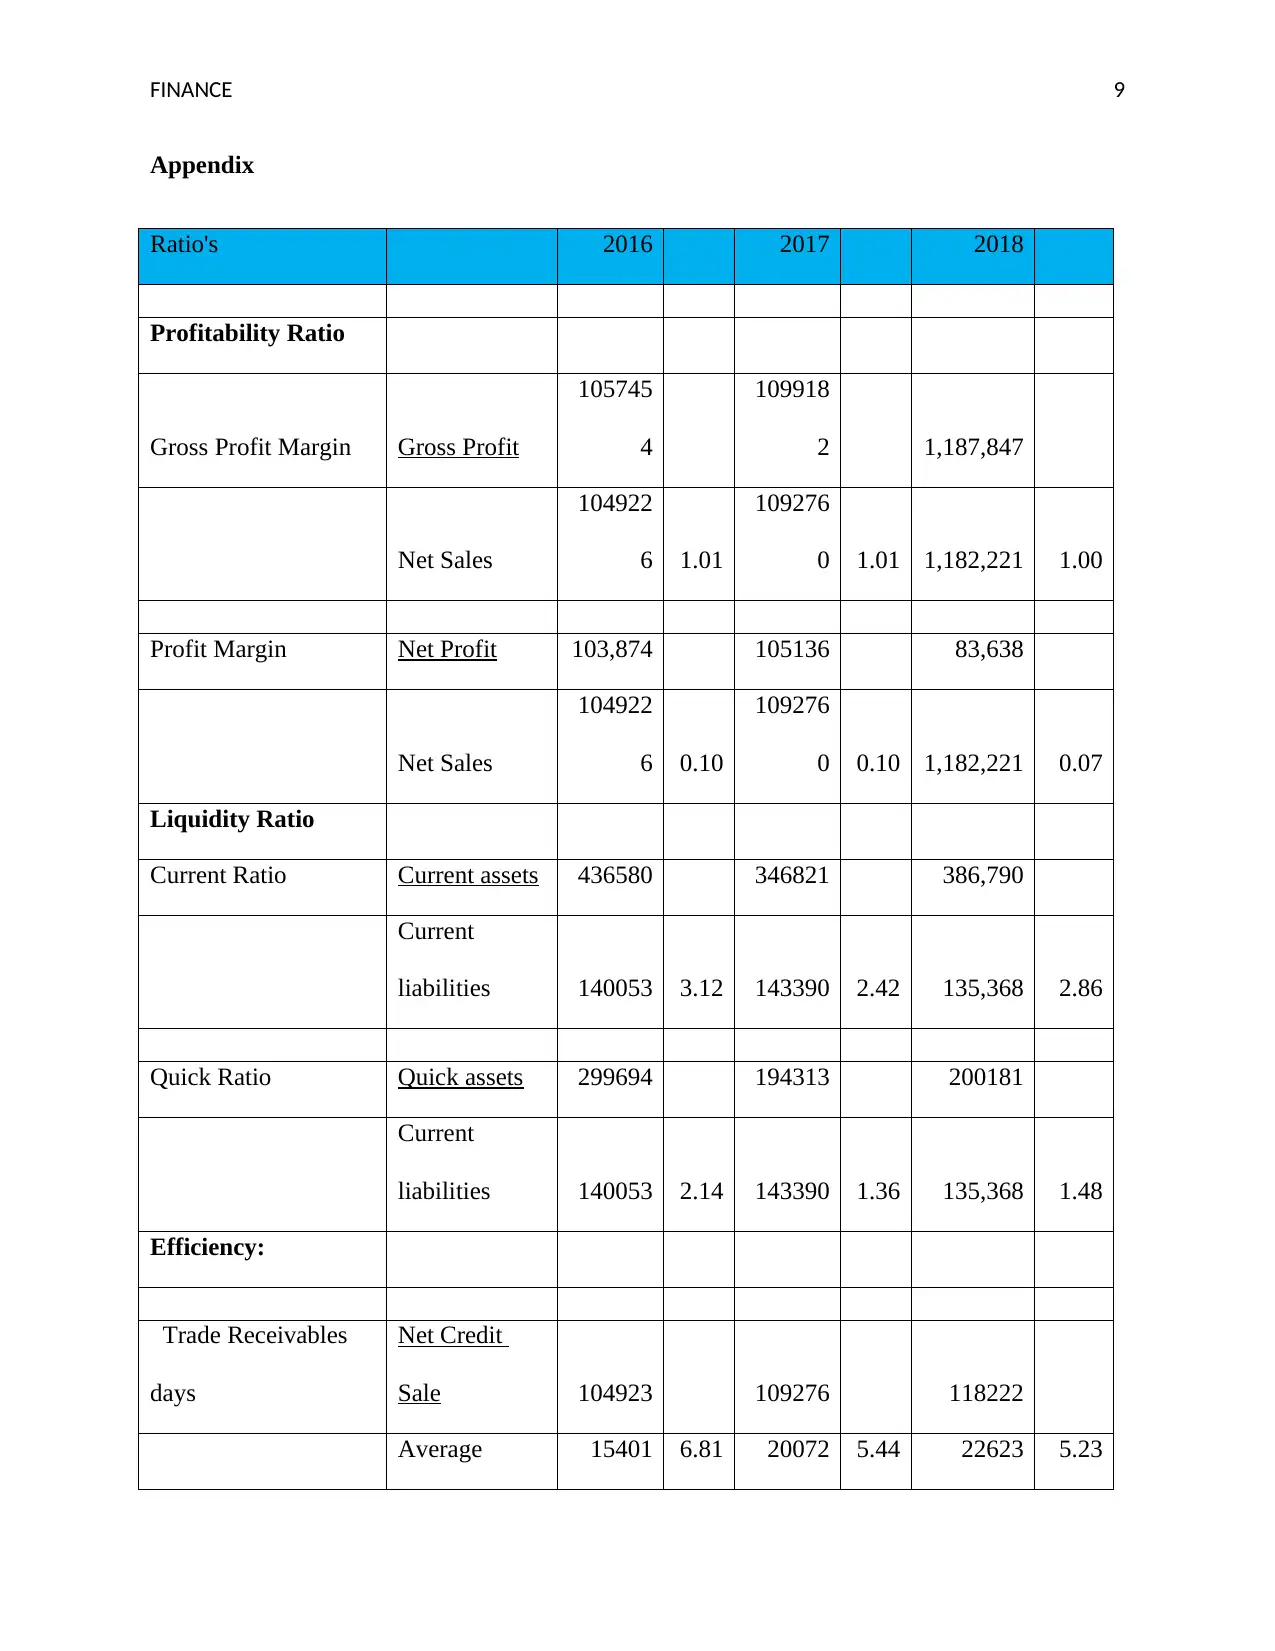
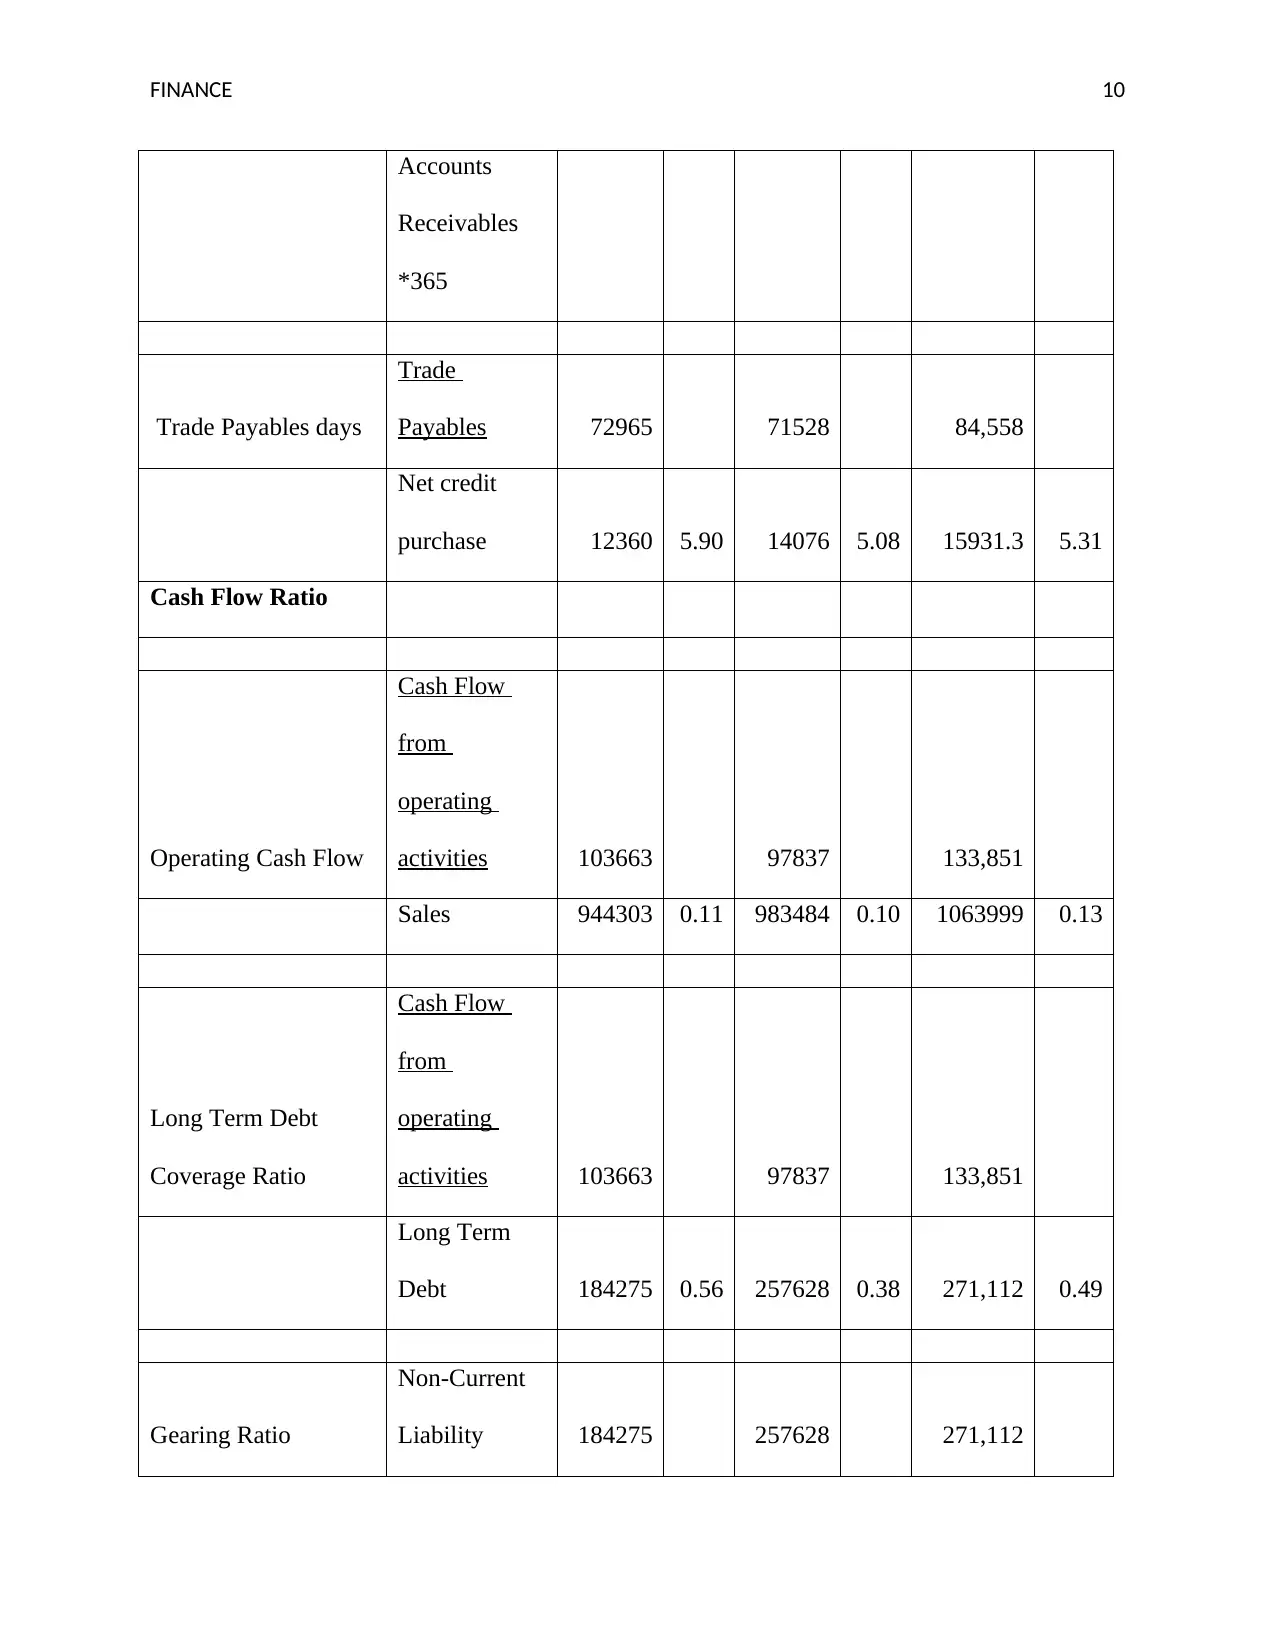
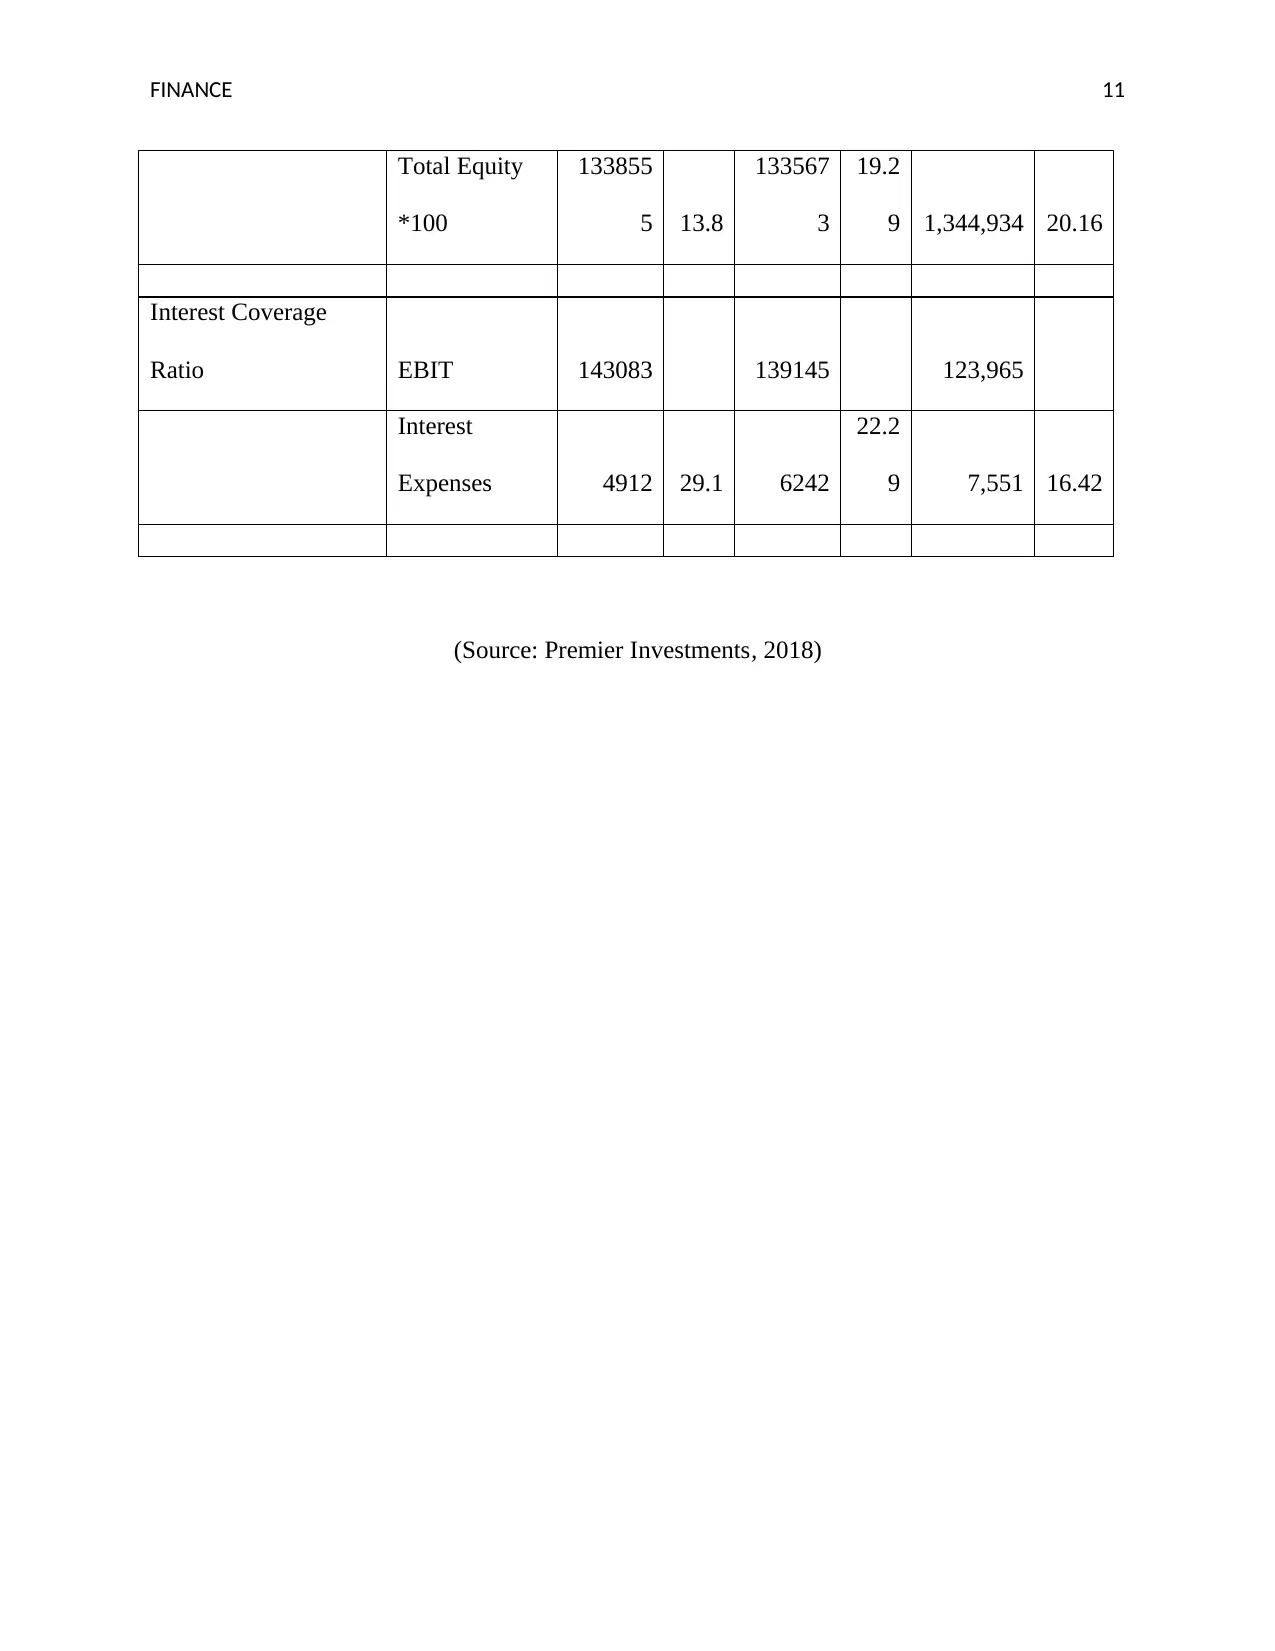
This report presents a financial analysis of Premier Investment Limited, evaluating its performance based on financial statements from 2016 to 2018. The analysis includes profitability ratios (gross profit margin, profit margin), liquidity ratios (current ratio, quick ratio), efficiency ratios (trade receivables, payables), cash flow statements, gearing ratios, and interest coverage ratios. The report highlights the company's increasing net profit and global expansion, with a focus on the impact of these factors on its financial stability and market position. The analysis uses the financial statements and annual reports to assess the company's ability to manage its short-term and long-term obligations, utilize its assets efficiently, and generate earnings relative to its revenue. The report concludes that Premier Investment Limited demonstrates financial stability, with positive trends in net profit and employee relations.

Financial Analysis
Paraphrase This Document
Need a fresh take? Get an instant paraphrase of this document with our AI Paraphraser

FINANCE 1
Executive Summary
The main aim of this report is to learn the concept of financial analysis of the position of the
company. The financial ratio of the company has been evaluated to analyze the financial position
of the organization. As per the evaluation of Premier Investment Limited, it is observed that the
company can grow the business at the international level. The net profit of the company is
increasing which indicates that it has higher level of stability in the market. As per the non-
financial information, the company grows at the global level due to which the sales value is
increasing.

FINANCE 2
Contents
Company and Industry Background............................................................................................................3
Footnotes for calculating ratios:..................................................................................................................3
Assessment of other relevant information...................................................................................................6
Conclusion...................................................................................................................................................7
References...................................................................................................................................................8
⊘ This is a preview!⊘
Do you want full access?
Subscribe today to unlock all pages.

Trusted by 1+ million students worldwide

FINANCE 3
Company and Industry Background
Premier Investment Limited is an Australian based company which operates the business in two
segments such as investment and consumer products The Company currently retail conglomerate
and also holds a 28.06% stake in electrical consumer’s products manufacturer Breville Group
Limited. It was founded by the Kimberly Family which is opened in Chapel Street Melbourne in
the year 1970. There are 6500 people that work with the company to operate with the seven
unique brands.
Footnotes for calculating ratios:
Financial Analysis is the process of evaluating the budgets, projects and the other financial
statements of the organization to evaluate the financial position and stability. In this section of
the report, the analysis has been done by evaluating the different ratios (Robinson, Henry, Pirie,
and Broihahn, 2015). Financial statements of Premier Investment were prepared accurately as
per the understanding of financial accountant. The financial statements are used while evaluating
the ratios such as comprehensive income statement, balance sheet and cash flow statement.
There are different ratio’s has been evaluated by using the financial statements below:
Profitability Ratio:
Profitability ratio of the company defines that the company ability position to generate the
earnings relative to its revenue, operating cost, balance sheets and the other financial statements.
The profitability ratio indicates that the position of the Premier Investment is constant from the
last three years such as 2016, 2017, and 2018. The profitability ratio of the company contains the
gross profit margin and profit margin ratio. As per the evaluation of Gross profit margin, it has
Paraphrase This Document
Need a fresh take? Get an instant paraphrase of this document with our AI Paraphraser

FINANCE 4
been seen that the gross profit ratio is constant such as 1.01, 1.01 and 1.00 from the last three
years 2016, 2017 and 2018. The net sale of the company is increasing with the coming years
such as 1049226, 1092760 and 118222 due to which the gross profit is increasing. The net profit
of the company is increasing which is beneficial (Grant, 2016). It is observed that the net profit
of the company is fluctuated with the amount such as it is 103874 in the year 2016 increasing
with the 105136 in the year 2017 and decreasing in the year 2018 with the amount of 83638.
Profit Margin ratio of the company is decreasing in the year 2018 from the year 2016 and 2017.
In the year 2016 and 2017, the profit margin ratio of the company is constant with the percentage
of 0.10 but in the year 2018, the ratio is decreasing with 0.7 percent. In the initially year, the
company more focuses on the expenses due to which it earns profit but in the year 2018, the
profit will be decreases (Williams, and Dobelman, 2017).
Liquidity Ratio:
Liquidity Ratio states that the capacity of the company to pay its all short obligations. Liquidity
ratio contains current and quick ratio. As per the evaluation of ratios, it states that the capability
of the company is fluctuated with the increasing or decreasing rate from the last three years
2016, 2017, and 2018. The current ratio of the company states that the company ability to pay the
shot terms loan by unitizing the current assets. The current ratio of Premiere Investment is
fluctuating such as 3.12, 2.14 and 2.86 in the year 2016, 2017, and 2018 respectively. The quick
ratio of the company is also fluctuated as per the current ratio. In the year 2018, the quick ratio of
the company is increasing from 2017 which indicated that the company has the capability to pay
its all short term obligations (Premier Investments, 2017).
Efficiency Ratio:

FINANCE 5
Efficiency Ratio states the capacity and ability of the company in utilizing the assets to pay its all
liabilities. The efficiency ratio of the company includes the trade receivables, and payables.
Trade receivable days refers the time in which the company collects the amount of money from
its debtors and trade payables refers the time in which the company can pay the credit amount.
According to the calculation of trade receivable ratio of Premier Investment, it is observed that
the number of collecting days is decreasing which is beneficial for the company. In three years,
the company number of day of collecting the own money is decreasing such as 6.81, 5.44, 5.23
in 2016, 2017 and 2018 respectively (Premier Investments, 2016). It is good that the company
can collect the money from debtors quickly due to which it is able to pay the liabilities. Trade
Payable days indicate that the company pays the amount in more days as compare to previous
year 2017. In the year 2017 and 2018, the ratio is 5.08 and 5.31 which is increasing and it
indicates that the company pays their amount in more days as compare to previous year.
Cash Flow Statement
Cash Flow Statement refers the inflow and outflow of the money from the company. It is
observed that the Premier Investments operates the business effectively and more focuses in the
business in the year 2018. Operating incomes of the company is increasing from previous year
2017 by 133581 in the year 2018. The long term debt of the company is also increasing in the
year 2016, 2017 and 2018 with the amount 0.56, 0.38 and 0.49 respectively. It is not favorable
for the company that the amount of long term debt is increasing as it affects the financial position
of the organization.
Gearing Ratio:
⊘ This is a preview!⊘
Do you want full access?
Subscribe today to unlock all pages.

Trusted by 1+ million students worldwide

FINANCE 6
Gearing ratio states the financial leverage that demonstrates the degree of firms operation that are
funded by equity capital versus debt financing. The gearing ratio of the company is increasing
year by year in the last three years such as 13.8, 19.29 and 20.16. The amount of total equity is
increasing which reflects that the company is able to increasing their fund and also invests in
different ways. But the non-current liability of the company is increasing which states that the
company is weak in paying the long term liabilities (DeFusco, McLeavey, Pinto, Runkle, and
Anson, 2015).
Interest Coverage Ratio:
Interest Coverage Ratio is also a debt and profitability ratio which is evaluated to determine the
company pay interest on its outstanding debt. The interest coverage ratio of the company is
decreasing from the three years which indicates that the liability of the organization is
decreasing. It is not beneficial for the company to reduce its liability as it directly affects the net
profit. The earning of the company is decreasing with the increasing interest expenses. The
interest an expense of the company is increasing due to which the net profit of the company is
reduces.
Assessment of other relevant information
The company operates in the different areas such as Australia, Malaysia and the others at the
global level. The company opened the 52 new stores globally in the year 2018 from which the
sales is increasing with the $19 million to $293 million (Premier Investment, 2018).
Paraphrase This Document
Need a fresh take? Get an instant paraphrase of this document with our AI Paraphraser

FINANCE 7
The company is highly committed towards the long term goals of delivering the sustainable
value. It attracts, retain and motivate the employees those are highly qualified and talented. It
developed the culture in which the employees feel safe and supportive as it offers the rewards
and recognition, training programs, and workplace safety. There are 9000 and above employees
in the organization in which 90% of females (Premier Investment, 2018).
The company mainly focuses on merger and acquisition. As the company financial position and
the stability in the market is high that is why; it has the opportunity to merge with the company
but still it has to follows the rules and regulation.
Conclusion
It is concluded that Premier Investment Limited is stable as per the financial position in the
market. As per the analysis, the net profit is increasing year by year which indicates that the
financial position is enhancing in the market. Apart from its financial position, the company
develops the policy in favor of employees so that they retain with the organization for long time.

FINANCE 8
References
DeFusco, R.A., McLeavey, D.W., Pinto, J.E., Runkle, D.E. and Anson, M.J. (2015) Quantitative
investment analysis. John Wiley & Sons.
Grant, R.M. (2016) Contemporary strategy analysis: Text and cases edition. John Wiley & Sons.
Premier Investments. (2016) Annual Report 2016. [online] Available From:
https://www.premierinvestments.com.au/wp-content/uploads/2016/10/PMV-2016-Annual-
Report.pdf [Accessed 31/09/19].
Premier Investments. (2017) Annual Report 2017. [online] Available From:
https://www.premierinvestments.com.au/wp-content/uploads/2017/10/Premier-Investments-Ltd-
Annual-Report-29.07.17.pdf [Accessed 31/09/19].
Premier Investments. (2018) Annual Report 2018. [online] Available From:
https://www.premierinvestments.com.au/wp-content/uploads/2018/10/2018-Annual-Report-to-
Shareholders.pdf [Accessed 31/09/19].
Robinson, T.R., Henry, E., Pirie, W.L. and Broihahn, M.A. (2015) International financial
statement analysis. John Wiley & Sons.
Williams, E.E. and Dobelman, J.A. (2017) Financial statement analysis. World Scientific Book
Chapters, pp.109-169.
⊘ This is a preview!⊘
Do you want full access?
Subscribe today to unlock all pages.

Trusted by 1+ million students worldwide

FINANCE 9
Appendix
Ratio's 2016 2017 2018
Profitability Ratio
Gross Profit Margin Gross Profit
105745
4
109918
2 1,187,847
Net Sales
104922
6 1.01
109276
0 1.01 1,182,221 1.00
Profit Margin Net Profit 103,874 105136 83,638
Net Sales
104922
6 0.10
109276
0 0.10 1,182,221 0.07
Liquidity Ratio
Current Ratio Current assets 436580 346821 386,790
Current
liabilities 140053 3.12 143390 2.42 135,368 2.86
Quick Ratio Quick assets 299694 194313 200181
Current
liabilities 140053 2.14 143390 1.36 135,368 1.48
Efficiency:
Trade Receivables
days
Net Credit
Sale 104923 109276 118222
Average 15401 6.81 20072 5.44 22623 5.23
Paraphrase This Document
Need a fresh take? Get an instant paraphrase of this document with our AI Paraphraser

FINANCE 10
Accounts
Receivables
*365
Trade Payables days
Trade
Payables 72965 71528 84,558
Net credit
purchase 12360 5.90 14076 5.08 15931.3 5.31
Cash Flow Ratio
Operating Cash Flow
Cash Flow
from
operating
activities 103663 97837 133,851
Sales 944303 0.11 983484 0.10 1063999 0.13
Long Term Debt
Coverage Ratio
Cash Flow
from
operating
activities 103663 97837 133,851
Long Term
Debt 184275 0.56 257628 0.38 271,112 0.49
Gearing Ratio
Non-Current
Liability 184275 257628 271,112

FINANCE 11
Total Equity
*100
133855
5 13.8
133567
3
19.2
9 1,344,934 20.16
Interest Coverage
Ratio EBIT 143083 139145 123,965
Interest
Expenses 4912 29.1 6242
22.2
9 7,551 16.42
(Source: Premier Investments, 2018)
Total Equity
*100
133855
5 13.8
133567
3
19.2
9 1,344,934 20.16
Interest Coverage
Ratio EBIT 143083 139145 123,965
Interest
Expenses 4912 29.1 6242
22.2
9 7,551 16.42
(Source: Premier Investments, 2018)
⊘ This is a preview!⊘
Do you want full access?
Subscribe today to unlock all pages.

Trusted by 1+ million students worldwide
1 out of 12
Related Documents
Your All-in-One AI-Powered Toolkit for Academic Success.
 +13062052269
info@desklib.com
Available 24*7 on WhatsApp / Email
Unlock your academic potential
Copyright © 2020–2025 A2Z Services. All Rights Reserved. Developed and managed by ZUCOL.


