Prepare and Monitor Budgets Report
VerifiedAdded on 2020/03/16
|19
|4805
|377
Report
AI Summary
This report outlines the process of preparing and monitoring budgets for business expansion. It discusses the importance of considering both internal and external factors in budget construction, including government regulations and economic trends. The report emphasizes the need for effective communication with stakeholders and the importance of recording fund allocations for future reference. It also highlights the role of equity and loans in funding business expansion and the necessity of maintaining a collaborative relationship among management and stakeholders.
Running head: PREPARE AND MONITOR BUDGETS
Prepare and Monitor Budgets
Name of the Student:
Name of the University:
Author’s Note:
Prepare and Monitor Budgets
Name of the Student:
Name of the University:
Author’s Note:
Paraphrase This Document
Need a fresh take? Get an instant paraphrase of this document with our AI Paraphraser
1
PREPARE AND MONITOR BUDGETS
Assessment 1
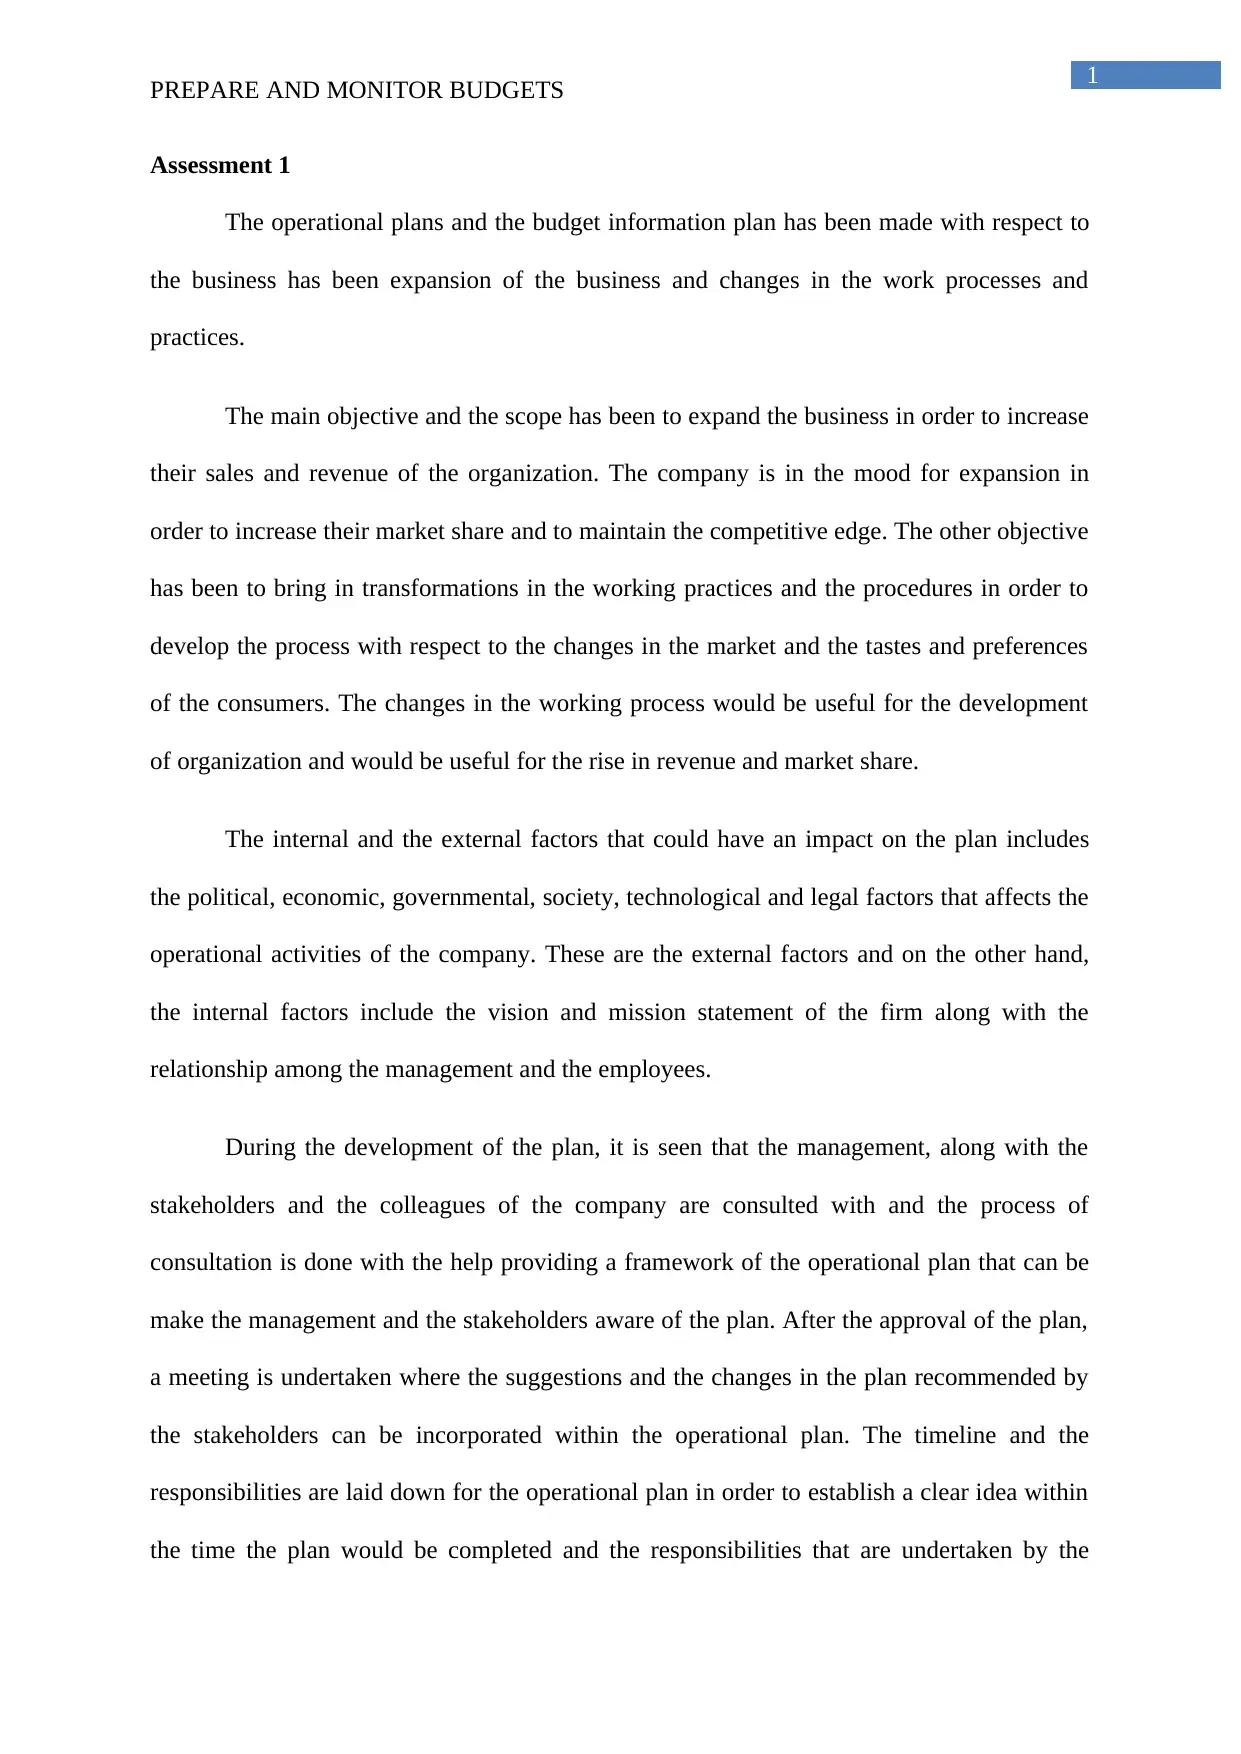
The operational plans and the budget information plan has been made with respect to
the business has been expansion of the business and changes in the work processes and
practices.
The main objective and the scope has been to expand the business in order to increase
their sales and revenue of the organization. The company is in the mood for expansion in
order to increase their market share and to maintain the competitive edge. The other objective
has been to bring in transformations in the working practices and the procedures in order to
develop the process with respect to the changes in the market and the tastes and preferences
of the consumers. The changes in the working process would be useful for the development
of organization and would be useful for the rise in revenue and market share.
The internal and the external factors that could have an impact on the plan includes
the political, economic, governmental, society, technological and legal factors that affects the
operational activities of the company. These are the external factors and on the other hand,
the internal factors include the vision and mission statement of the firm along with the
relationship among the management and the employees.
During the development of the plan, it is seen that the management, along with the
stakeholders and the colleagues of the company are consulted with and the process of
consultation is done with the help providing a framework of the operational plan that can be
make the management and the stakeholders aware of the plan. After the approval of the plan,
a meeting is undertaken where the suggestions and the changes in the plan recommended by
the stakeholders can be incorporated within the operational plan. The timeline and the
responsibilities are laid down for the operational plan in order to establish a clear idea within
the time the plan would be completed and the responsibilities that are undertaken by the
PREPARE AND MONITOR BUDGETS
Assessment 1
The operational plans and the budget information plan has been made with respect to
the business has been expansion of the business and changes in the work processes and
practices.
The main objective and the scope has been to expand the business in order to increase
their sales and revenue of the organization. The company is in the mood for expansion in
order to increase their market share and to maintain the competitive edge. The other objective
has been to bring in transformations in the working practices and the procedures in order to
develop the process with respect to the changes in the market and the tastes and preferences
of the consumers. The changes in the working process would be useful for the development
of organization and would be useful for the rise in revenue and market share.
The internal and the external factors that could have an impact on the plan includes
the political, economic, governmental, society, technological and legal factors that affects the
operational activities of the company. These are the external factors and on the other hand,
the internal factors include the vision and mission statement of the firm along with the
relationship among the management and the employees.
During the development of the plan, it is seen that the management, along with the
stakeholders and the colleagues of the company are consulted with and the process of
consultation is done with the help providing a framework of the operational plan that can be
make the management and the stakeholders aware of the plan. After the approval of the plan,
a meeting is undertaken where the suggestions and the changes in the plan recommended by
the stakeholders can be incorporated within the operational plan. The timeline and the
responsibilities are laid down for the operational plan in order to establish a clear idea within
the time the plan would be completed and the responsibilities that are undertaken by the
2
PREPARE AND MONITOR BUDGETS
every members of the organization. An internal communication process has to be framed
effectively with the help of which all the information can be conveyed to the stakeholders.
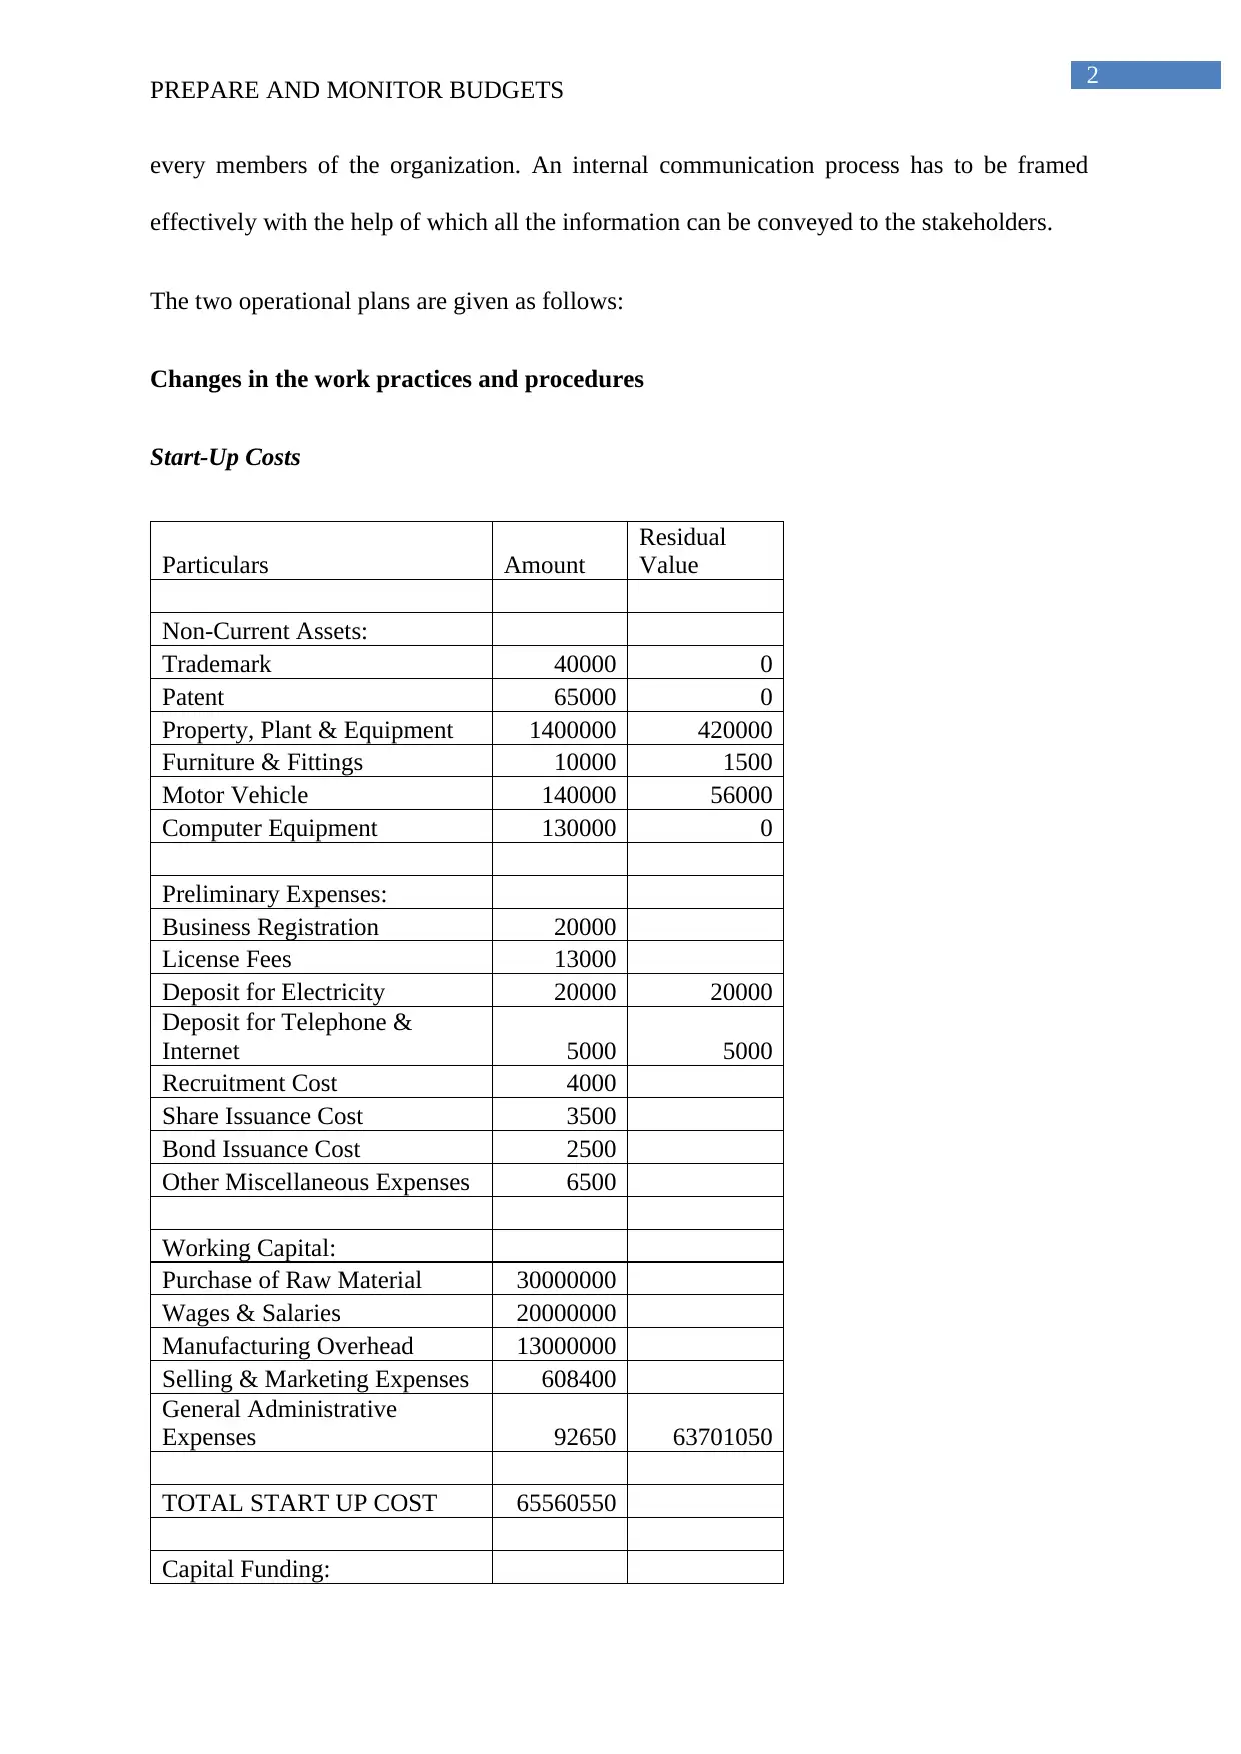
The two operational plans are given as follows:
Changes in the work practices and procedures
Start-Up Costs
Particulars Amount
Residual
Value
Non-Current Assets:
Trademark 40000 0
Patent 65000 0
Property, Plant & Equipment 1400000 420000
Furniture & Fittings 10000 1500
Motor Vehicle 140000 56000
Computer Equipment 130000 0
Preliminary Expenses:
Business Registration 20000
License Fees 13000
Deposit for Electricity 20000 20000
Deposit for Telephone &
Internet 5000 5000
Recruitment Cost 4000
Share Issuance Cost 3500
Bond Issuance Cost 2500
Other Miscellaneous Expenses 6500
Working Capital:
Purchase of Raw Material 30000000
Wages & Salaries 20000000
Manufacturing Overhead 13000000
Selling & Marketing Expenses 608400
General Administrative
Expenses 92650 63701050
TOTAL START UP COST 65560550
Capital Funding:
PREPARE AND MONITOR BUDGETS
every members of the organization. An internal communication process has to be framed
effectively with the help of which all the information can be conveyed to the stakeholders.
The two operational plans are given as follows:
Changes in the work practices and procedures
Start-Up Costs
Particulars Amount
Residual
Value
Non-Current Assets:
Trademark 40000 0
Patent 65000 0
Property, Plant & Equipment 1400000 420000
Furniture & Fittings 10000 1500
Motor Vehicle 140000 56000
Computer Equipment 130000 0
Preliminary Expenses:
Business Registration 20000
License Fees 13000
Deposit for Electricity 20000 20000
Deposit for Telephone &
Internet 5000 5000
Recruitment Cost 4000
Share Issuance Cost 3500
Bond Issuance Cost 2500
Other Miscellaneous Expenses 6500
Working Capital:
Purchase of Raw Material 30000000
Wages & Salaries 20000000
Manufacturing Overhead 13000000
Selling & Marketing Expenses 608400
General Administrative
Expenses 92650 63701050
TOTAL START UP COST 65560550
Capital Funding:
⊘ This is a preview!⊘
Do you want full access?
Subscribe today to unlock all pages.
Trusted by 1+ million students worldwide
3
PREPARE AND MONITOR BUDGETS
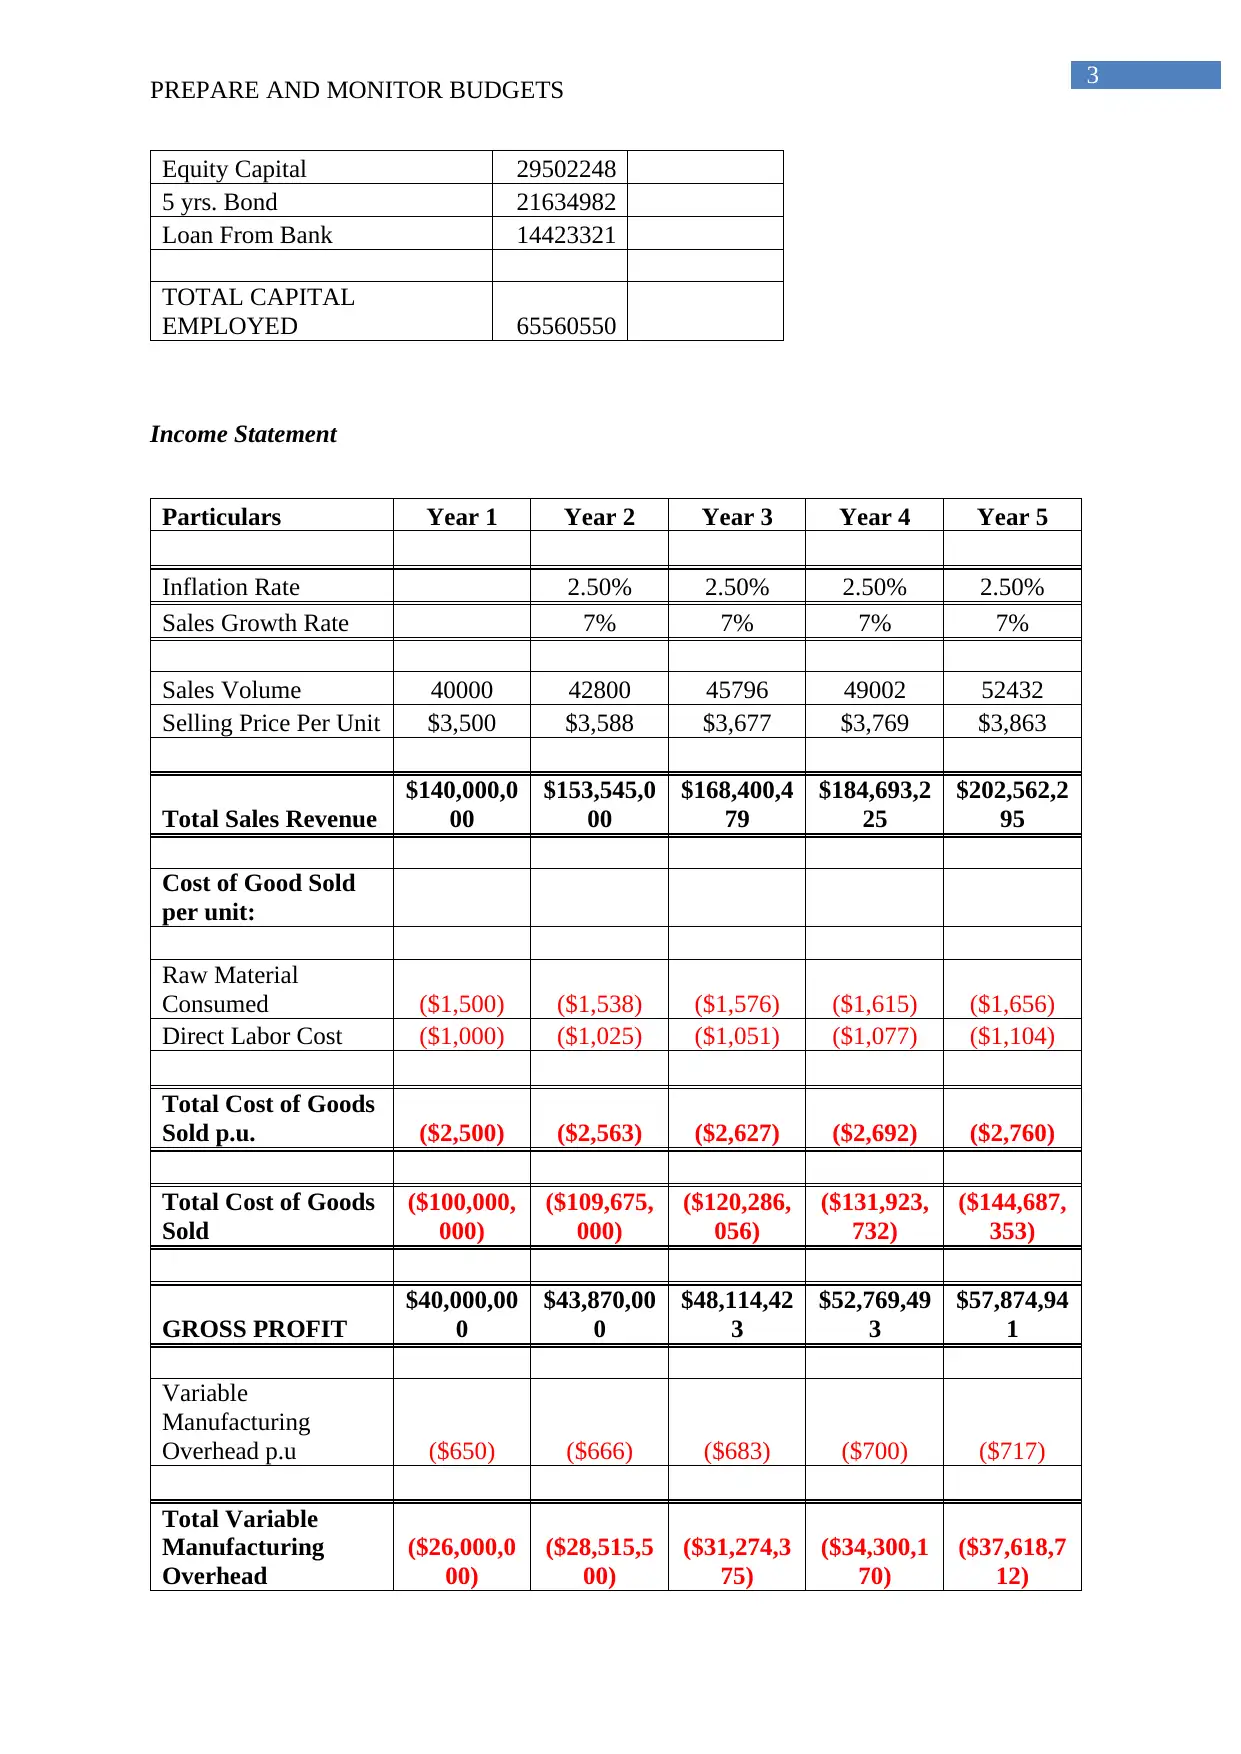
Equity Capital 29502248
5 yrs. Bond 21634982
Loan From Bank 14423321
TOTAL CAPITAL
EMPLOYED 65560550
Income Statement
Particulars Year 1 Year 2 Year 3 Year 4 Year 5
Inflation Rate 2.50% 2.50% 2.50% 2.50%
Sales Growth Rate 7% 7% 7% 7%
Sales Volume 40000 42800 45796 49002 52432
Selling Price Per Unit $3,500 $3,588 $3,677 $3,769 $3,863
Total Sales Revenue
$140,000,0
00
$153,545,0
00
$168,400,4
79
$184,693,2
25
$202,562,2
95
Cost of Good Sold
per unit:
Raw Material
Consumed ($1,500) ($1,538) ($1,576) ($1,615) ($1,656)
Direct Labor Cost ($1,000) ($1,025) ($1,051) ($1,077) ($1,104)
Total Cost of Goods
Sold p.u. ($2,500) ($2,563) ($2,627) ($2,692) ($2,760)
Total Cost of Goods
Sold
($100,000,
000)
($109,675,
000)
($120,286,
056)
($131,923,
732)
($144,687,
353)
GROSS PROFIT
$40,000,00
0
$43,870,00
0
$48,114,42
3
$52,769,49
3
$57,874,94
1
Variable
Manufacturing
Overhead p.u ($650) ($666) ($683) ($700) ($717)
Total Variable
Manufacturing
Overhead
($26,000,0
00)
($28,515,5
00)
($31,274,3
75)
($34,300,1
70)
($37,618,7
12)
PREPARE AND MONITOR BUDGETS
Equity Capital 29502248
5 yrs. Bond 21634982
Loan From Bank 14423321
TOTAL CAPITAL
EMPLOYED 65560550
Income Statement
Particulars Year 1 Year 2 Year 3 Year 4 Year 5
Inflation Rate 2.50% 2.50% 2.50% 2.50%
Sales Growth Rate 7% 7% 7% 7%
Sales Volume 40000 42800 45796 49002 52432
Selling Price Per Unit $3,500 $3,588 $3,677 $3,769 $3,863
Total Sales Revenue
$140,000,0
00
$153,545,0
00
$168,400,4
79
$184,693,2
25
$202,562,2
95
Cost of Good Sold
per unit:
Raw Material
Consumed ($1,500) ($1,538) ($1,576) ($1,615) ($1,656)
Direct Labor Cost ($1,000) ($1,025) ($1,051) ($1,077) ($1,104)
Total Cost of Goods
Sold p.u. ($2,500) ($2,563) ($2,627) ($2,692) ($2,760)
Total Cost of Goods
Sold
($100,000,
000)
($109,675,
000)
($120,286,
056)
($131,923,
732)
($144,687,
353)
GROSS PROFIT
$40,000,00
0
$43,870,00
0
$48,114,42
3
$52,769,49
3
$57,874,94
1
Variable
Manufacturing
Overhead p.u ($650) ($666) ($683) ($700) ($717)
Total Variable
Manufacturing
Overhead
($26,000,0
00)
($28,515,5
00)
($31,274,3
75)
($34,300,1
70)
($37,618,7
12)
Paraphrase This Document
Need a fresh take? Get an instant paraphrase of this document with our AI Paraphraser
4
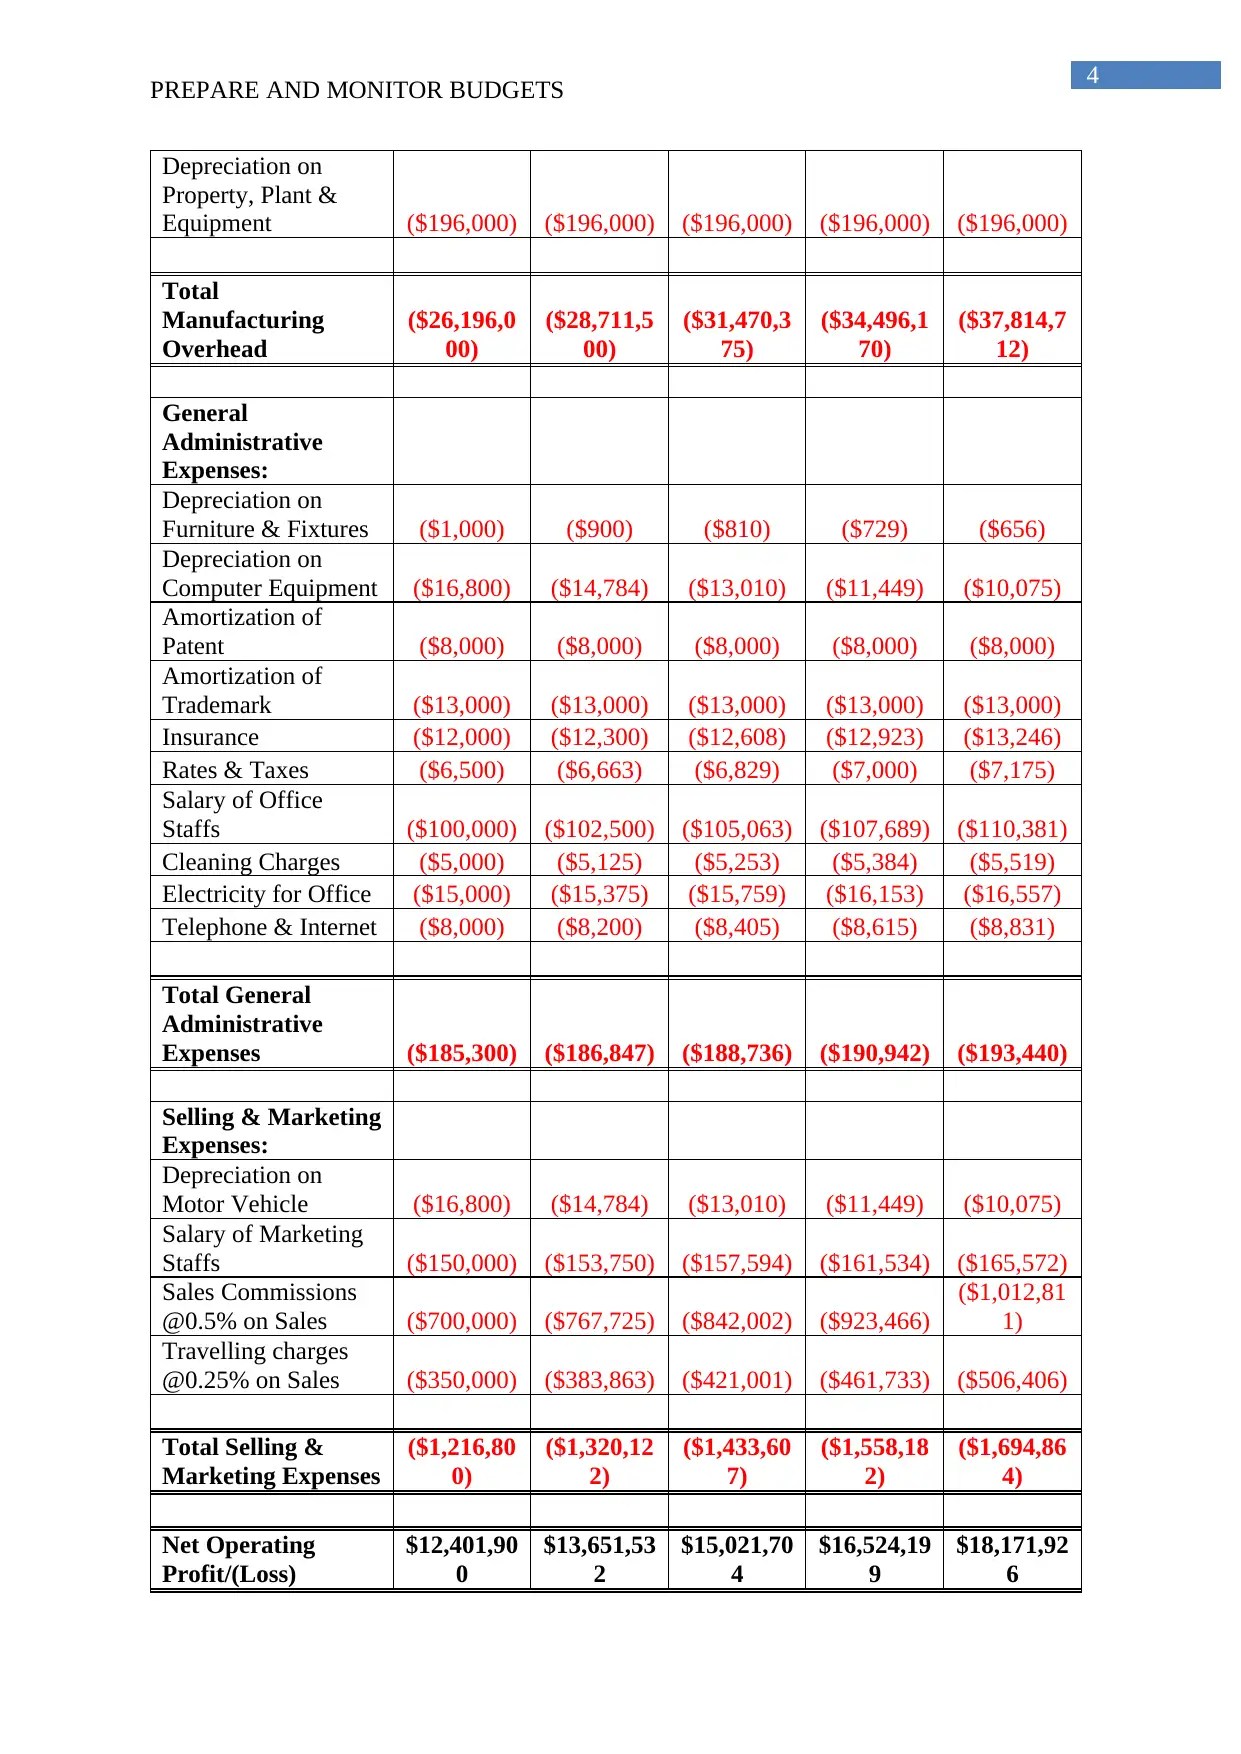
PREPARE AND MONITOR BUDGETS
Depreciation on
Property, Plant &
Equipment ($196,000) ($196,000) ($196,000) ($196,000) ($196,000)
Total
Manufacturing
Overhead
($26,196,0
00)
($28,711,5
00)
($31,470,3
75)
($34,496,1
70)
($37,814,7
12)
General
Administrative
Expenses:
Depreciation on
Furniture & Fixtures ($1,000) ($900) ($810) ($729) ($656)
Depreciation on
Computer Equipment ($16,800) ($14,784) ($13,010) ($11,449) ($10,075)
Amortization of
Patent ($8,000) ($8,000) ($8,000) ($8,000) ($8,000)
Amortization of
Trademark ($13,000) ($13,000) ($13,000) ($13,000) ($13,000)
Insurance ($12,000) ($12,300) ($12,608) ($12,923) ($13,246)
Rates & Taxes ($6,500) ($6,663) ($6,829) ($7,000) ($7,175)
Salary of Office
Staffs ($100,000) ($102,500) ($105,063) ($107,689) ($110,381)
Cleaning Charges ($5,000) ($5,125) ($5,253) ($5,384) ($5,519)
Electricity for Office ($15,000) ($15,375) ($15,759) ($16,153) ($16,557)
Telephone & Internet ($8,000) ($8,200) ($8,405) ($8,615) ($8,831)
Total General
Administrative
Expenses ($185,300) ($186,847) ($188,736) ($190,942) ($193,440)
Selling & Marketing
Expenses:
Depreciation on
Motor Vehicle ($16,800) ($14,784) ($13,010) ($11,449) ($10,075)
Salary of Marketing
Staffs ($150,000) ($153,750) ($157,594) ($161,534) ($165,572)
Sales Commissions
@0.5% on Sales ($700,000) ($767,725) ($842,002) ($923,466)
($1,012,81
1)
Travelling charges
@0.25% on Sales ($350,000) ($383,863) ($421,001) ($461,733) ($506,406)
Total Selling &
Marketing Expenses
($1,216,80
0)
($1,320,12
2)
($1,433,60
7)
($1,558,18
2)
($1,694,86
4)
Net Operating
Profit/(Loss)
$12,401,90
0
$13,651,53
2
$15,021,70
4
$16,524,19
9
$18,171,92
6
5
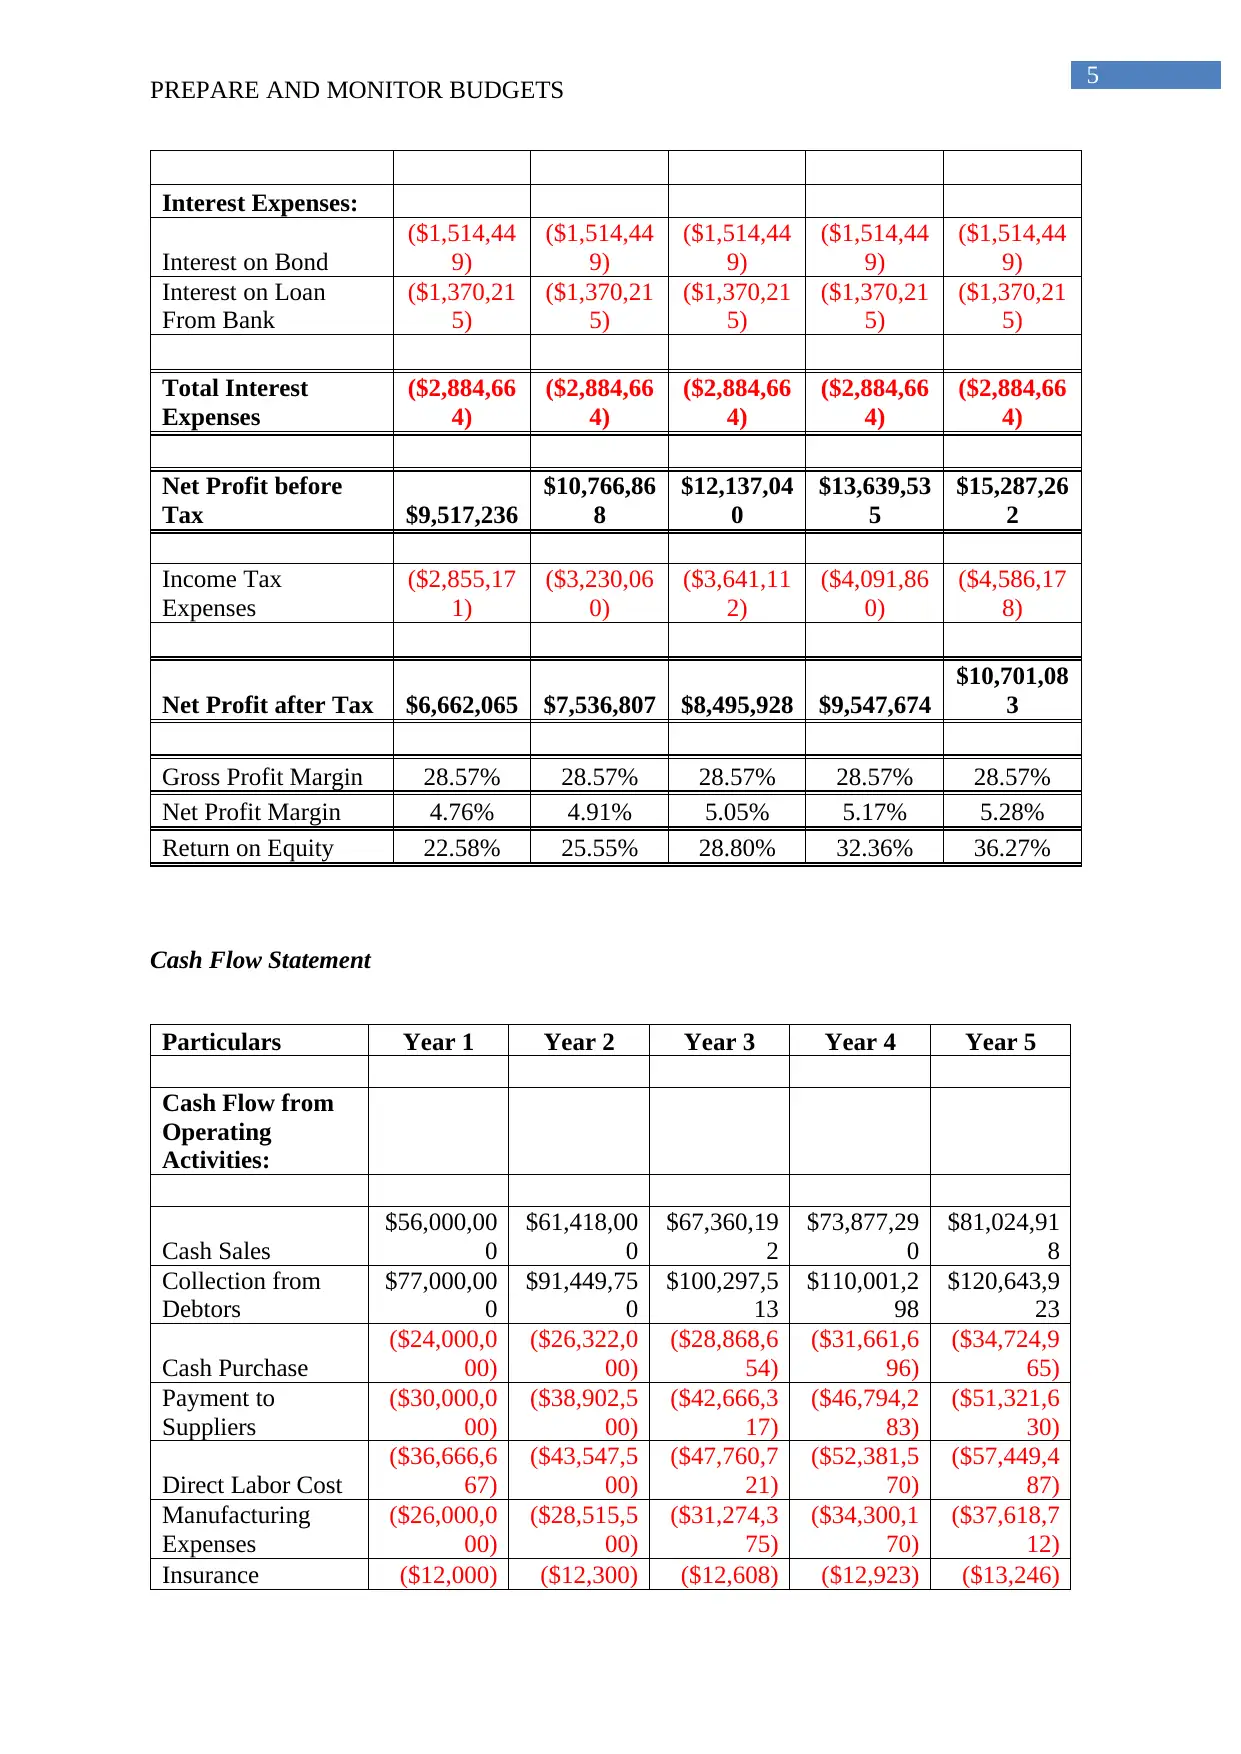
PREPARE AND MONITOR BUDGETS
Interest Expenses:
Interest on Bond
($1,514,44
9)
($1,514,44
9)
($1,514,44
9)
($1,514,44
9)
($1,514,44
9)
Interest on Loan
From Bank
($1,370,21
5)
($1,370,21
5)
($1,370,21
5)
($1,370,21
5)
($1,370,21
5)
Total Interest
Expenses
($2,884,66
4)
($2,884,66
4)
($2,884,66
4)
($2,884,66
4)
($2,884,66
4)
Net Profit before
Tax $9,517,236
$10,766,86
8
$12,137,04
0
$13,639,53
5
$15,287,26
2
Income Tax
Expenses
($2,855,17
1)
($3,230,06
0)
($3,641,11
2)
($4,091,86
0)
($4,586,17
8)
Net Profit after Tax $6,662,065 $7,536,807 $8,495,928 $9,547,674
$10,701,08
3
Gross Profit Margin 28.57% 28.57% 28.57% 28.57% 28.57%
Net Profit Margin 4.76% 4.91% 5.05% 5.17% 5.28%
Return on Equity 22.58% 25.55% 28.80% 32.36% 36.27%
Cash Flow Statement
Particulars Year 1 Year 2 Year 3 Year 4 Year 5
Cash Flow from
Operating
Activities:
Cash Sales
$56,000,00
0
$61,418,00
0
$67,360,19
2
$73,877,29
0
$81,024,91
8
Collection from
Debtors
$77,000,00
0
$91,449,75
0
$100,297,5
13
$110,001,2
98
$120,643,9
23
Cash Purchase
($24,000,0
00)
($26,322,0
00)
($28,868,6
54)
($31,661,6
96)
($34,724,9
65)
Payment to
Suppliers
($30,000,0
00)
($38,902,5
00)
($42,666,3
17)
($46,794,2
83)
($51,321,6
30)
Direct Labor Cost
($36,666,6
67)
($43,547,5
00)
($47,760,7
21)
($52,381,5
70)
($57,449,4
87)
Manufacturing
Expenses
($26,000,0
00)
($28,515,5
00)
($31,274,3
75)
($34,300,1
70)
($37,618,7
12)
Insurance ($12,000) ($12,300) ($12,608) ($12,923) ($13,246)
⊘ This is a preview!⊘
Do you want full access?
Subscribe today to unlock all pages.
Trusted by 1+ million students worldwide
6
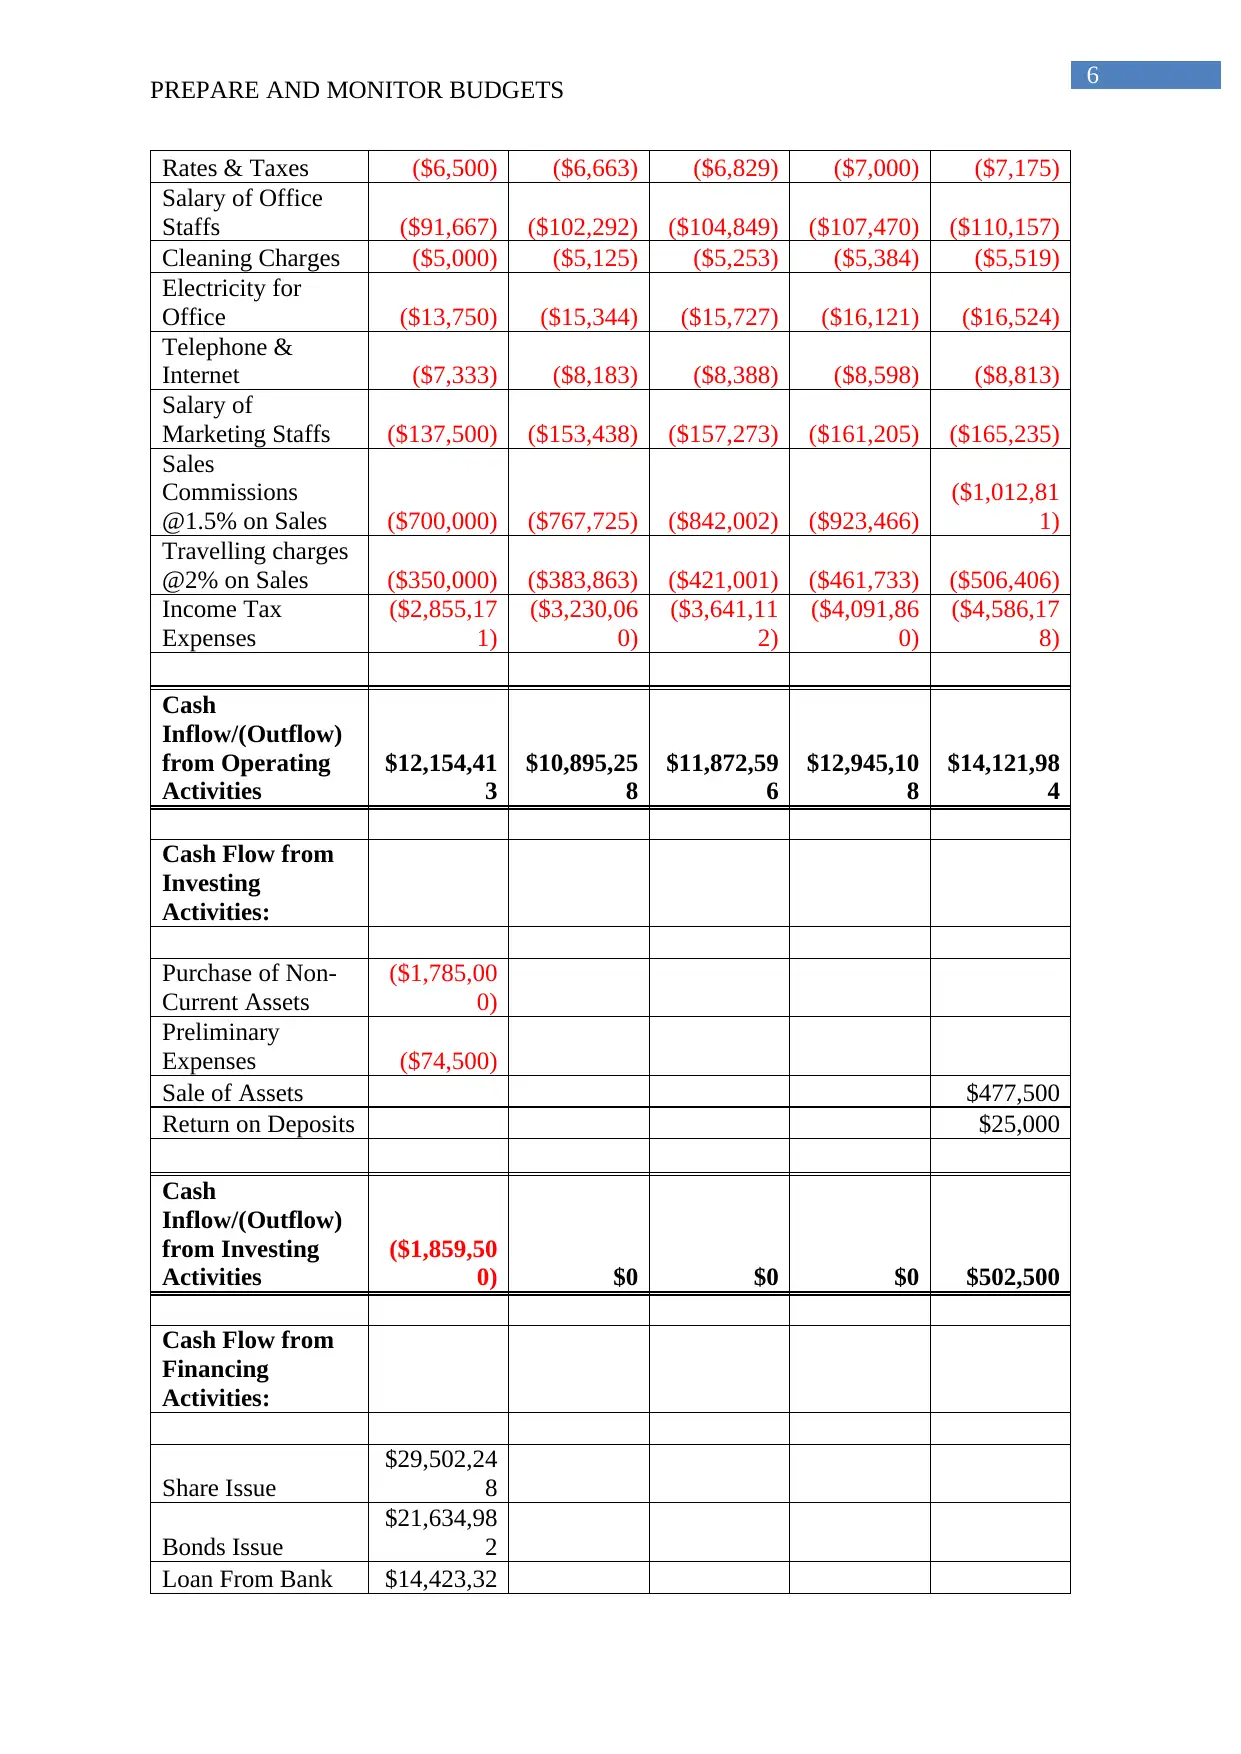
PREPARE AND MONITOR BUDGETS
Rates & Taxes ($6,500) ($6,663) ($6,829) ($7,000) ($7,175)
Salary of Office
Staffs ($91,667) ($102,292) ($104,849) ($107,470) ($110,157)
Cleaning Charges ($5,000) ($5,125) ($5,253) ($5,384) ($5,519)
Electricity for
Office ($13,750) ($15,344) ($15,727) ($16,121) ($16,524)
Telephone &
Internet ($7,333) ($8,183) ($8,388) ($8,598) ($8,813)
Salary of
Marketing Staffs ($137,500) ($153,438) ($157,273) ($161,205) ($165,235)
Sales
Commissions
@1.5% on Sales ($700,000) ($767,725) ($842,002) ($923,466)
($1,012,81
1)
Travelling charges
@2% on Sales ($350,000) ($383,863) ($421,001) ($461,733) ($506,406)
Income Tax
Expenses
($2,855,17
1)
($3,230,06
0)
($3,641,11
2)
($4,091,86
0)
($4,586,17
8)
Cash
Inflow/(Outflow)
from Operating
Activities
$12,154,41
3
$10,895,25
8
$11,872,59
6
$12,945,10
8
$14,121,98
4
Cash Flow from
Investing
Activities:
Purchase of Non-
Current Assets
($1,785,00
0)
Preliminary
Expenses ($74,500)
Sale of Assets $477,500
Return on Deposits $25,000
Cash
Inflow/(Outflow)
from Investing
Activities
($1,859,50
0) $0 $0 $0 $502,500
Cash Flow from
Financing
Activities:
Share Issue
$29,502,24
8
Bonds Issue
$21,634,98
2
Loan From Bank $14,423,32
Paraphrase This Document
Need a fresh take? Get an instant paraphrase of this document with our AI Paraphraser
7
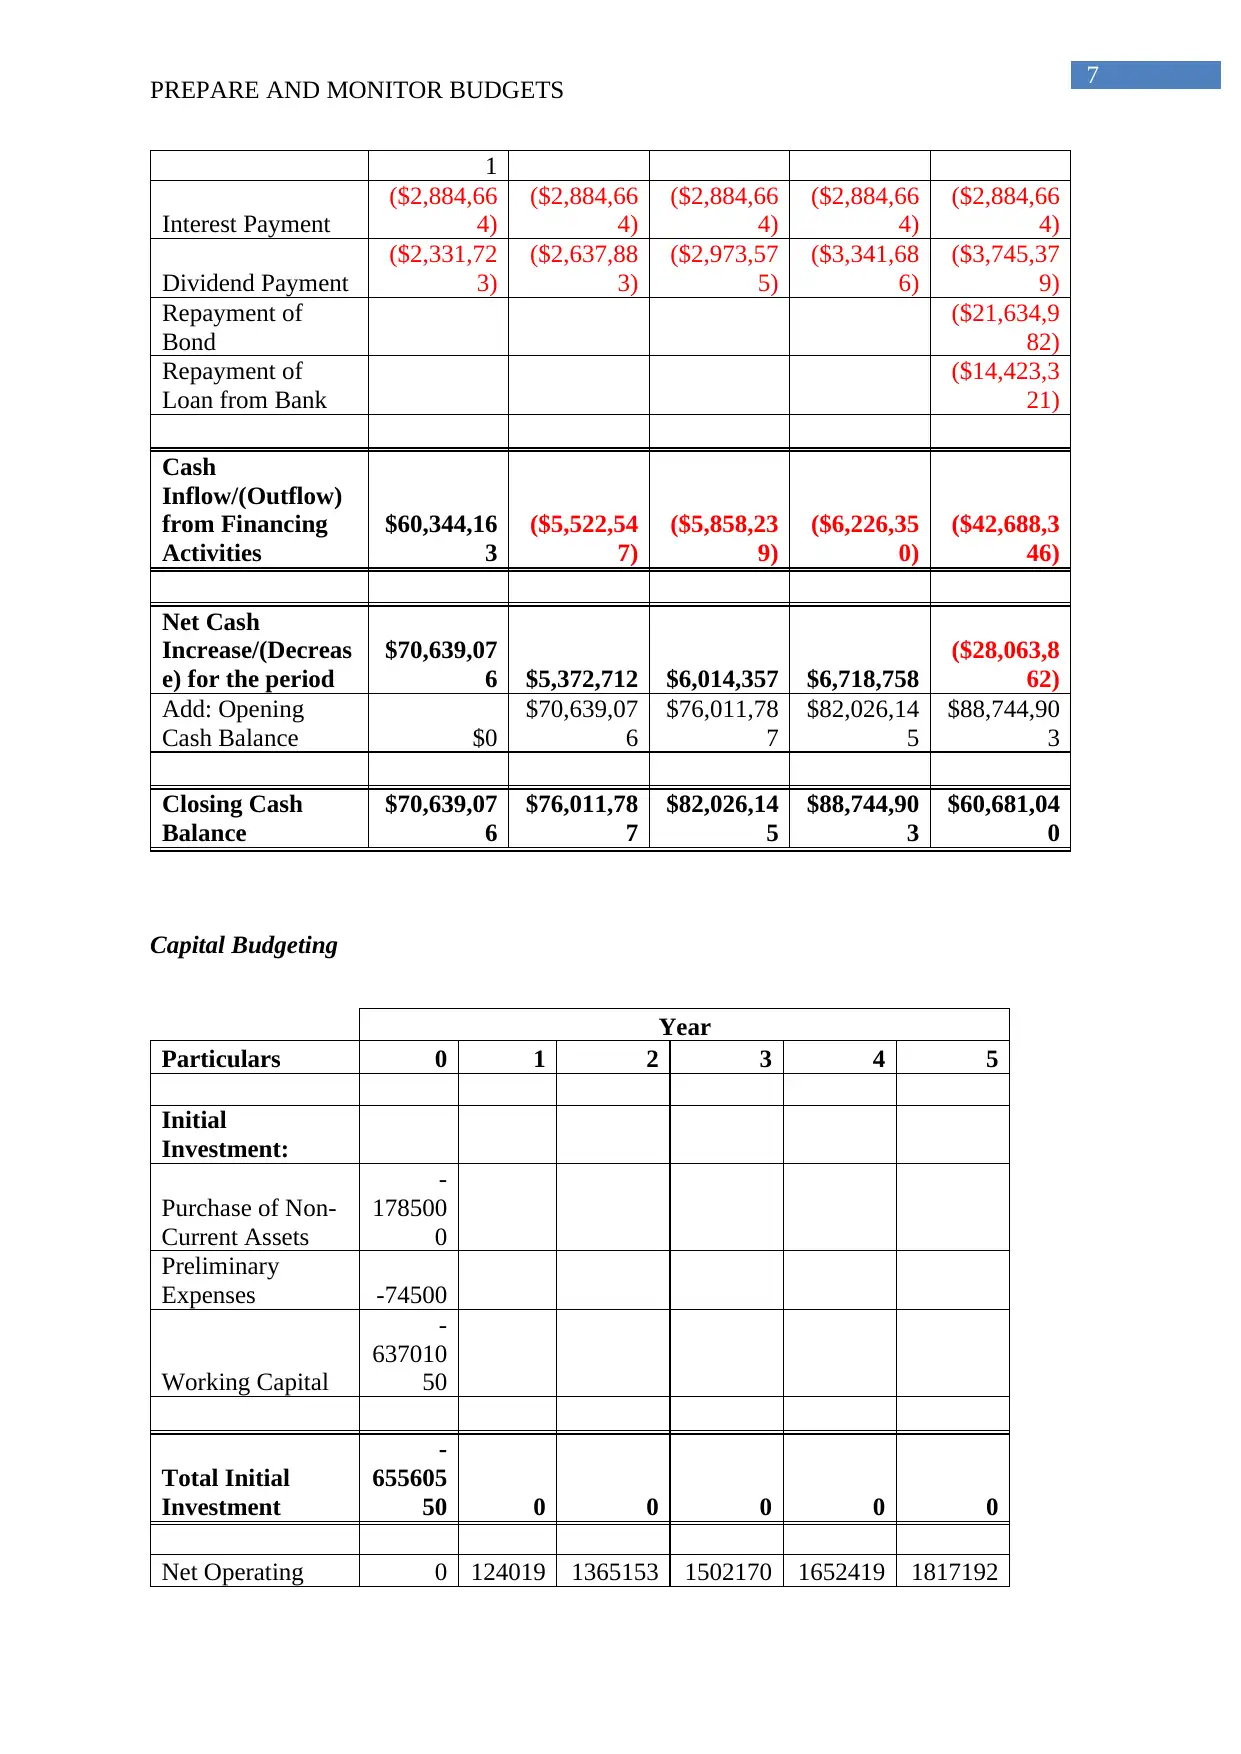
PREPARE AND MONITOR BUDGETS
1
Interest Payment
($2,884,66
4)
($2,884,66
4)
($2,884,66
4)
($2,884,66
4)
($2,884,66
4)
Dividend Payment
($2,331,72
3)
($2,637,88
3)
($2,973,57
5)
($3,341,68
6)
($3,745,37
9)
Repayment of
Bond
($21,634,9
82)
Repayment of
Loan from Bank
($14,423,3
21)
Cash
Inflow/(Outflow)
from Financing
Activities
$60,344,16
3
($5,522,54
7)
($5,858,23
9)
($6,226,35
0)
($42,688,3
46)
Net Cash
Increase/(Decreas
e) for the period
$70,639,07
6 $5,372,712 $6,014,357 $6,718,758
($28,063,8
62)
Add: Opening
Cash Balance $0
$70,639,07
6
$76,011,78
7
$82,026,14
5
$88,744,90
3
Closing Cash
Balance
$70,639,07
6
$76,011,78
7
$82,026,14
5
$88,744,90
3
$60,681,04
0
Capital Budgeting
Year
Particulars 0 1 2 3 4 5
Initial
Investment:
Purchase of Non-
Current Assets
-
178500
0
Preliminary
Expenses -74500
Working Capital
-
637010
50
Total Initial
Investment
-
655605
50 0 0 0 0 0
Net Operating 0 124019 1365153 1502170 1652419 1817192
PREPARE AND MONITOR BUDGETS
1
Interest Payment
($2,884,66
4)
($2,884,66
4)
($2,884,66
4)
($2,884,66
4)
($2,884,66
4)
Dividend Payment
($2,331,72
3)
($2,637,88
3)
($2,973,57
5)
($3,341,68
6)
($3,745,37
9)
Repayment of
Bond
($21,634,9
82)
Repayment of
Loan from Bank
($14,423,3
21)
Cash
Inflow/(Outflow)
from Financing
Activities
$60,344,16
3
($5,522,54
7)
($5,858,23
9)
($6,226,35
0)
($42,688,3
46)
Net Cash
Increase/(Decreas
e) for the period
$70,639,07
6 $5,372,712 $6,014,357 $6,718,758
($28,063,8
62)
Add: Opening
Cash Balance $0
$70,639,07
6
$76,011,78
7
$82,026,14
5
$88,744,90
3
Closing Cash
Balance
$70,639,07
6
$76,011,78
7
$82,026,14
5
$88,744,90
3
$60,681,04
0
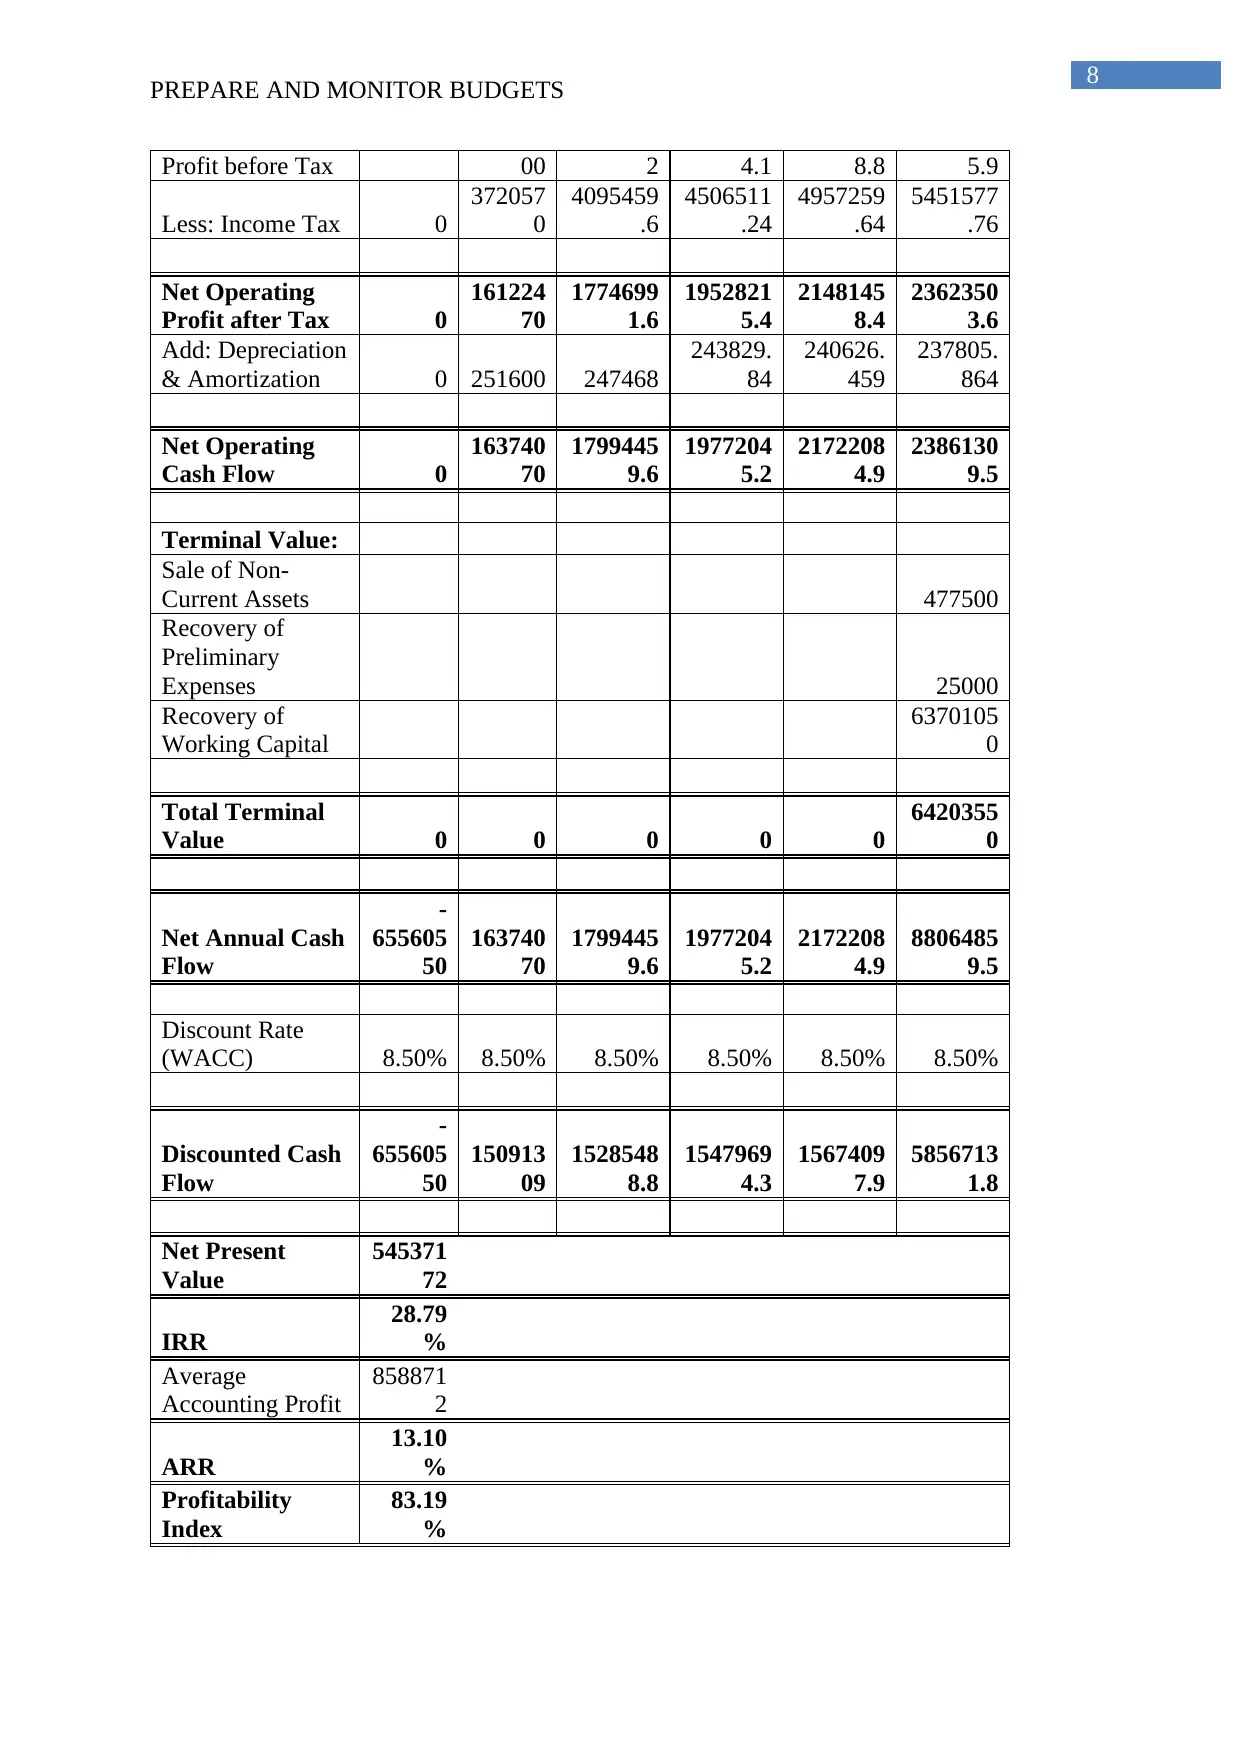
Capital Budgeting
Year
Particulars 0 1 2 3 4 5
Initial
Investment:
Purchase of Non-
Current Assets
-
178500
0
Preliminary
Expenses -74500
Working Capital
-
637010
50
Total Initial
Investment
-
655605
50 0 0 0 0 0
Net Operating 0 124019 1365153 1502170 1652419 1817192
8
PREPARE AND MONITOR BUDGETS
Profit before Tax 00 2 4.1 8.8 5.9
Less: Income Tax 0
372057
0
4095459
.6
4506511
.24
4957259
.64
5451577
.76
Net Operating
Profit after Tax 0
161224
70
1774699
1.6
1952821
5.4
2148145
8.4
2362350
3.6
Add: Depreciation
& Amortization 0 251600 247468
243829.
84
240626.
459
237805.
864
Net Operating
Cash Flow 0
163740
70
1799445
9.6
1977204
5.2
2172208
4.9
2386130
9.5
Terminal Value:
Sale of Non-
Current Assets 477500
Recovery of
Preliminary
Expenses 25000
Recovery of
Working Capital
6370105
0
Total Terminal
Value 0 0 0 0 0
6420355
0
Net Annual Cash
Flow
-
655605
50
163740
70
1799445
9.6
1977204
5.2
2172208
4.9
8806485
9.5
Discount Rate
(WACC) 8.50% 8.50% 8.50% 8.50% 8.50% 8.50%
Discounted Cash
Flow
-
655605
50
150913
09
1528548
8.8
1547969
4.3
1567409
7.9
5856713
1.8
Net Present
Value
545371
72
IRR
28.79
%
Average
Accounting Profit
858871
2
ARR
13.10
%
Profitability
Index
83.19
%
⊘ This is a preview!⊘
Do you want full access?
Subscribe today to unlock all pages.
Trusted by 1+ million students worldwide
9
PREPARE AND MONITOR BUDGETS
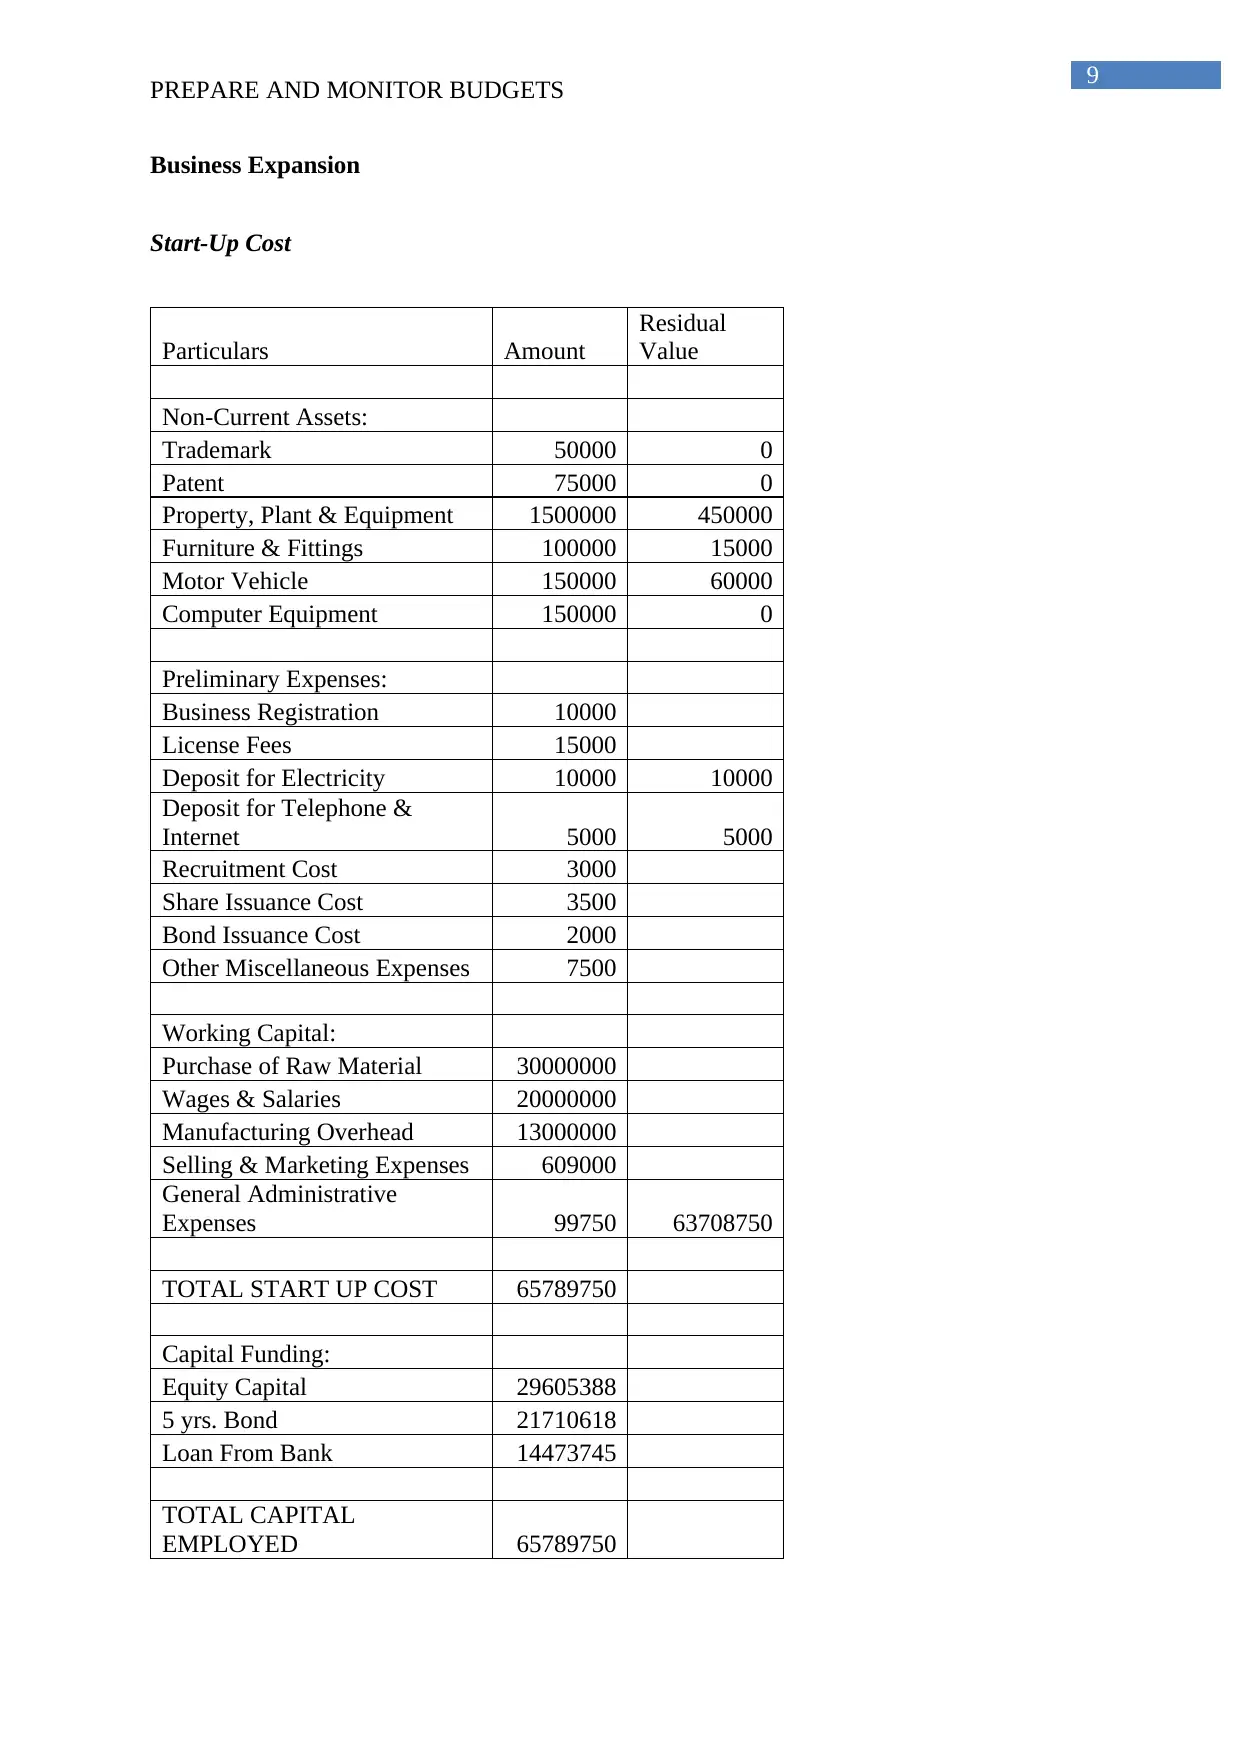
Business Expansion
Start-Up Cost
Particulars Amount
Residual
Value
Non-Current Assets:
Trademark 50000 0
Patent 75000 0
Property, Plant & Equipment 1500000 450000
Furniture & Fittings 100000 15000
Motor Vehicle 150000 60000
Computer Equipment 150000 0
Preliminary Expenses:
Business Registration 10000
License Fees 15000
Deposit for Electricity 10000 10000
Deposit for Telephone &
Internet 5000 5000
Recruitment Cost 3000
Share Issuance Cost 3500
Bond Issuance Cost 2000
Other Miscellaneous Expenses 7500
Working Capital:
Purchase of Raw Material 30000000
Wages & Salaries 20000000
Manufacturing Overhead 13000000
Selling & Marketing Expenses 609000
General Administrative
Expenses 99750 63708750
TOTAL START UP COST 65789750
Capital Funding:
Equity Capital 29605388
5 yrs. Bond 21710618
Loan From Bank 14473745
TOTAL CAPITAL
EMPLOYED 65789750
PREPARE AND MONITOR BUDGETS
Business Expansion
Start-Up Cost
Particulars Amount
Residual
Value
Non-Current Assets:
Trademark 50000 0
Patent 75000 0
Property, Plant & Equipment 1500000 450000
Furniture & Fittings 100000 15000
Motor Vehicle 150000 60000
Computer Equipment 150000 0
Preliminary Expenses:
Business Registration 10000
License Fees 15000
Deposit for Electricity 10000 10000
Deposit for Telephone &
Internet 5000 5000
Recruitment Cost 3000
Share Issuance Cost 3500
Bond Issuance Cost 2000
Other Miscellaneous Expenses 7500
Working Capital:
Purchase of Raw Material 30000000
Wages & Salaries 20000000
Manufacturing Overhead 13000000
Selling & Marketing Expenses 609000
General Administrative
Expenses 99750 63708750
TOTAL START UP COST 65789750
Capital Funding:
Equity Capital 29605388
5 yrs. Bond 21710618
Loan From Bank 14473745
TOTAL CAPITAL
EMPLOYED 65789750
Paraphrase This Document
Need a fresh take? Get an instant paraphrase of this document with our AI Paraphraser
10
PREPARE AND MONITOR BUDGETS
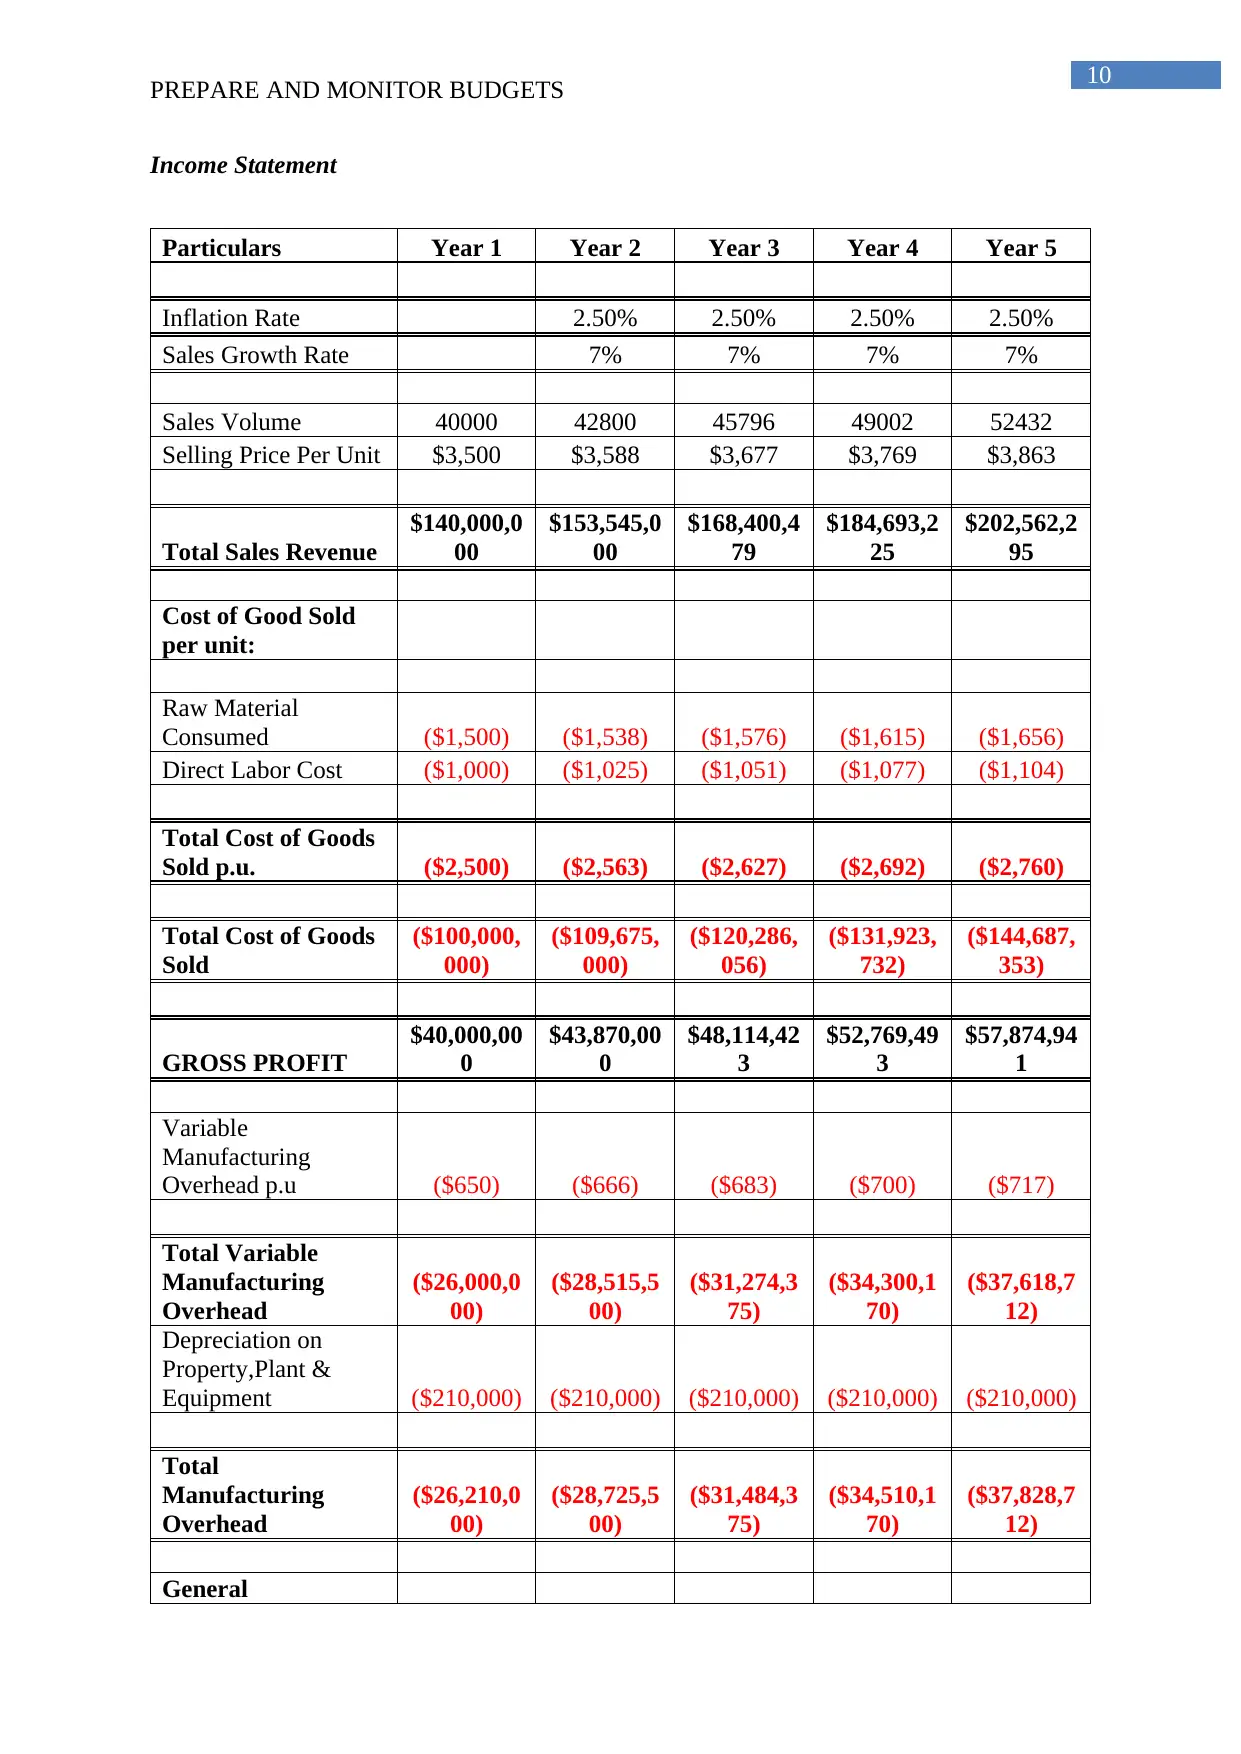
Income Statement
Particulars Year 1 Year 2 Year 3 Year 4 Year 5
Inflation Rate 2.50% 2.50% 2.50% 2.50%
Sales Growth Rate 7% 7% 7% 7%
Sales Volume 40000 42800 45796 49002 52432
Selling Price Per Unit $3,500 $3,588 $3,677 $3,769 $3,863
Total Sales Revenue
$140,000,0
00
$153,545,0
00
$168,400,4
79
$184,693,2
25
$202,562,2
95
Cost of Good Sold
per unit:
Raw Material
Consumed ($1,500) ($1,538) ($1,576) ($1,615) ($1,656)
Direct Labor Cost ($1,000) ($1,025) ($1,051) ($1,077) ($1,104)
Total Cost of Goods
Sold p.u. ($2,500) ($2,563) ($2,627) ($2,692) ($2,760)
Total Cost of Goods
Sold
($100,000,
000)
($109,675,
000)
($120,286,
056)
($131,923,
732)
($144,687,
353)
GROSS PROFIT
$40,000,00
0
$43,870,00
0
$48,114,42
3
$52,769,49
3
$57,874,94
1
Variable
Manufacturing
Overhead p.u ($650) ($666) ($683) ($700) ($717)
Total Variable
Manufacturing
Overhead
($26,000,0
00)
($28,515,5
00)
($31,274,3
75)
($34,300,1
70)
($37,618,7
12)
Depreciation on
Property,Plant &
Equipment ($210,000) ($210,000) ($210,000) ($210,000) ($210,000)
Total
Manufacturing
Overhead
($26,210,0
00)
($28,725,5
00)
($31,484,3
75)
($34,510,1
70)
($37,828,7
12)
General
PREPARE AND MONITOR BUDGETS
Income Statement
Particulars Year 1 Year 2 Year 3 Year 4 Year 5
Inflation Rate 2.50% 2.50% 2.50% 2.50%
Sales Growth Rate 7% 7% 7% 7%
Sales Volume 40000 42800 45796 49002 52432
Selling Price Per Unit $3,500 $3,588 $3,677 $3,769 $3,863
Total Sales Revenue
$140,000,0
00
$153,545,0
00
$168,400,4
79
$184,693,2
25
$202,562,2
95
Cost of Good Sold
per unit:
Raw Material
Consumed ($1,500) ($1,538) ($1,576) ($1,615) ($1,656)
Direct Labor Cost ($1,000) ($1,025) ($1,051) ($1,077) ($1,104)
Total Cost of Goods
Sold p.u. ($2,500) ($2,563) ($2,627) ($2,692) ($2,760)
Total Cost of Goods
Sold
($100,000,
000)
($109,675,
000)
($120,286,
056)
($131,923,
732)
($144,687,
353)
GROSS PROFIT
$40,000,00
0
$43,870,00
0
$48,114,42
3
$52,769,49
3
$57,874,94
1
Variable
Manufacturing
Overhead p.u ($650) ($666) ($683) ($700) ($717)
Total Variable
Manufacturing
Overhead
($26,000,0
00)
($28,515,5
00)
($31,274,3
75)
($34,300,1
70)
($37,618,7
12)
Depreciation on
Property,Plant &
Equipment ($210,000) ($210,000) ($210,000) ($210,000) ($210,000)
Total
Manufacturing
Overhead
($26,210,0
00)
($28,725,5
00)
($31,484,3
75)
($34,510,1
70)
($37,828,7
12)
General
11
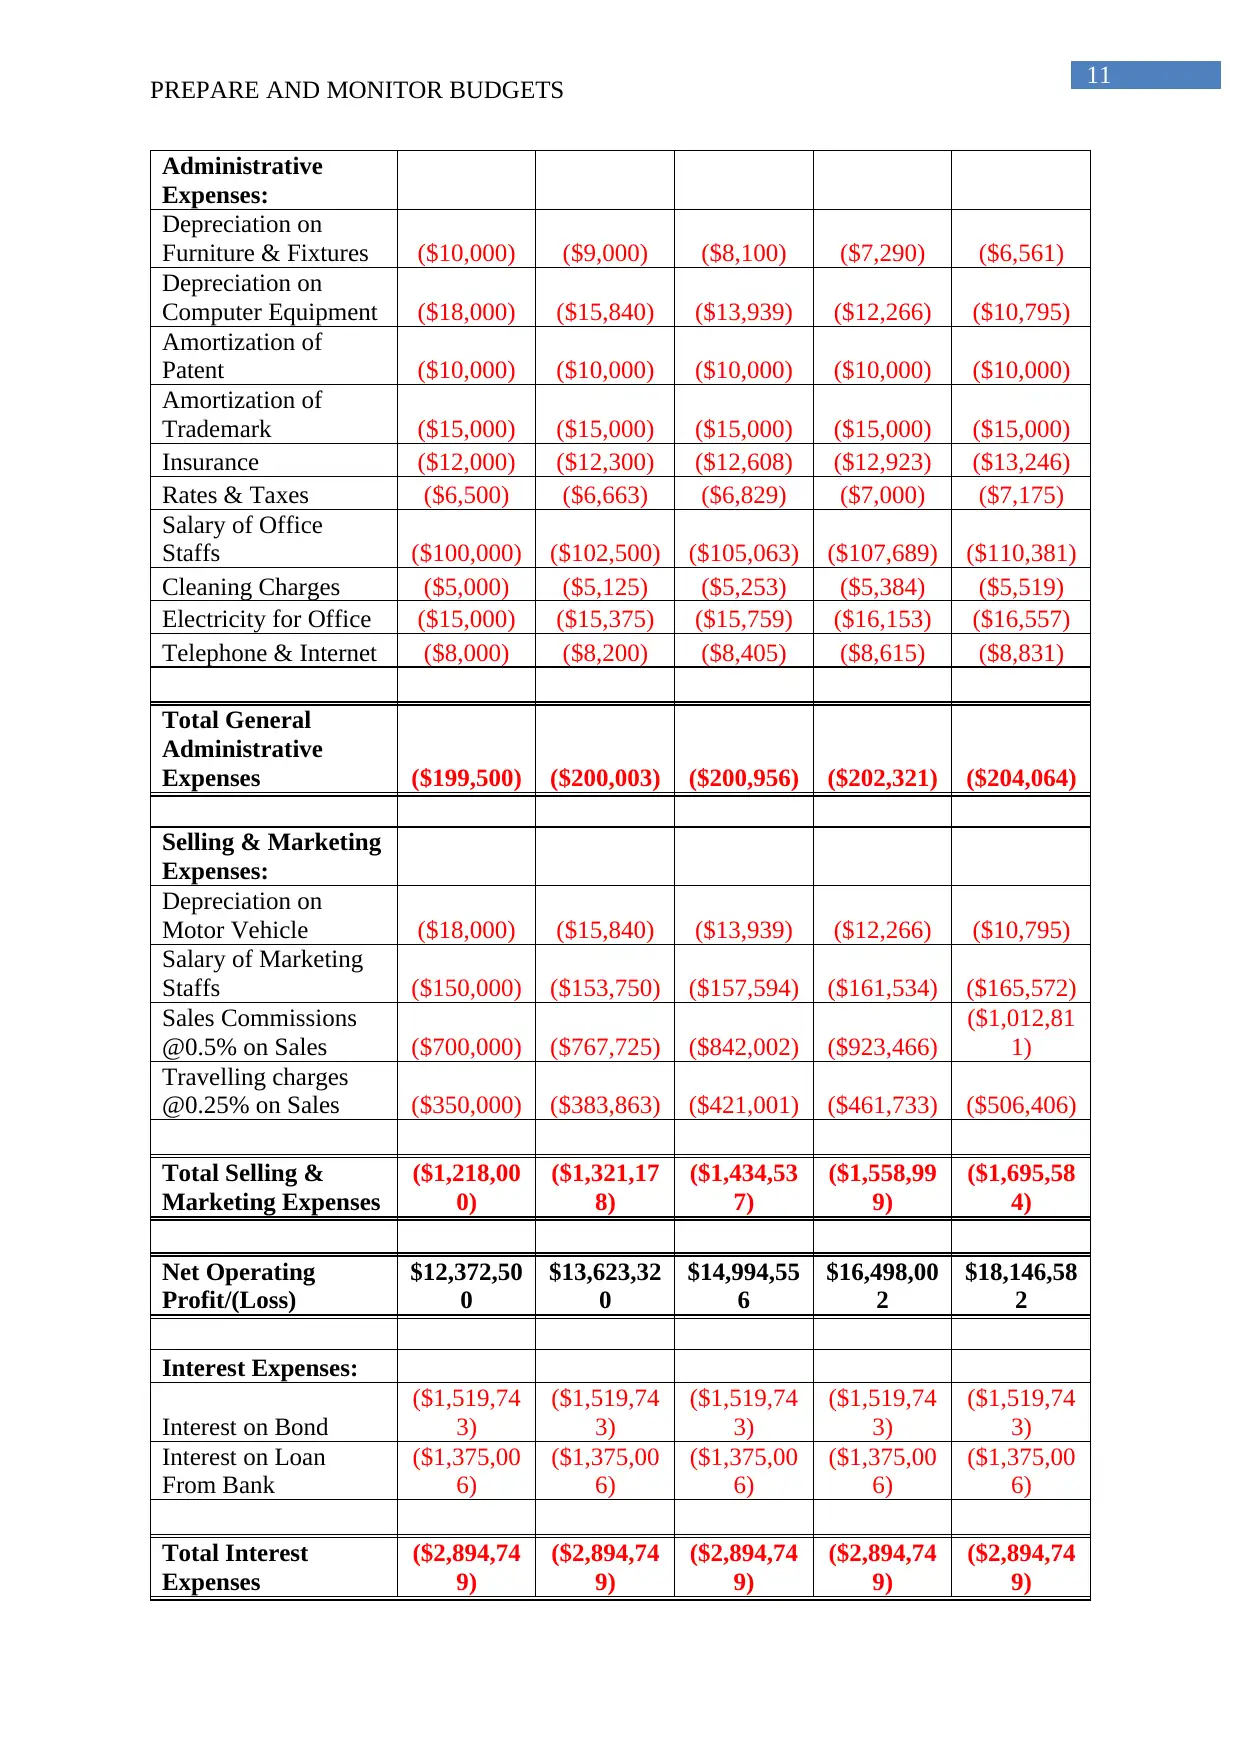
PREPARE AND MONITOR BUDGETS
Administrative
Expenses:
Depreciation on
Furniture & Fixtures ($10,000) ($9,000) ($8,100) ($7,290) ($6,561)
Depreciation on
Computer Equipment ($18,000) ($15,840) ($13,939) ($12,266) ($10,795)
Amortization of
Patent ($10,000) ($10,000) ($10,000) ($10,000) ($10,000)
Amortization of
Trademark ($15,000) ($15,000) ($15,000) ($15,000) ($15,000)
Insurance ($12,000) ($12,300) ($12,608) ($12,923) ($13,246)
Rates & Taxes ($6,500) ($6,663) ($6,829) ($7,000) ($7,175)
Salary of Office
Staffs ($100,000) ($102,500) ($105,063) ($107,689) ($110,381)
Cleaning Charges ($5,000) ($5,125) ($5,253) ($5,384) ($5,519)
Electricity for Office ($15,000) ($15,375) ($15,759) ($16,153) ($16,557)
Telephone & Internet ($8,000) ($8,200) ($8,405) ($8,615) ($8,831)
Total General
Administrative
Expenses ($199,500) ($200,003) ($200,956) ($202,321) ($204,064)
Selling & Marketing
Expenses:
Depreciation on
Motor Vehicle ($18,000) ($15,840) ($13,939) ($12,266) ($10,795)
Salary of Marketing
Staffs ($150,000) ($153,750) ($157,594) ($161,534) ($165,572)
Sales Commissions
@0.5% on Sales ($700,000) ($767,725) ($842,002) ($923,466)
($1,012,81
1)
Travelling charges
@0.25% on Sales ($350,000) ($383,863) ($421,001) ($461,733) ($506,406)
Total Selling &
Marketing Expenses
($1,218,00
0)
($1,321,17
8)
($1,434,53
7)
($1,558,99
9)
($1,695,58
4)
Net Operating
Profit/(Loss)
$12,372,50
0
$13,623,32
0
$14,994,55
6
$16,498,00
2
$18,146,58
2
Interest Expenses:
Interest on Bond
($1,519,74
3)
($1,519,74
3)
($1,519,74
3)
($1,519,74
3)
($1,519,74
3)
Interest on Loan
From Bank
($1,375,00
6)
($1,375,00
6)
($1,375,00
6)
($1,375,00
6)
($1,375,00
6)
Total Interest
Expenses
($2,894,74
9)
($2,894,74
9)
($2,894,74
9)
($2,894,74
9)
($2,894,74
9)
⊘ This is a preview!⊘
Do you want full access?
Subscribe today to unlock all pages.
Trusted by 1+ million students worldwide
1 out of 19
Related Documents


Your All-in-One AI-Powered Toolkit for Academic Success.
+13062052269
info@desklib.com
Available 24*7 on WhatsApp / Email
![[object Object]](/_next/static/media/star-bottom.7253800d.svg)
Unlock your academic potential
Copyright © 2020–2026 A2Z Services. All Rights Reserved. Developed and managed by ZUCOL.