Impact of Online Price Changes on High Demand Products in the UK

Verified

Added on  2023/06/18

|1
|840
|352
Presentation
AI Summary
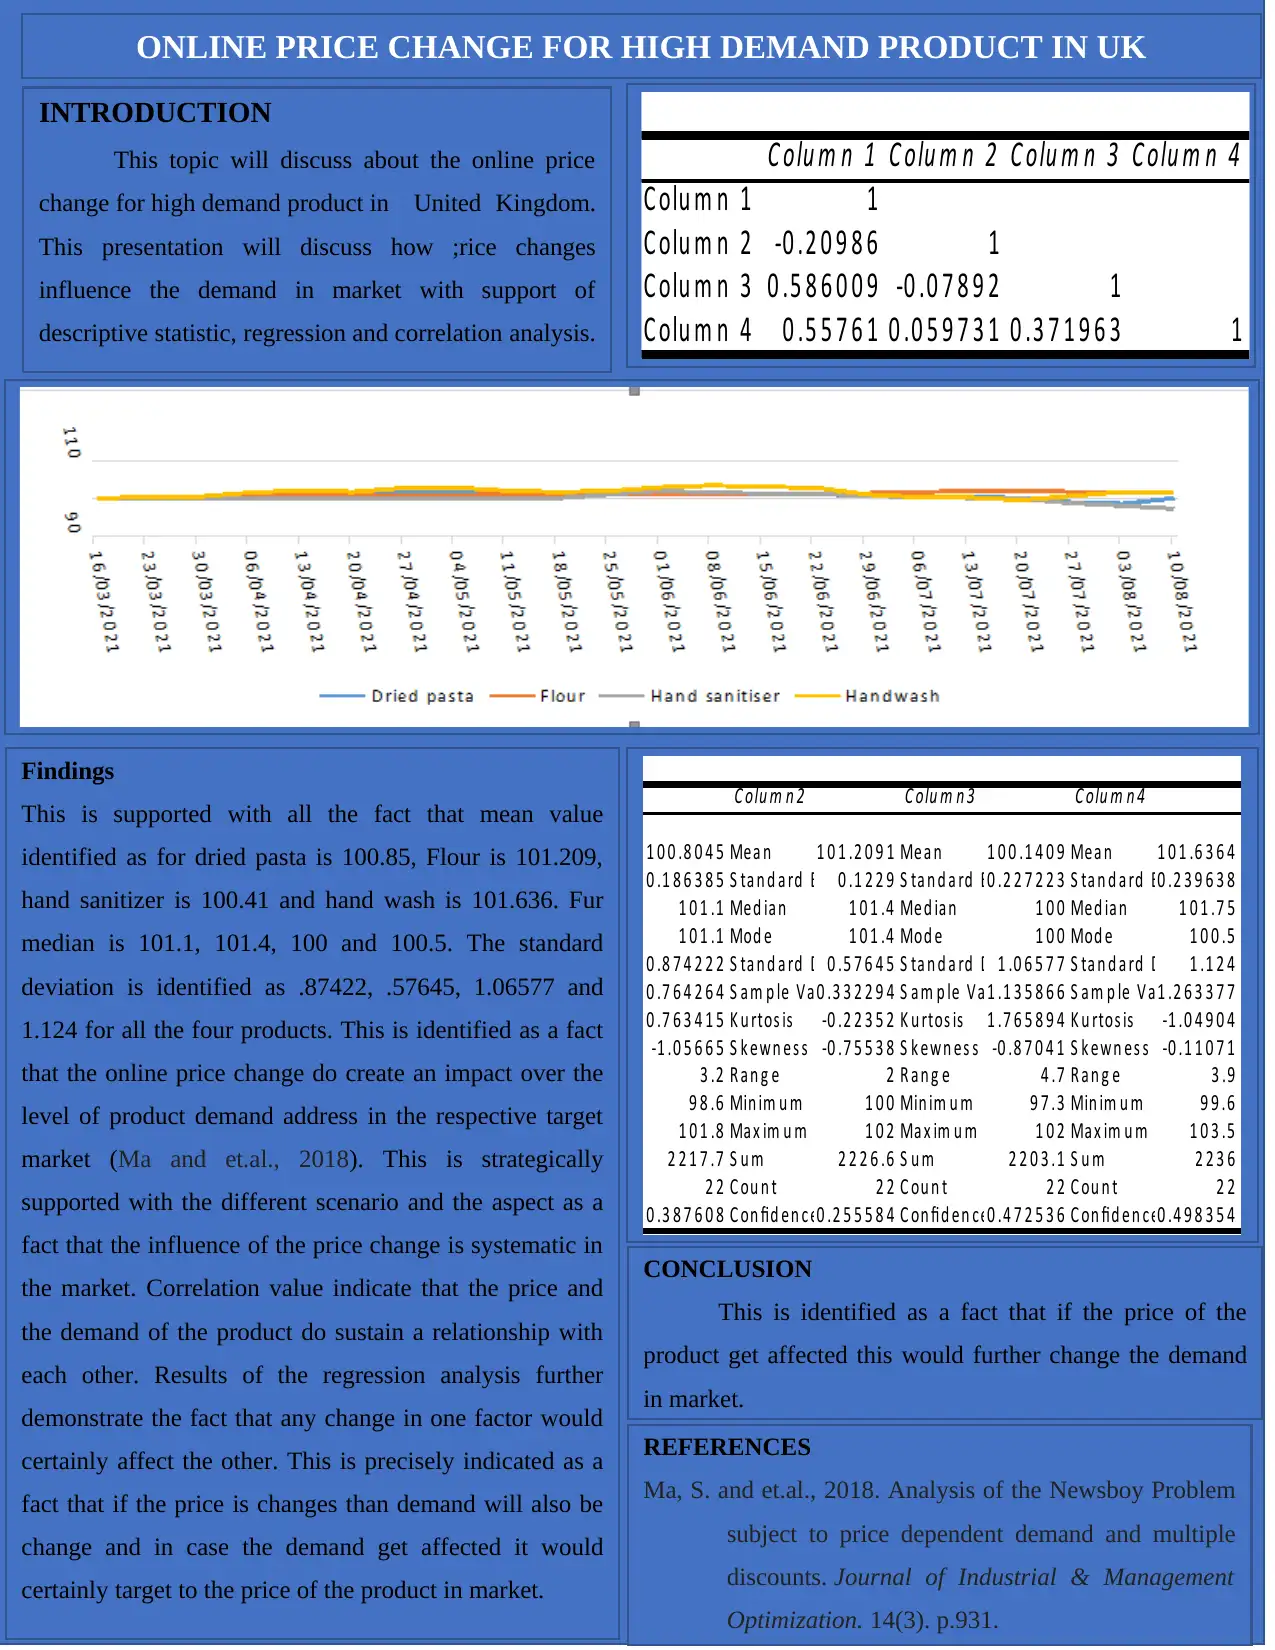
This presentation explores the impact of online price changes on high-demand products in the United Kingdom, utilizing descriptive statistics, regression, and correlation analysis. The findings indicate that online price changes significantly influence product demand. Mean values for dried pasta, flour, hand sanitizer, and hand wash are 100.85, 101.209, 100.41, and 101.636, respectively, with corresponding median values of 101.1, 101.4, 100, and 100.5. Standard deviations are .87422, .57645, 1.06577, and 1.124. Correlation values suggest a relationship between price and demand, further supported by regression analysis demonstrating that changes in price affect demand and vice versa. The analysis concludes that price fluctuations impact market demand, highlighting the systematic influence of price changes.
Document Page
ONLINE PRICE CHANGE FOR HIGH DEMAND PRODUCT IN UK
INTRODUCTION
This topic will discuss about the online price
change for high demand product in United Kingdom.
This presentation will discuss how ;rice changes
influence the demand in market with support of
descriptive statistic, regression and correlation analysis.
C olu m n 1 C olu m n 2 C olu m n 3 C olu m n 4
C olu m n 1 1
C olu m n 2 -0 .2 0 9 8 6 1
C olu m n 3 0 .5 8 6 0 0 9 -0 .0 7 8 9 2 1
C olu m n 4 0 .5 5 7 6 1 0 .0 5 9 7 3 1 0 .3 7 1 9 6 3 1
Findings
This is supported with all the fact that mean value
identified as for dried pasta is 100.85, Flour is 101.209,
hand sanitizer is 100.41 and hand wash is 101.636. Fur
median is 101.1, 101.4, 100 and 100.5. The standard
deviation is identified as .87422, .57645, 1.06577 and
1.124 for all the four products. This is identified as a fact
that the online price change do create an impact over the
level of product demand address in the respective target
market (Ma and et.al., 2018). This is strategically
supported with the different scenario and the aspect as a
fact that the influence of the price change is systematic in
the market. Correlation value indicate that the price and
the demand of the product do sustain a relationship with
each other. Results of the regression analysis further
demonstrate the fact that any change in one factor would
certainly affect the other. This is precisely indicated as a
fact that if the price is changes than demand will also be
change and in case the demand get affected it would
certainly target to the price of the product in market.
C olu m n 2 C olu m n 3 C olu m n 4
1 0 0 .8 0 4 5 Me a n 1 0 1 .2 0 9 1 Me a n 1 0 0 .1 4 0 9 Me a n 1 0 1 .6 3 6 4
0 .1 8 6 3 8 5 S ta n d a rd E rror0 .1 2 2 9 S ta n d a rd E rror0 .2 2 7 2 2 3 S ta n d a rd E rror0 .2 3 9 6 3 8
1 0 1 .1 Me d ia n 1 0 1 .4 Me d ia n 1 0 0 Me d ia n 1 0 1 .7 5
1 0 1 .1 Mod e 1 0 1 .4 Mod e 1 0 0 Mod e 1 0 0 .5
0 .8 7 4 2 2 2 S ta n d a rd D e v ia ti on0 .5 7 6 4 5 S ta n d a rd D e v ia ti on1 .0 6 5 7 7 S ta n d a rd D e v ia ti on1 .1 2 4
0 .7 6 4 2 6 4 S a m p le V a ria n c e0 .3 3 2 2 9 4 S a m p le V a ria n c e1 .1 3 5 8 6 6 S a m p le V a ria n c e1 .2 6 3 3 7 7
0 .7 6 3 4 1 5 K u rtos is -0 .2 2 3 5 2 K u rtos is 1 .7 6 5 8 9 4 K u rtos is -1 .0 4 9 0 4
-1 .0 5 6 6 5 S k e w n e s s -0 .7 5 5 3 8 S k e w n e s s -0 .8 7 0 4 1 S k e w n e s s -0 .1 1 0 7 1
3 .2 R a n g e 2 R a n g e 4 .7 R a n g e 3 .9
9 8 .6 Min im u m 1 0 0 Min im u m 9 7 .3 Min im u m 9 9 .6
1 0 1 .8 Ma x im u m 1 0 2 Ma x im u m 1 0 2 Ma x im u m 1 0 3 .5
2 2 1 7 .7 S u m 2 2 2 6 .6 S u m 2 2 0 3 .1 S u m 2 2 3 6
2 2 C ou n t 2 2 C ou n t 2 2 C ou n t 2 2
0 .3 8 7 6 0 8 C on fid e n c e L e v e l( 9 5 .0 % )0 .2 5 5 5 8 4 C on fid e n c e L e v e l( 9 5 .0 % )0 .4 7 2 5 3 6 C on fid e n c e L e v e l( 9 5 .0 % )0 .4 9 8 3 5 4
CONCLUSION
This is identified as a fact that if the price of the
product get affected this would further change the demand
in market.
REFERENCES
Ma, S. and et.al., 2018. Analysis of the Newsboy Problem
subject to price dependent demand and multiple
discounts. Journal of Industrial & Management
Optimization. 14(3). p.931.
tabler-icon-diamond-filled.svg

Paraphrase This Document

Need a fresh take? Get an instant paraphrase of this document with our AI Paraphraser
[object Object]