A Report on Price Earnings Ratio Analysis of Selected Food Companies
VerifiedAdded on 2023/06/10
|16
|5744
|351
Report
AI Summary
This report provides an analysis of the price earnings ratio (P/E ratio) as a tool for investors to determine if shares are properly valued, focusing on the food and beverage sector. It compares the P/E ratios of selected companies like Capilano Honey Limited, China Dairy Corporation Limited, Coca-Cola Amatil Limited, and Collins Foods Limited, using the trailing method. The report reviews existing literature on the relationship between P/E ratios, earnings per share (EPS), and market prices, highlighting studies that explore whether low P/E ratios indicate superior stock performance and the impact of dividend policies on P/E ratios. The objective is to study the correlation between earnings per share and the market price of shares, with the conceptual framework defining EPS and market price as key variables, noting the influence of factors like profitability and market share on share prices.
SUNIL YADAV
WORKING TITLE:-
To compare the price earnings ratio of selected companies and checking if there shares are over
or under valued.
INTRODUCTION
There are various factors which affect the value of a company in share market. Volatility in
shares further changes the way investors react. Price earnings ratio is a tool which helps the
investors in determining whether the shares they bought are valued properly. Both underpriced
and overpriced shares affects investor’s decision for buying the shares. It is calculated by
dividing price of share in market to earnings of a share. There are two further types of
calculations for price earnings ratio. In trailing method the latest data is used. Trailing method
has been criticized on the fact that investors are only interested in future of the company. Their
decision is not affected by the profits which company has already earned. Other method used
for calculating ratio is termed as forecasted ratio. As the name indicates this ratio provides
more information about the future position of the company. It is based on some predictions by
the company. The disadvantage of this method is that more risk is involved while considering
this ratio. For the purpose of project trailing method will be used.
OBJECTIVE
To compare price earnings ratio of selected companies
To study the correlation between earnings per share and market price of share
CONCEPTUAL FRAMEWORK
The variables used in this project are earnings per share and market price of share.
Earnings per share are the earnings of individual shareholders according to the book
profits. Earnings per share can be calculated by two methods named as basic and
diluted. Basic earnings per share do not consider the impact of future obligations such
as conversion of preference shares and shares buying option. It is simply calculated by
dividing earnings with number of shareholders. On the other hand diluted earnings
consider the future impact of the equities and debt on number of shares. Thus it can be
said that diluted earnings per share is less risky than basic earnings per share. The other
factor that will be used is market price of share. Market price of share is the price at
Paraphrase This Document
Need a fresh take? Get an instant paraphrase of this document with our AI Paraphraser
SUNIL YADAV
which shareholders are ready to buy the shares. It is influenced by various factors such
as profitability, earnings per share and market share of organization etc. The price listed
in stock exchange will be used as market price of share. For the study in part two food
and beverage sector is selected.
Following is the list of the companies which will be studied for the project:-
CAPILANO HONEY LIMITED
CHINA DAIRY CORPORATION LIMITED
COCA-COLA AMATIL LIMITED
COLLINS FOODS LIMITED
REVIEW OF LITERATURE
Basu (1977) found out from a survey that stock with low price earnings ratio is more
superior. The reason he provided for this superior return is the risk adjustment. Fuller et
al. (1993) also conducted the study on price earnings ratio and market price and found
that companies which had less price earnings ratio are having more returns than
companies with high price earnings ratio. They also asserted that the price of the shares
under the sample is not priced rightly. Dreman (1994) also found the same findings as
above. But he also provided a recommendation to the investors. He stated that if
investors want to utilize the price earnings formula for good returns then they should
hold the shares for a long period. This technique is useful if used in long run. Siegel
(1995) also studied the share price by analyzing the price earnings ratio and stated that
in long term the shares with high P/E ratio performed well. Jitmaneeroj, B. (2017)
studied the relationship among dividend policies and P/E ratio. He found that the
relationship is not visible in short run. However, if stocks are analyzed for a long run
then there is a significant relationship among the variables.
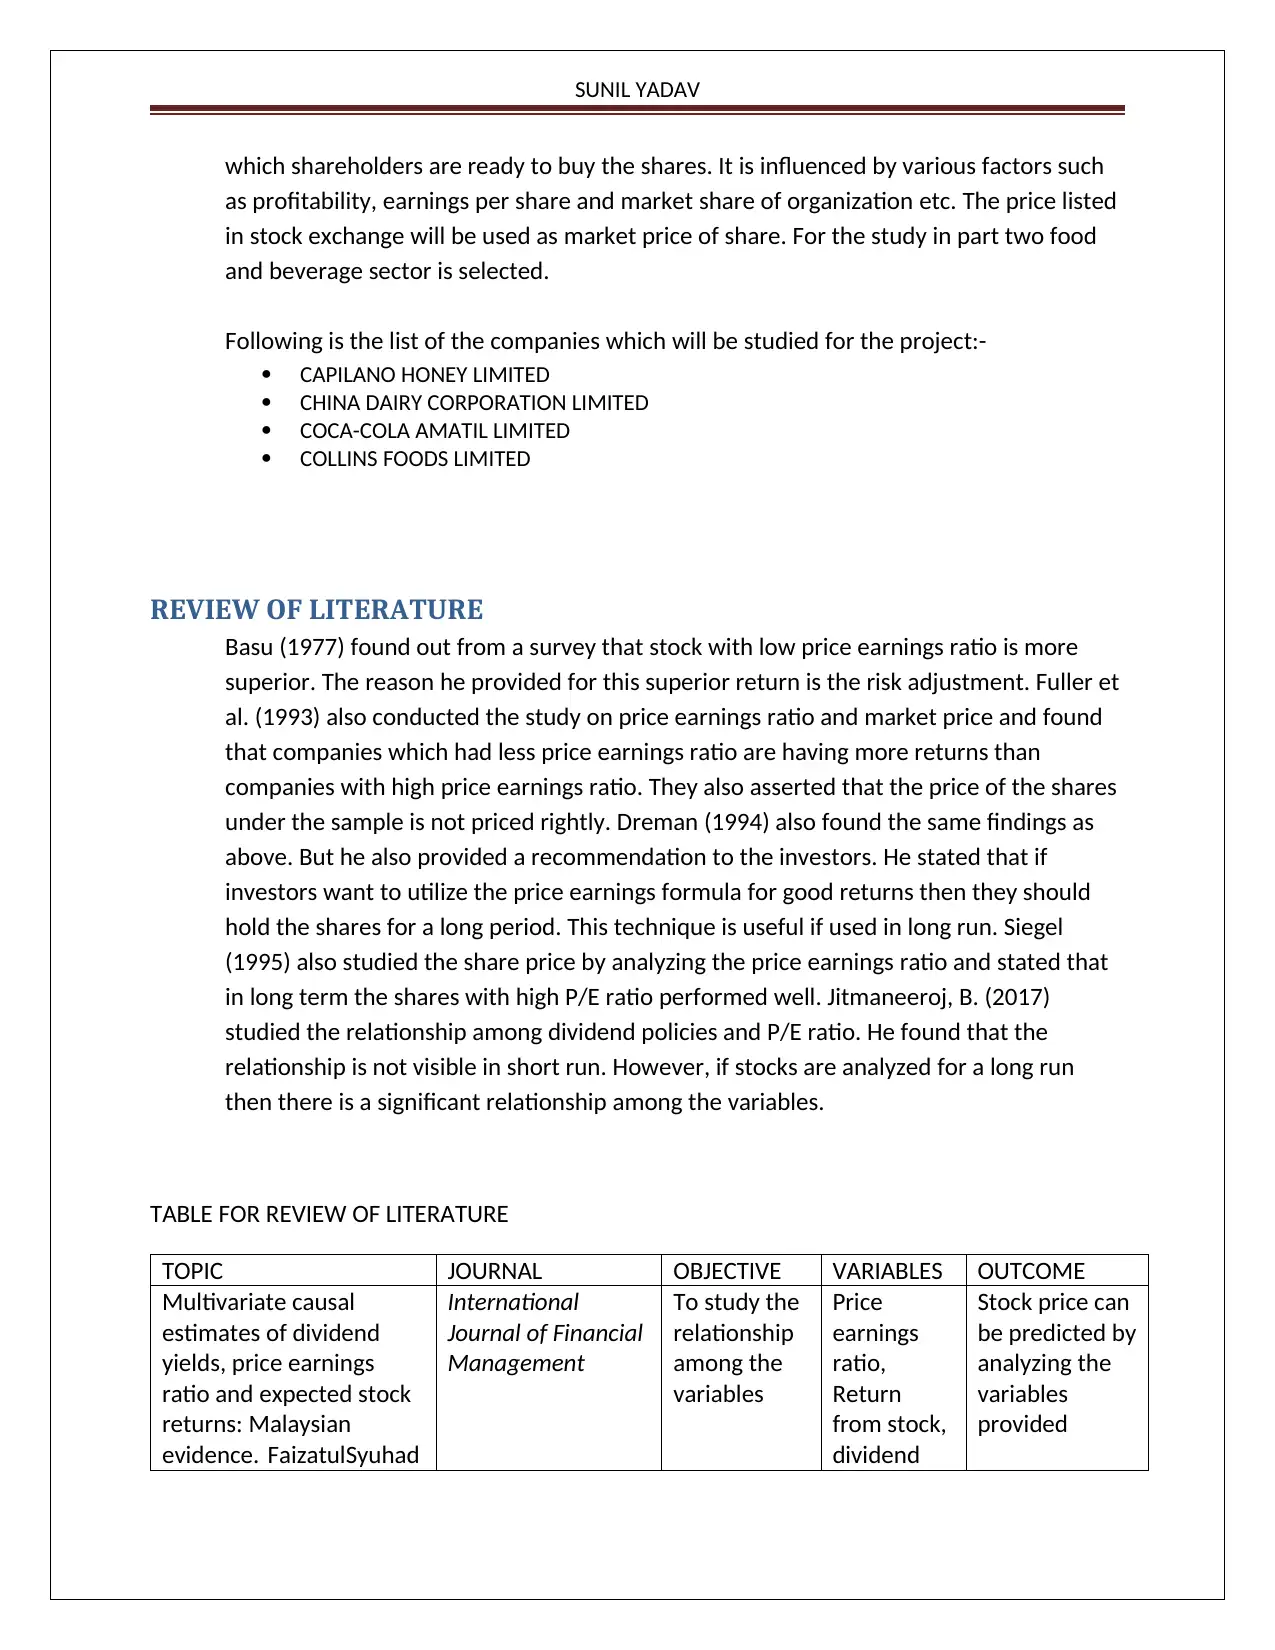
TABLE FOR REVIEW OF LITERATURE
TOPIC JOURNAL OBJECTIVE VARIABLES OUTCOME
Multivariate causal
estimates of dividend
yields, price earnings
ratio and expected stock
returns: Malaysian
evidence. FaizatulSyuhad
International
Journal of Financial
Management
To study the
relationship
among the
variables
Price
earnings
ratio,
Return
from stock,
dividend
Stock price can
be predicted by
analyzing the
variables
provided
which shareholders are ready to buy the shares. It is influenced by various factors such
as profitability, earnings per share and market share of organization etc. The price listed
in stock exchange will be used as market price of share. For the study in part two food
and beverage sector is selected.
Following is the list of the companies which will be studied for the project:-
CAPILANO HONEY LIMITED
CHINA DAIRY CORPORATION LIMITED
COCA-COLA AMATIL LIMITED
COLLINS FOODS LIMITED
REVIEW OF LITERATURE
Basu (1977) found out from a survey that stock with low price earnings ratio is more
superior. The reason he provided for this superior return is the risk adjustment. Fuller et
al. (1993) also conducted the study on price earnings ratio and market price and found
that companies which had less price earnings ratio are having more returns than
companies with high price earnings ratio. They also asserted that the price of the shares
under the sample is not priced rightly. Dreman (1994) also found the same findings as
above. But he also provided a recommendation to the investors. He stated that if
investors want to utilize the price earnings formula for good returns then they should
hold the shares for a long period. This technique is useful if used in long run. Siegel
(1995) also studied the share price by analyzing the price earnings ratio and stated that
in long term the shares with high P/E ratio performed well. Jitmaneeroj, B. (2017)
studied the relationship among dividend policies and P/E ratio. He found that the
relationship is not visible in short run. However, if stocks are analyzed for a long run
then there is a significant relationship among the variables.
TABLE FOR REVIEW OF LITERATURE
TOPIC JOURNAL OBJECTIVE VARIABLES OUTCOME
Multivariate causal
estimates of dividend
yields, price earnings
ratio and expected stock
returns: Malaysian
evidence. FaizatulSyuhad
International
Journal of Financial
Management
To study the
relationship
among the
variables
Price
earnings
ratio,
Return
from stock,
dividend
Stock price can
be predicted by
analyzing the
variables
provided
SUNIL YADAV
a& Wan Mansor. (2011) yield
The value and glamor
stocks performance at
the Indonesia stocks
exchange using the price
earnings ratio
approach. Hasnawati,
(2010)
The International
Business &
Economics
Research Journal
Evaluating
the
portfolios
and testing
performance
of different
type of
stocks
Portfolio
stock and
investment
in one stock
Portfolio stocks
found in less
risk category
then glamor
stocks
The Analysis of Factors
Affecting Price Earnings
Ratio on the Company
Shares Registered in
Jakarta Islamic
Index. MuslichLutfi& Jessi
Arsitha(2016).
Academic Journal
of Economic
Studies
Analyzing
the factors
by applying
t- test and
simultaneous
test
Current and
non current
assets, debt
and equity,
dividend
payout
ratio
Excepy
dividend
payout ratio all
the variable
have affect on
price earning
ratio
Audit quality and
overvalued
equity. Houmes, Foley
&Cebula(2013).
Accounting
Research Journal
To check the
effect of
audit quality
on equity
valuation by
applying
price earning
ratio
Market
price of
shares and
earnings
per share
Significant and
positive
coefficients
found
Portfolio strategies using
EVA, earnings ratio or
book-to-market. Leong,
Pagani&Zaima(2009).
Review of
Accounting &
Finance
To find the
method for
earning
more returns
from EVAM
(earnings
value added
to market
value) and
price earning
ratio to book
value
Book value
of equity,
market
value of
equity
EVA method
considered
more reliable
for predicting
the share
prices
Unlocking the sources of
the apparent episodic
stationarity of the P/E
ratio. Karras, Jin-Man
&Neuburger(2007).
Review of
Accounting &
Finance
To check the
reason
behind the
non change
in price
earnings
ratio
Earnigs per
share and
market
price of
share
Results were
tested on stock
prices for
different
periods and
different
variation were
⊘ This is a preview!⊘
Do you want full access?
Subscribe today to unlock all pages.
Trusted by 1+ million students worldwide
SUNIL YADAV
found
An exploration of
earnings whispers
forecasts as predictors of
stock
returns. Abraham(2005).
Journal of
Economic Studies
To check
miller price
optimism
model by
applying
different
type of proxy
Investment
s in one
proposal
and
portfolio
manageme
nt and
stock prices
Stock with high
difference
indicated
towards
glamour stock
and other was
linked to value
stocks
Share Price Analyst With
PBV, DER, And EPS At
Initial Public
Offering. KriswantoKrisw
anto. (2016).
Journal the
Winners:
Economics
To analyze
the impact of
over and
under pricing
of share by
linking them
with
variables
PBV, DER
and EPS
Reason for
under pricing
was found and
stated
Earnings quality and P/E
ratio: Evidence from
Tehran Stock
Exchange. Hassan
Ghodrati,
&JaberGhanbari(2014).
Management
Science Letters
Checking the
relationship
of price
earnings
ratio with
various
variables
listed
Gross profit
ratio, profit
variability
and
accruals
Positive
relationship
with GP ratio
and negative
with variability
and no
relationship
with accounts
payables
Price-to-Earnings Ratios
and Option Prices. Chua,
DeLisle, Feng
&Lee(2015).
Journal Of Futures
Markets
To check the
relationship
between
valuation
and option
pricing by
applying
different
models
Price
earning
ratio, sales
and prices
of stock
Model
developed to
support the
findings
Value matters:
Predictability of stock
index returns. Angelini,
Bormetti,Marmi&Nardini(
2012
To analyze
the
predictability
of share
prices by
applying
price
earnings
Price
earnings
ratio and
stock price
fluctuations
Model can be
used to predict
the nature of
share prices
Paraphrase This Document
Need a fresh take? Get an instant paraphrase of this document with our AI Paraphraser
SUNIL YADAV
ratio
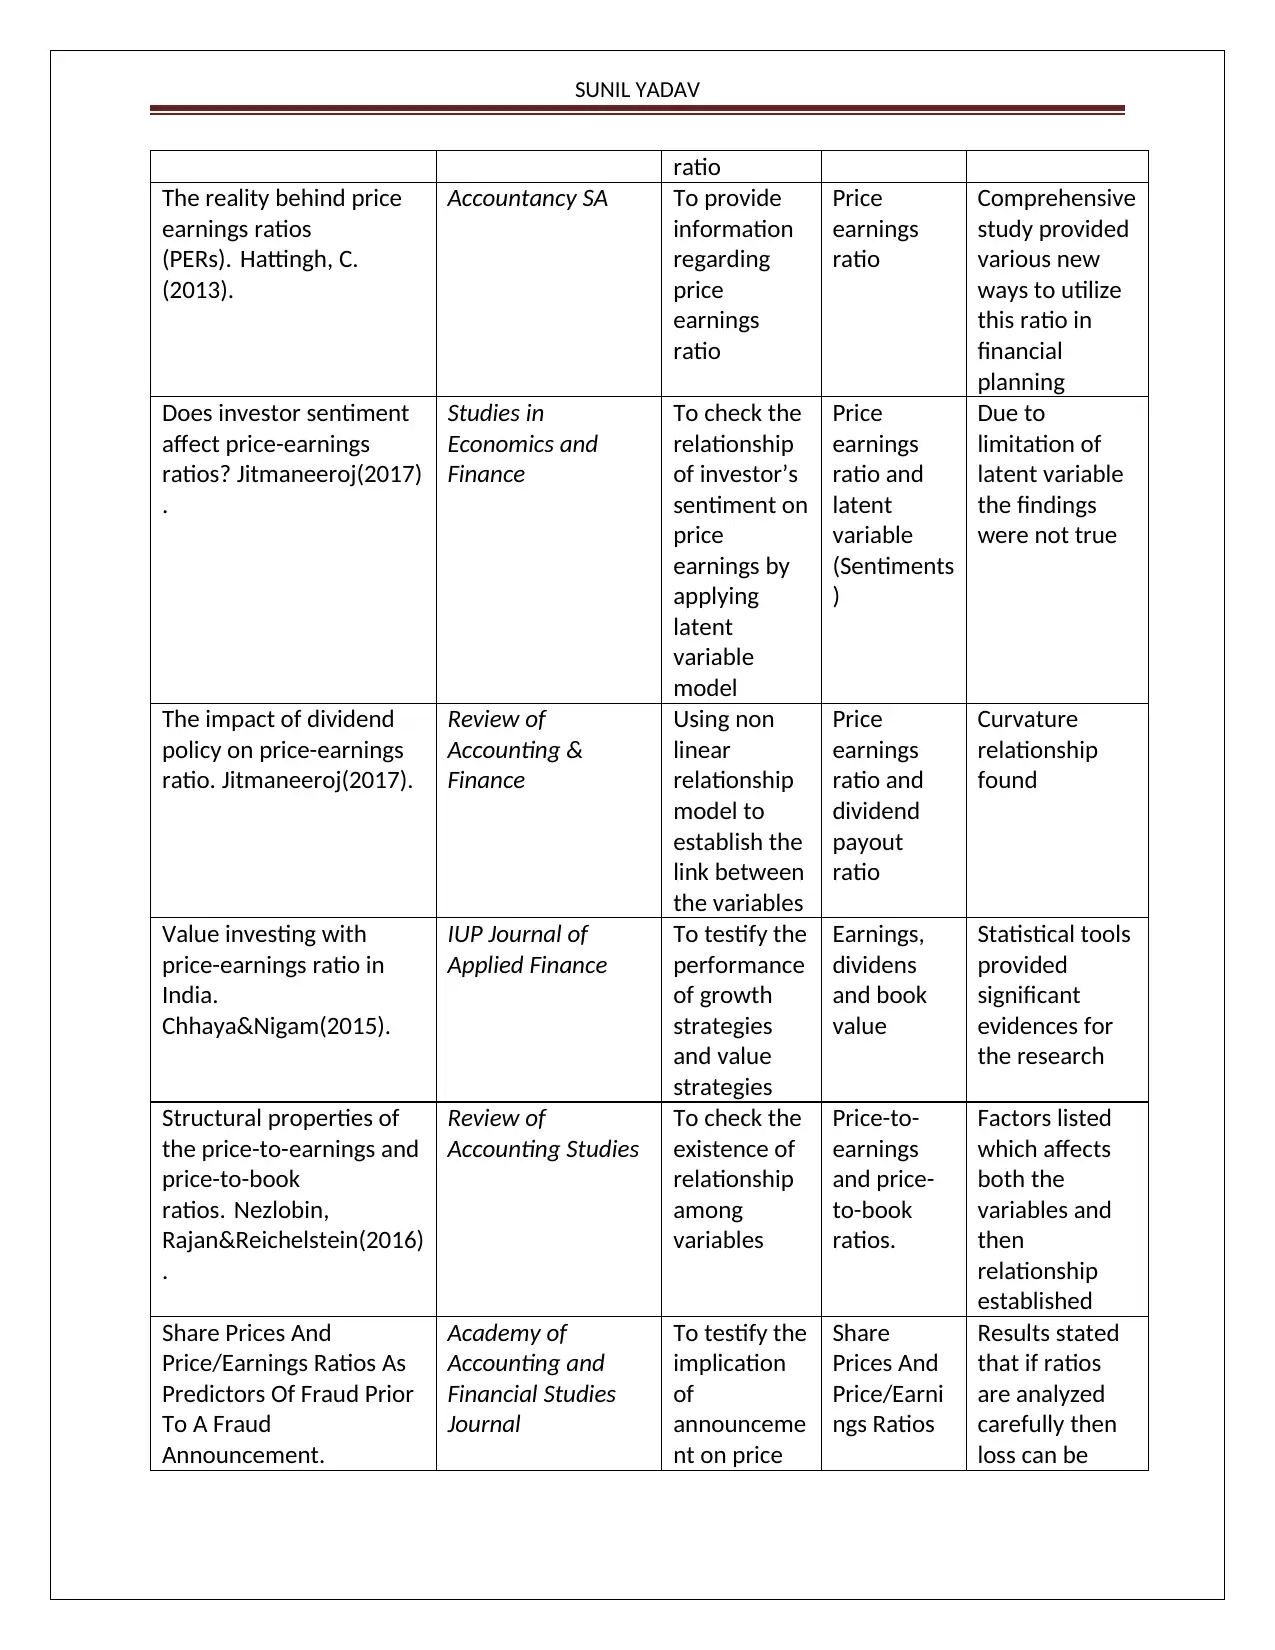
The reality behind price
earnings ratios
(PERs). Hattingh, C.
(2013).
Accountancy SA To provide
information
regarding
price
earnings
ratio
Price
earnings
ratio
Comprehensive
study provided
various new
ways to utilize
this ratio in
financial
planning
Does investor sentiment
affect price-earnings
ratios? Jitmaneeroj(2017)
.
Studies in
Economics and
Finance
To check the
relationship
of investor’s
sentiment on
price
earnings by
applying
latent
variable
model
Price
earnings
ratio and
latent
variable
(Sentiments
)
Due to
limitation of
latent variable
the findings
were not true
The impact of dividend
policy on price-earnings
ratio. Jitmaneeroj(2017).
Review of
Accounting &
Finance
Using non
linear
relationship
model to
establish the
link between
the variables
Price
earnings
ratio and
dividend
payout
ratio
Curvature
relationship
found
Value investing with
price-earnings ratio in
India.
Chhaya&Nigam(2015).
IUP Journal of
Applied Finance
To testify the
performance
of growth
strategies
and value
strategies
Earnings,
dividens
and book
value
Statistical tools
provided
significant
evidences for
the research
Structural properties of
the price-to-earnings and
price-to-book
ratios. Nezlobin,
Rajan&Reichelstein(2016)
.
Review of
Accounting Studies
To check the
existence of
relationship
among
variables
Price-to-
earnings
and price-
to-book
ratios.
Factors listed
which affects
both the
variables and
then
relationship
established
Share Prices And
Price/Earnings Ratios As
Predictors Of Fraud Prior
To A Fraud
Announcement.
Academy of
Accounting and
Financial Studies
Journal
To testify the
implication
of
announceme
nt on price
Share
Prices And
Price/Earni
ngs Ratios
Results stated
that if ratios
are analyzed
carefully then
loss can be
ratio
The reality behind price
earnings ratios
(PERs). Hattingh, C.
(2013).
Accountancy SA To provide
information
regarding
price
earnings
ratio
Price
earnings
ratio
Comprehensive
study provided
various new
ways to utilize
this ratio in
financial
planning
Does investor sentiment
affect price-earnings
ratios? Jitmaneeroj(2017)
.
Studies in
Economics and
Finance
To check the
relationship
of investor’s
sentiment on
price
earnings by
applying
latent
variable
model
Price
earnings
ratio and
latent
variable
(Sentiments
)
Due to
limitation of
latent variable
the findings
were not true
The impact of dividend
policy on price-earnings
ratio. Jitmaneeroj(2017).
Review of
Accounting &
Finance
Using non
linear
relationship
model to
establish the
link between
the variables
Price
earnings
ratio and
dividend
payout
ratio
Curvature
relationship
found
Value investing with
price-earnings ratio in
India.
Chhaya&Nigam(2015).
IUP Journal of
Applied Finance
To testify the
performance
of growth
strategies
and value
strategies
Earnings,
dividens
and book
value
Statistical tools
provided
significant
evidences for
the research
Structural properties of
the price-to-earnings and
price-to-book
ratios. Nezlobin,
Rajan&Reichelstein(2016)
.
Review of
Accounting Studies
To check the
existence of
relationship
among
variables
Price-to-
earnings
and price-
to-book
ratios.
Factors listed
which affects
both the
variables and
then
relationship
established
Share Prices And
Price/Earnings Ratios As
Predictors Of Fraud Prior
To A Fraud
Announcement.
Academy of
Accounting and
Financial Studies
Journal
To testify the
implication
of
announceme
nt on price
Share
Prices And
Price/Earni
ngs Ratios
Results stated
that if ratios
are analyzed
carefully then
loss can be
SUNIL YADAV
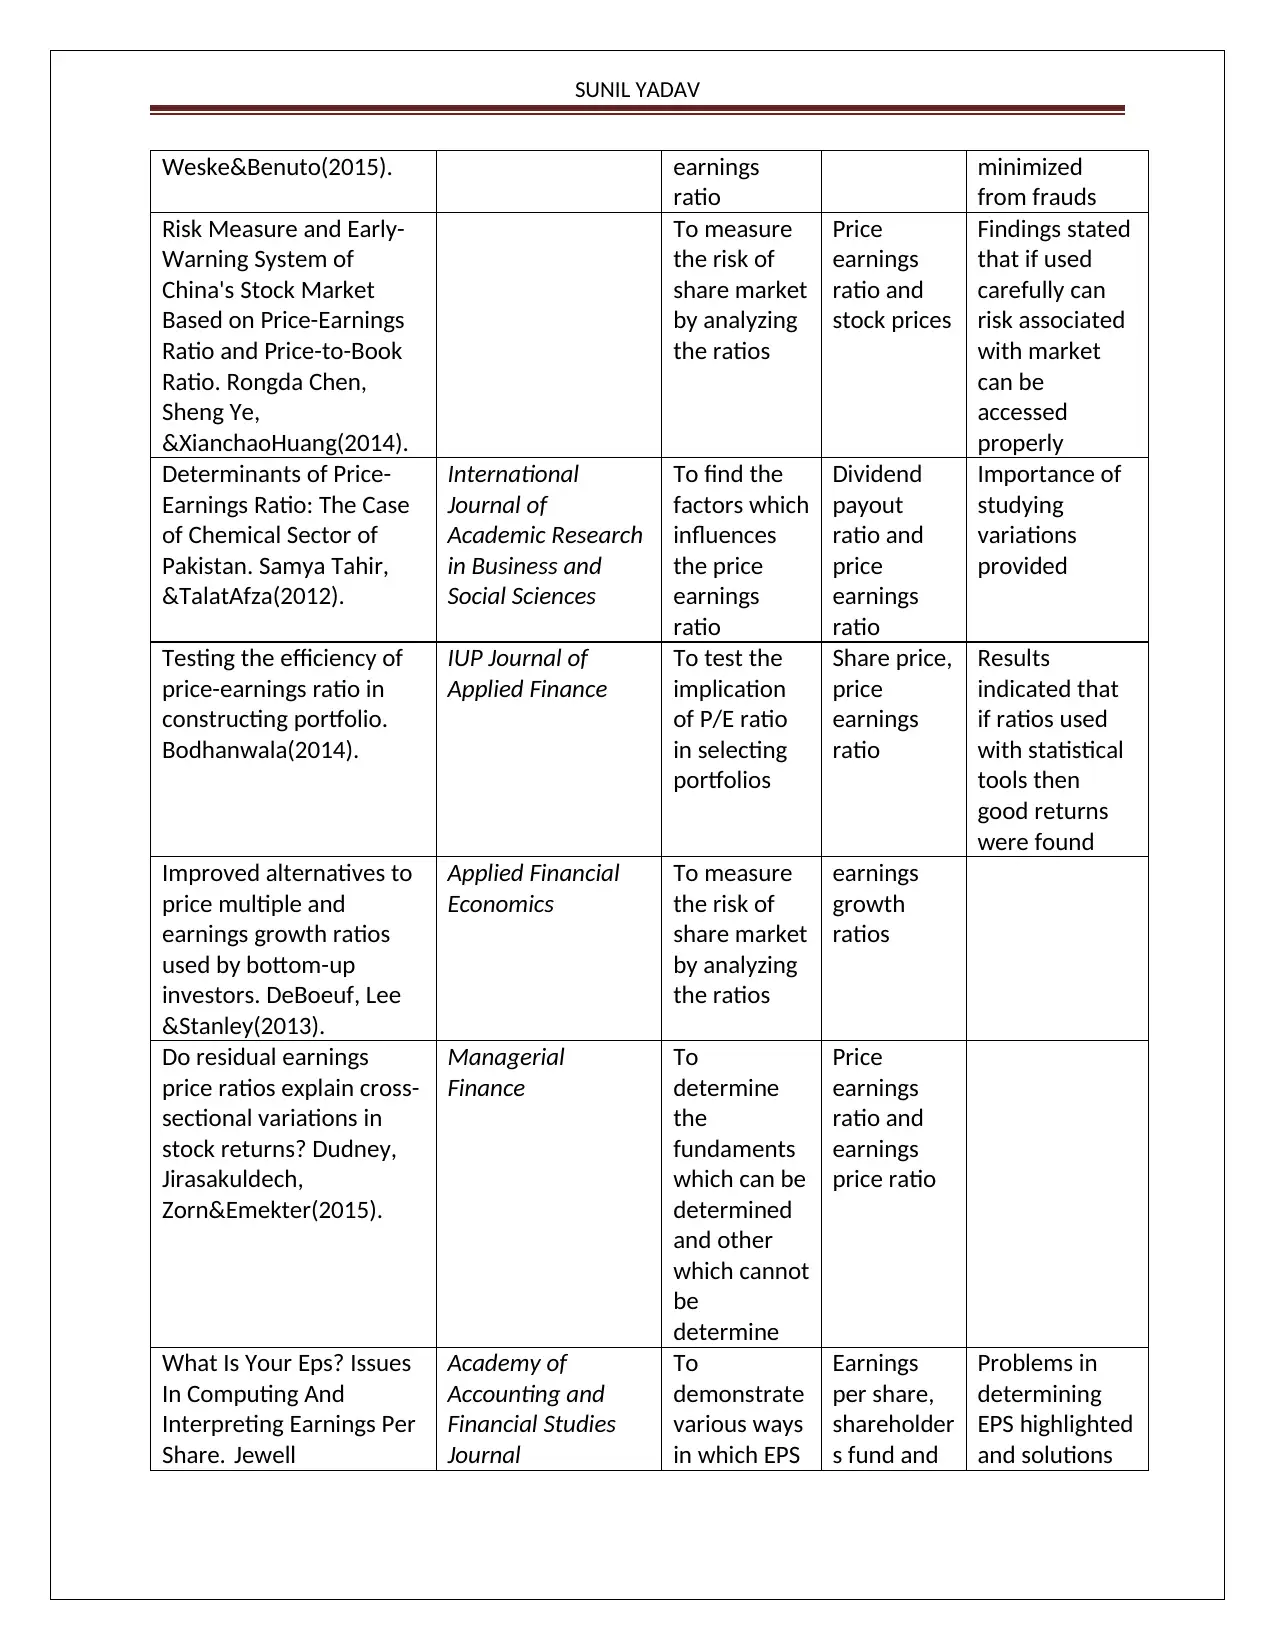
Weske&Benuto(2015). earnings
ratio
minimized
from frauds
Risk Measure and Early-
Warning System of
China's Stock Market
Based on Price-Earnings
Ratio and Price-to-Book
Ratio. Rongda Chen,
Sheng Ye,
&XianchaoHuang(2014).
To measure
the risk of
share market
by analyzing
the ratios
Price
earnings
ratio and
stock prices
Findings stated
that if used
carefully can
risk associated
with market
can be
accessed
properly
Determinants of Price-
Earnings Ratio: The Case
of Chemical Sector of
Pakistan. Samya Tahir,
&TalatAfza(2012).
International
Journal of
Academic Research
in Business and
Social Sciences
To find the
factors which
influences
the price
earnings
ratio
Dividend
payout
ratio and
price
earnings
ratio
Importance of
studying
variations
provided
Testing the efficiency of
price-earnings ratio in
constructing portfolio.
Bodhanwala(2014).
IUP Journal of
Applied Finance
To test the
implication
of P/E ratio
in selecting
portfolios
Share price,
price
earnings
ratio
Results
indicated that
if ratios used
with statistical
tools then
good returns
were found
Improved alternatives to
price multiple and
earnings growth ratios
used by bottom-up
investors. DeBoeuf, Lee
&Stanley(2013).
Applied Financial
Economics
To measure
the risk of
share market
by analyzing
the ratios
earnings
growth
ratios
Do residual earnings
price ratios explain cross-
sectional variations in
stock returns? Dudney,
Jirasakuldech,
Zorn&Emekter(2015).
Managerial
Finance
To
determine
the
fundaments
which can be
determined
and other
which cannot
be
determine
Price
earnings
ratio and
earnings
price ratio
What Is Your Eps? Issues
In Computing And
Interpreting Earnings Per
Share. Jewell
Academy of
Accounting and
Financial Studies
Journal
To
demonstrate
various ways
in which EPS
Earnings
per share,
shareholder
s fund and
Problems in
determining
EPS highlighted
and solutions
⊘ This is a preview!⊘
Do you want full access?
Subscribe today to unlock all pages.
Trusted by 1+ million students worldwide
SUNIL YADAV
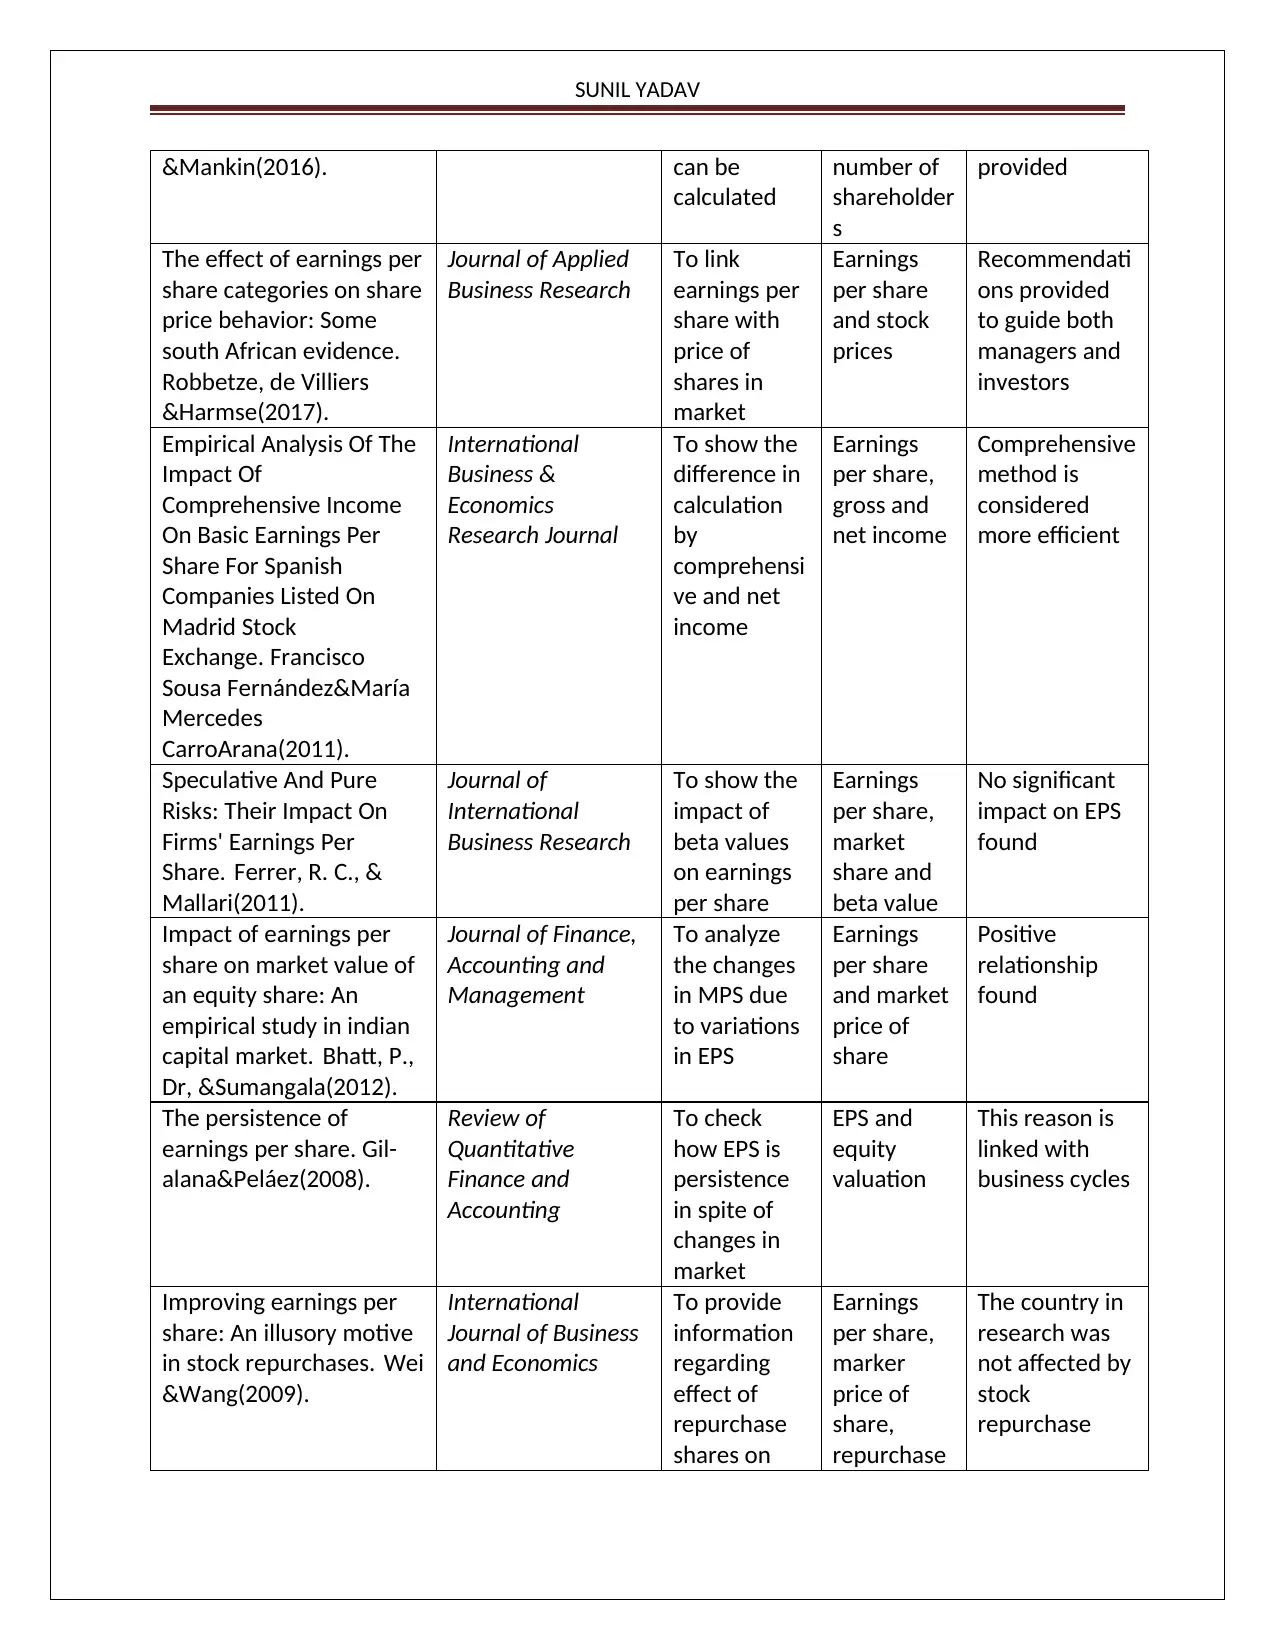
&Mankin(2016). can be
calculated
number of
shareholder
s
provided
The effect of earnings per
share categories on share
price behavior: Some
south African evidence.
Robbetze, de Villiers
&Harmse(2017).
Journal of Applied
Business Research
To link
earnings per
share with
price of
shares in
market
Earnings
per share
and stock
prices
Recommendati
ons provided
to guide both
managers and
investors
Empirical Analysis Of The
Impact Of
Comprehensive Income
On Basic Earnings Per
Share For Spanish
Companies Listed On
Madrid Stock
Exchange. Francisco
Sousa Fernández&María
Mercedes
CarroArana(2011).
International
Business &
Economics
Research Journal
To show the
difference in
calculation
by
comprehensi
ve and net
income
Earnings
per share,
gross and
net income
Comprehensive
method is
considered
more efficient
Speculative And Pure
Risks: Their Impact On
Firms' Earnings Per
Share. Ferrer, R. C., &
Mallari(2011).
Journal of
International
Business Research
To show the
impact of
beta values
on earnings
per share
Earnings
per share,
market
share and
beta value
No significant
impact on EPS
found
Impact of earnings per
share on market value of
an equity share: An
empirical study in indian
capital market. Bhatt, P.,
Dr, &Sumangala(2012).
Journal of Finance,
Accounting and
Management
To analyze
the changes
in MPS due
to variations
in EPS
Earnings
per share
and market
price of
share
Positive
relationship
found
The persistence of
earnings per share. Gil-
alana&Peláez(2008).
Review of
Quantitative
Finance and
Accounting
To check
how EPS is
persistence
in spite of
changes in
market
EPS and
equity
valuation
This reason is
linked with
business cycles
Improving earnings per
share: An illusory motive
in stock repurchases. Wei
&Wang(2009).
International
Journal of Business
and Economics
To provide
information
regarding
effect of
repurchase
shares on
Earnings
per share,
marker
price of
share,
repurchase
The country in
research was
not affected by
stock
repurchase
Paraphrase This Document
Need a fresh take? Get an instant paraphrase of this document with our AI Paraphraser
SUNIL YADAV
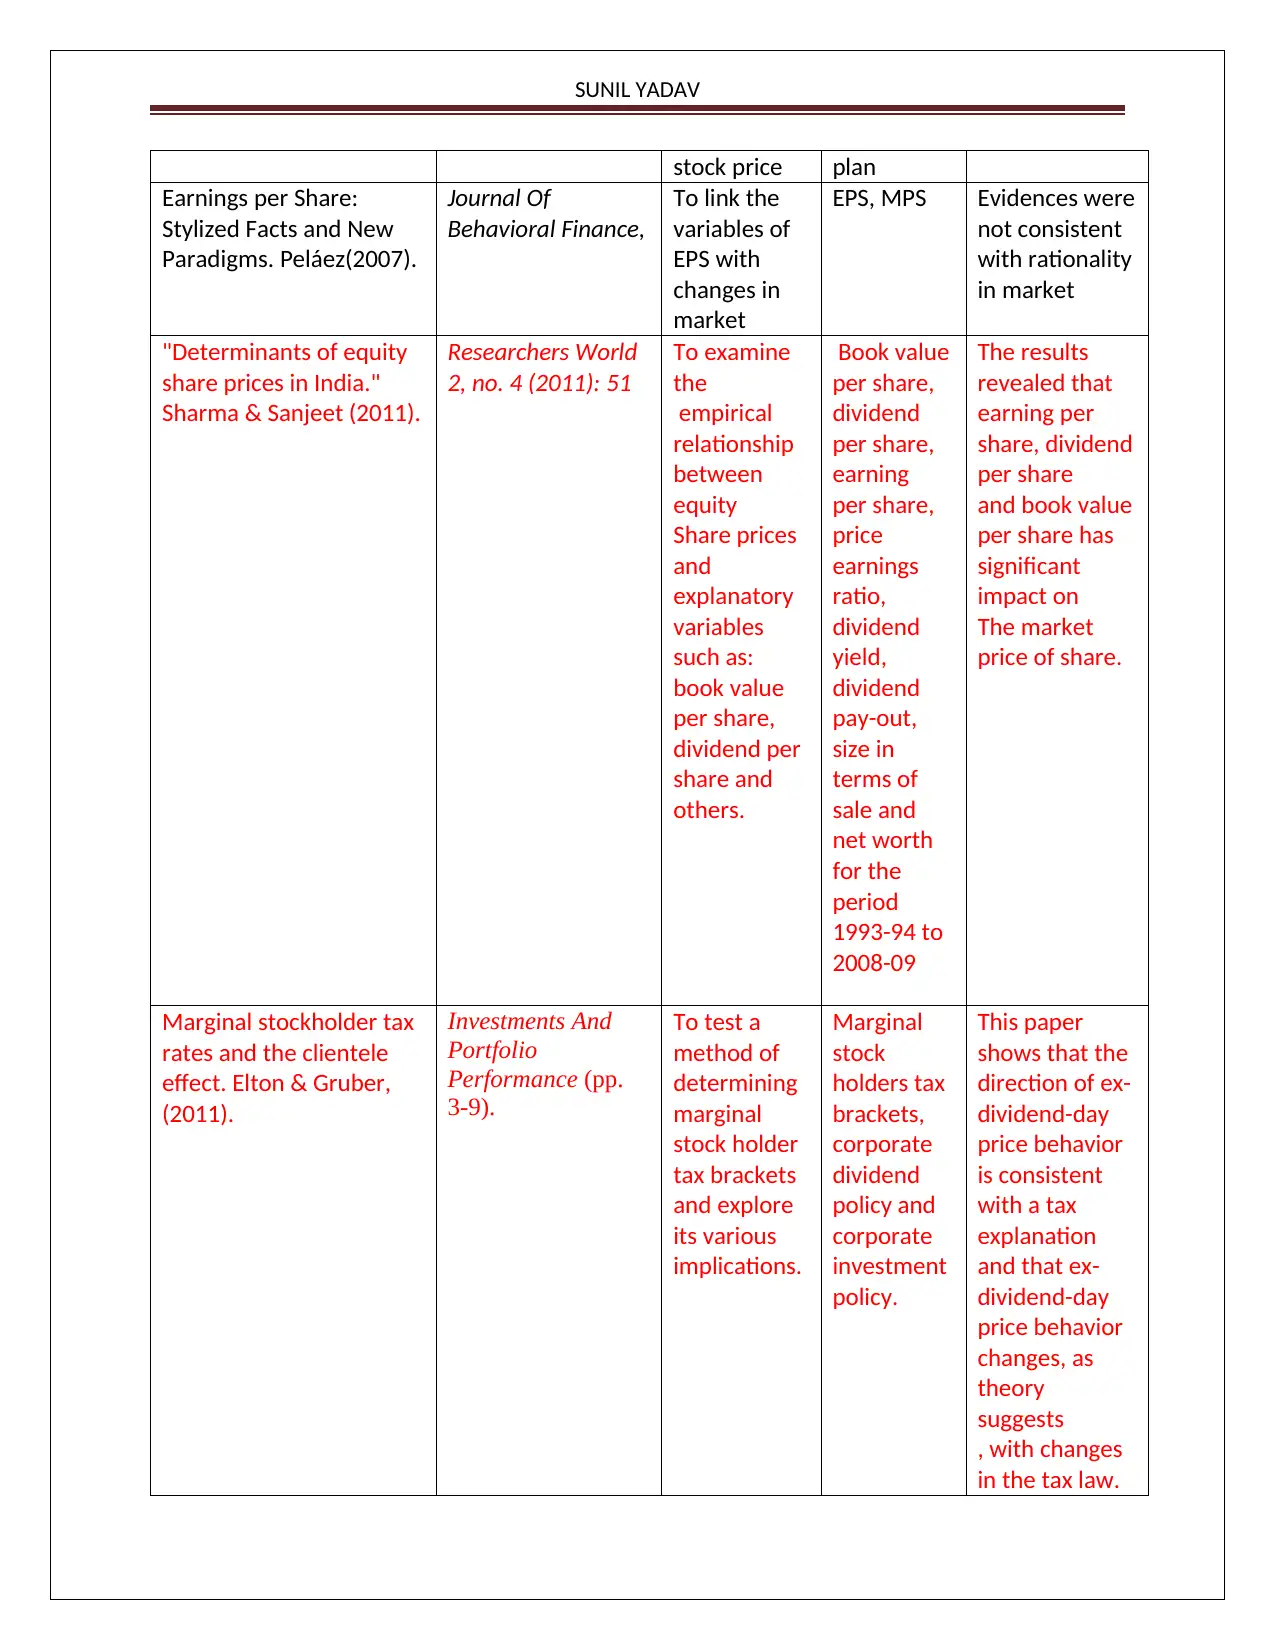
stock price plan
Earnings per Share:
Stylized Facts and New
Paradigms. Peláez(2007).
Journal Of
Behavioral Finance,
To link the
variables of
EPS with
changes in
market
EPS, MPS Evidences were
not consistent
with rationality
in market
"Determinants of equity
share prices in India."
Sharma & Sanjeet (2011).
Researchers World
2, no. 4 (2011): 51
To examine
the
empirical
relationship
between
equity
Share prices
and
explanatory
variables
such as:
book value
per share,
dividend per
share and
others.
Book value
per share,
dividend
per share,
earning
per share,
price
earnings
ratio,
dividend
yield,
dividend
pay-out,
size in
terms of
sale and
net worth
for the
period
1993-94 to
2008-09
The results
revealed that
earning per
share, dividend
per share
and book value
per share has
significant
impact on
The market
price of share.
Marginal stockholder tax
rates and the clientele
effect. Elton & Gruber,
(2011).
Investments And
Portfolio
Performance (pp.
3-9).
To test a
method of
determining
marginal
stock holder
tax brackets
and explore
its various
implications.
Marginal
stock
holders tax
brackets,
corporate
dividend
policy and
corporate
investment
policy.
This paper
shows that the
direction of ex-
dividend-day
price behavior
is consistent
with a tax
explanation
and that ex-
dividend-day
price behavior
changes, as
theory
suggests
, with changes
in the tax law.
SUNIL YADAV
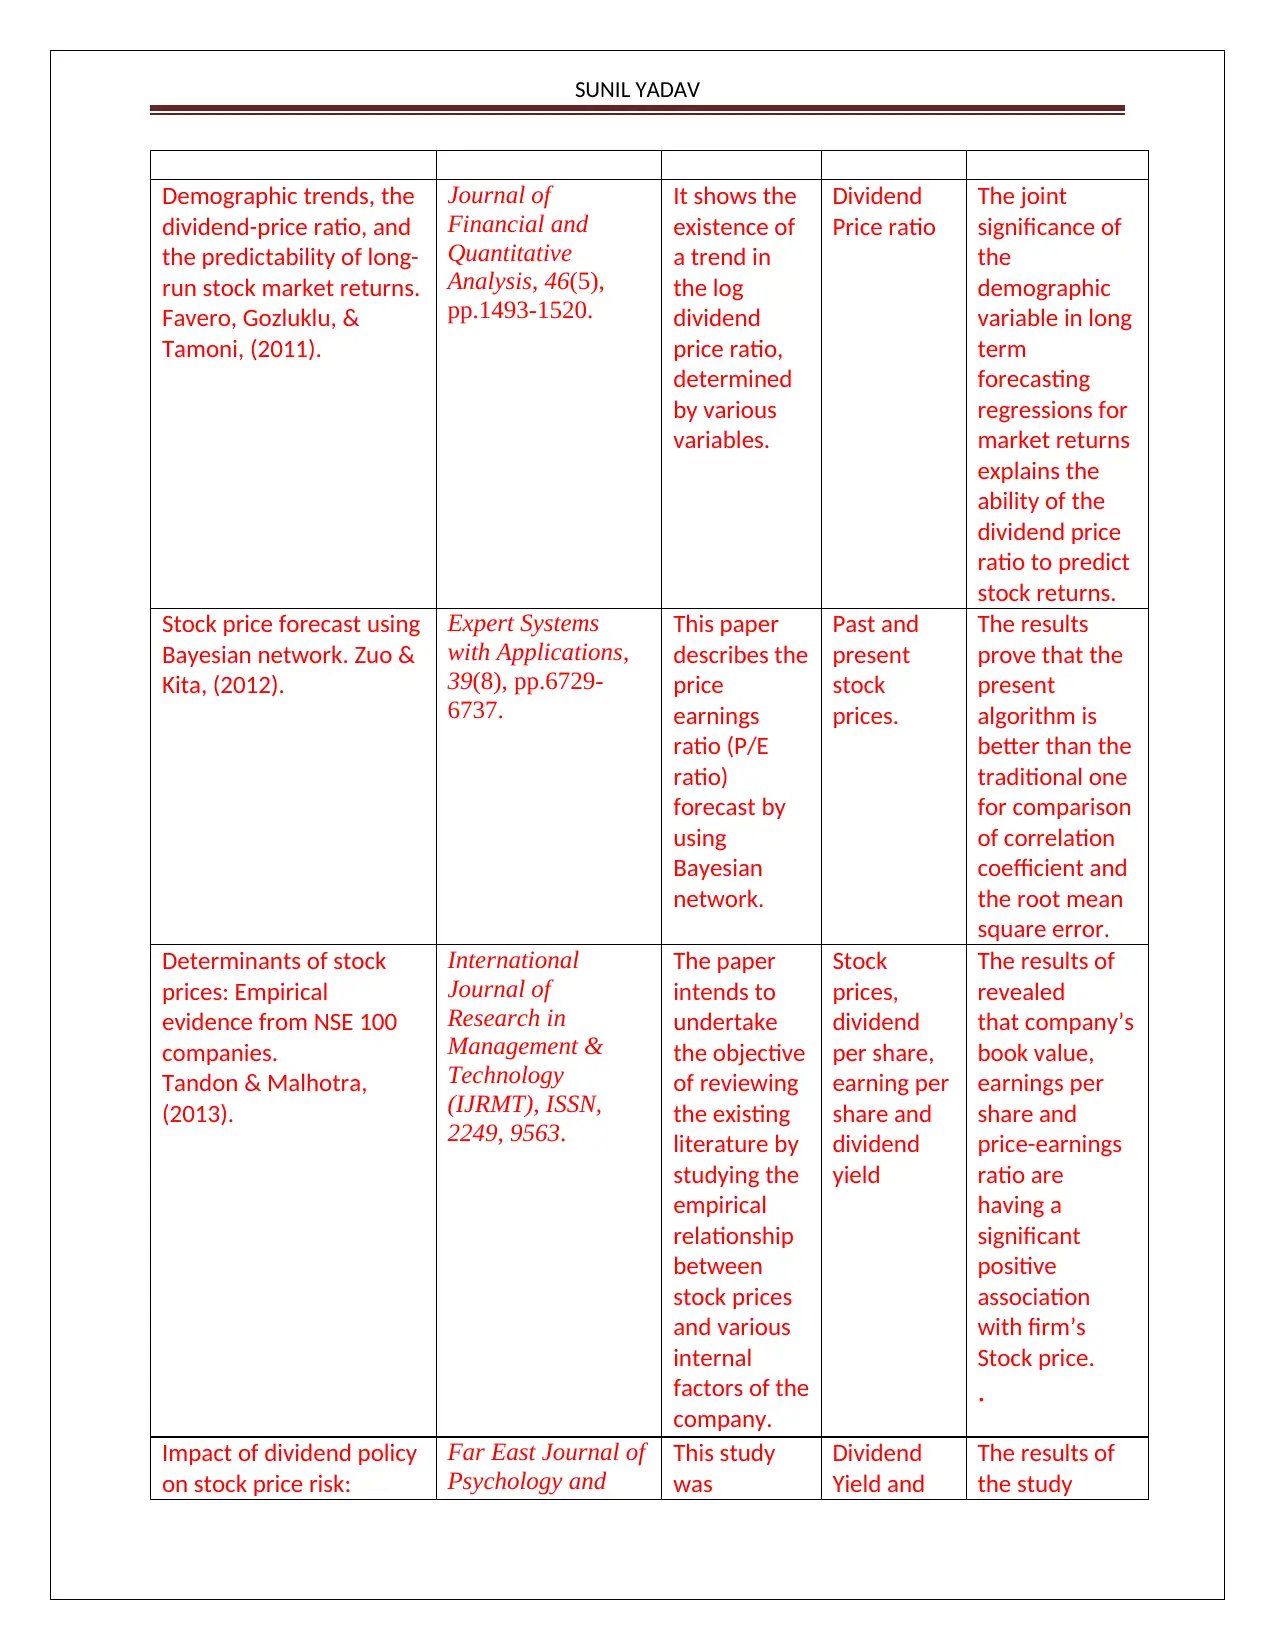
Demographic trends, the
dividend-price ratio, and
the predictability of long-
run stock market returns.
Favero, Gozluklu, &
Tamoni, (2011).
Journal of
Financial and
Quantitative
Analysis, 46(5),
pp.1493-1520.
It shows the
existence of
a trend in
the log
dividend
price ratio,
determined
by various
variables.
Dividend
Price ratio
The joint
significance of
the
demographic
variable in long
term
forecasting
regressions for
market returns
explains the
ability of the
dividend price
ratio to predict
stock returns.
Stock price forecast using
Bayesian network. Zuo &
Kita, (2012).
Expert Systems
with Applications,
39(8), pp.6729-
6737.
This paper
describes the
price
earnings
ratio (P/E
ratio)
forecast by
using
Bayesian
network.
Past and
present
stock
prices.
The results
prove that the
present
algorithm is
better than the
traditional one
for comparison
of correlation
coefficient and
the root mean
square error.
Determinants of stock
prices: Empirical
evidence from NSE 100
companies.
Tandon & Malhotra,
(2013).
International
Journal of
Research in
Management &
Technology
(IJRMT), ISSN,
2249, 9563.
The paper
intends to
undertake
the objective
of reviewing
the existing
literature by
studying the
empirical
relationship
between
stock prices
and various
internal
factors of the
company.
Stock
prices,
dividend
per share,
earning per
share and
dividend
yield
The results of
revealed
that company’s
book value,
earnings per
share and
price-earnings
ratio are
having a
significant
positive
association
with firm’s
Stock price.
.
Impact of dividend policy
on stock price risk:
Far East Journal of
Psychology and
This study
was
Dividend
Yield and
The results of
the study
⊘ This is a preview!⊘
Do you want full access?
Subscribe today to unlock all pages.
Trusted by 1+ million students worldwide
SUNIL YADAV
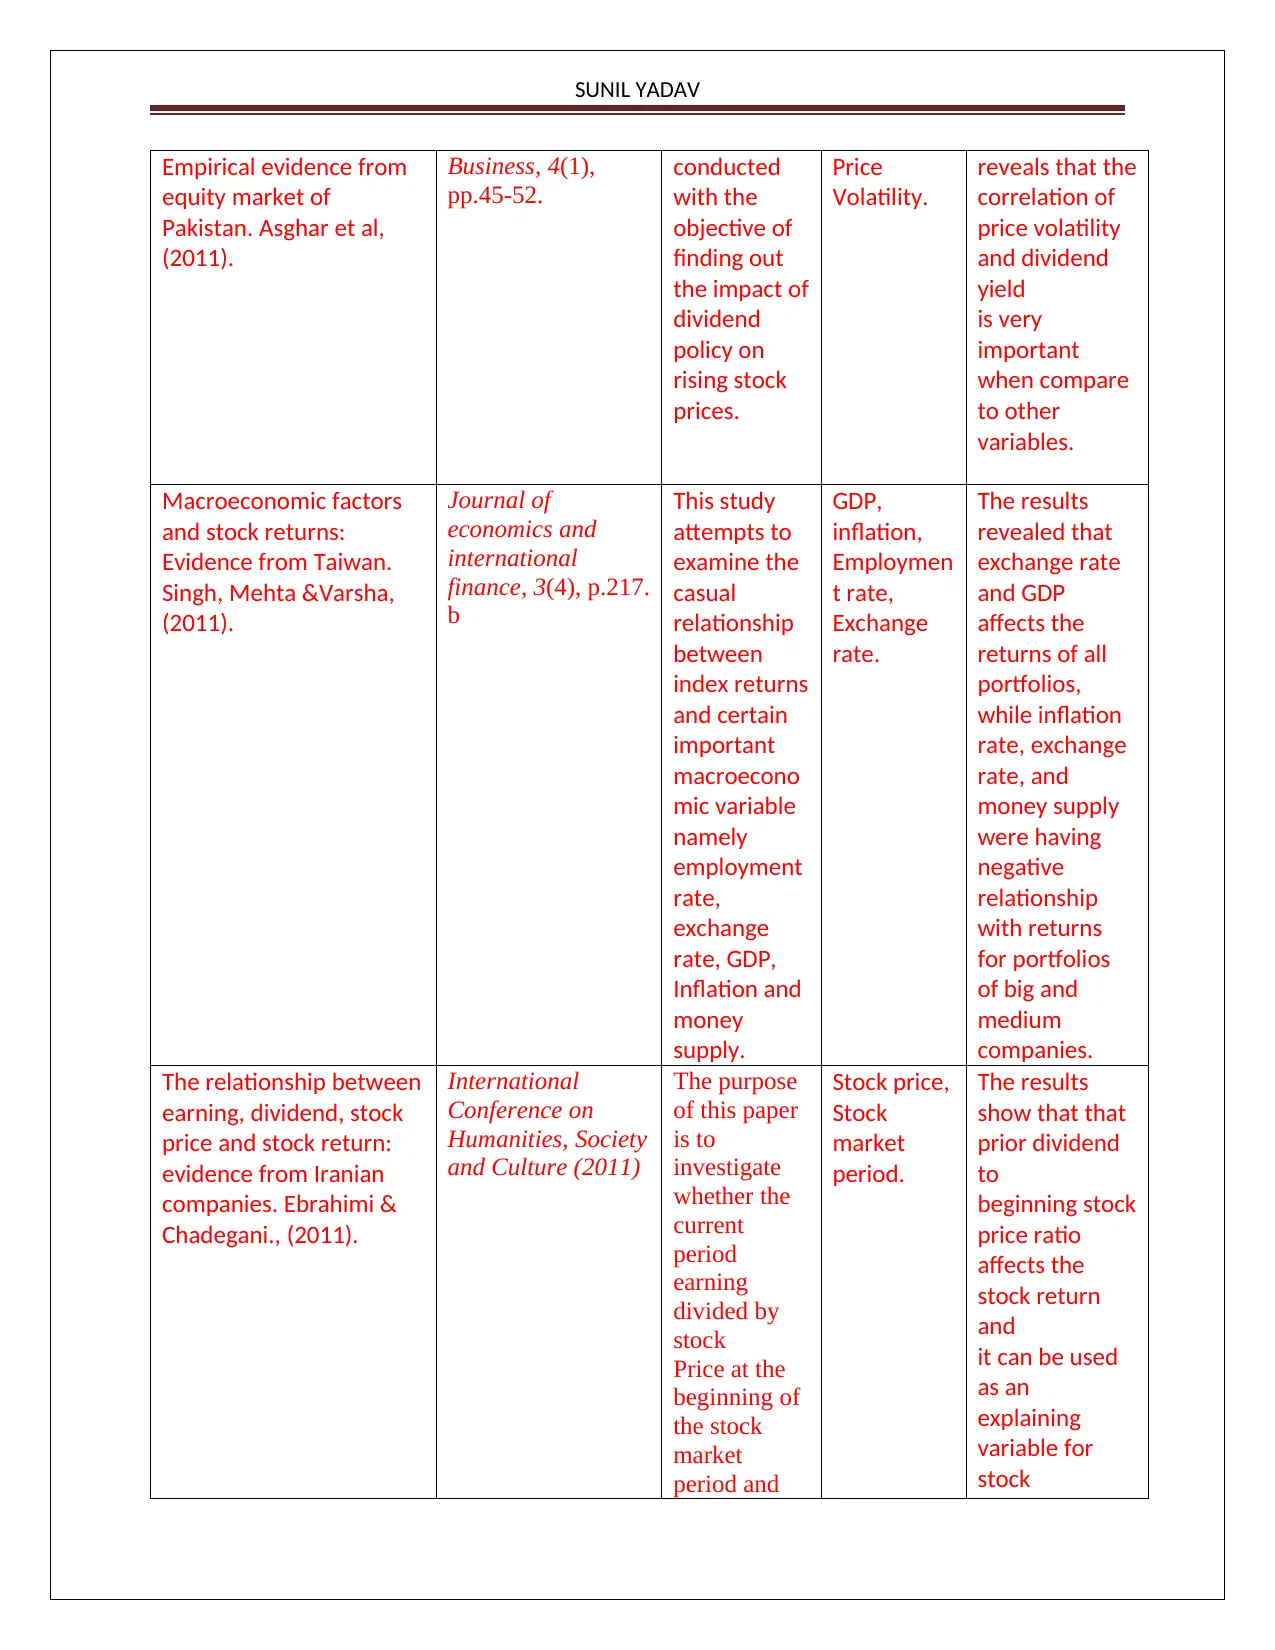
Empirical evidence from
equity market of
Pakistan. Asghar et al,
(2011).
Business, 4(1),
pp.45-52.
conducted
with the
objective of
finding out
the impact of
dividend
policy on
rising stock
prices.
Price
Volatility.
reveals that the
correlation of
price volatility
and dividend
yield
is very
important
when compare
to other
variables.
Macroeconomic factors
and stock returns:
Evidence from Taiwan.
Singh, Mehta &Varsha,
(2011).
Journal of
economics and
international
finance, 3(4), p.217.
b
This study
attempts to
examine the
casual
relationship
between
index returns
and certain
important
macroecono
mic variable
namely
employment
rate,
exchange
rate, GDP,
Inflation and
money
supply.
GDP,
inflation,
Employmen
t rate,
Exchange
rate.
The results
revealed that
exchange rate
and GDP
affects the
returns of all
portfolios,
while inflation
rate, exchange
rate, and
money supply
were having
negative
relationship
with returns
for portfolios
of big and
medium
companies.
The relationship between
earning, dividend, stock
price and stock return:
evidence from Iranian
companies. Ebrahimi &
Chadegani., (2011).
International
Conference on
Humanities, Society
and Culture (2011)
The purpose
of this paper
is to
investigate
whether the
current
period
earning
divided by
stock
Price at the
beginning of
the stock
market
period and
Stock price,
Stock
market
period.
The results
show that that
prior dividend
to
beginning stock
price ratio
affects the
stock return
and
it can be used
as an
explaining
variable for
stock
Paraphrase This Document
Need a fresh take? Get an instant paraphrase of this document with our AI Paraphraser
SUNIL YADAV
other similar
issues.
Return.
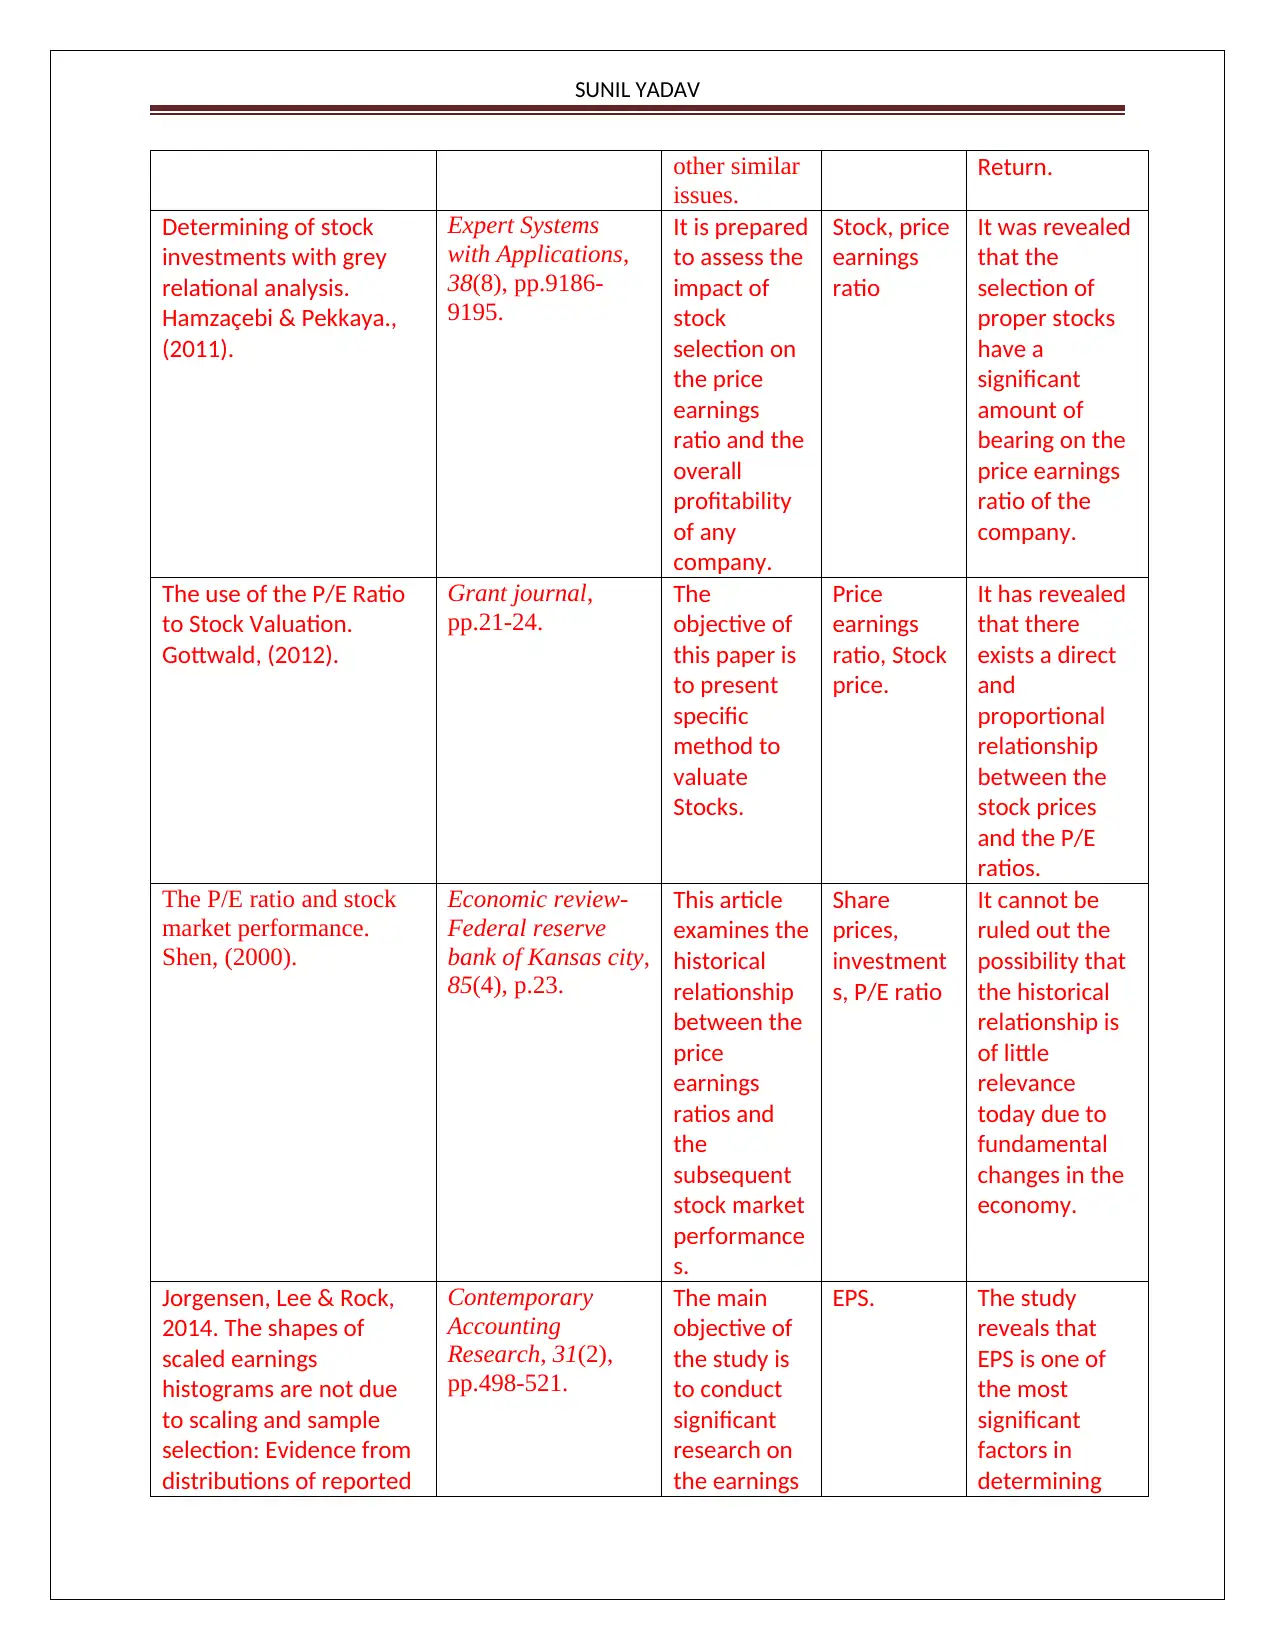
Determining of stock
investments with grey
relational analysis.
Hamzaçebi & Pekkaya.,
(2011).
Expert Systems
with Applications,
38(8), pp.9186-
9195.
It is prepared
to assess the
impact of
stock
selection on
the price
earnings
ratio and the
overall
profitability
of any
company.
Stock, price
earnings
ratio
It was revealed
that the
selection of
proper stocks
have a
significant
amount of
bearing on the
price earnings
ratio of the
company.
The use of the P/E Ratio
to Stock Valuation.
Gottwald, (2012).
Grant journal,
pp.21-24.
The
objective of
this paper is
to present
specific
method to
valuate
Stocks.
Price
earnings
ratio, Stock
price.
It has revealed
that there
exists a direct
and
proportional
relationship
between the
stock prices
and the P/E
ratios.
The P/E ratio and stock
market performance.
Shen, (2000).
Economic review-
Federal reserve
bank of Kansas city,
85(4), p.23.
This article
examines the
historical
relationship
between the
price
earnings
ratios and
the
subsequent
stock market
performance
s.
Share
prices,
investment
s, P/E ratio
It cannot be
ruled out the
possibility that
the historical
relationship is
of little
relevance
today due to
fundamental
changes in the
economy.
Jorgensen, Lee & Rock,
2014. The shapes of
scaled earnings
histograms are not due
to scaling and sample
selection: Evidence from
distributions of reported
Contemporary
Accounting
Research, 31(2),
pp.498-521.
The main
objective of
the study is
to conduct
significant
research on
the earnings
EPS. The study
reveals that
EPS is one of
the most
significant
factors in
determining
other similar
issues.
Return.
Determining of stock
investments with grey
relational analysis.
Hamzaçebi & Pekkaya.,
(2011).
Expert Systems
with Applications,
38(8), pp.9186-
9195.
It is prepared
to assess the
impact of
stock
selection on
the price
earnings
ratio and the
overall
profitability
of any
company.
Stock, price
earnings
ratio
It was revealed
that the
selection of
proper stocks
have a
significant
amount of
bearing on the
price earnings
ratio of the
company.
The use of the P/E Ratio
to Stock Valuation.
Gottwald, (2012).
Grant journal,
pp.21-24.
The
objective of
this paper is
to present
specific
method to
valuate
Stocks.
Price
earnings
ratio, Stock
price.
It has revealed
that there
exists a direct
and
proportional
relationship
between the
stock prices
and the P/E
ratios.
The P/E ratio and stock
market performance.
Shen, (2000).
Economic review-
Federal reserve
bank of Kansas city,
85(4), p.23.
This article
examines the
historical
relationship
between the
price
earnings
ratios and
the
subsequent
stock market
performance
s.
Share
prices,
investment
s, P/E ratio
It cannot be
ruled out the
possibility that
the historical
relationship is
of little
relevance
today due to
fundamental
changes in the
economy.
Jorgensen, Lee & Rock,
2014. The shapes of
scaled earnings
histograms are not due
to scaling and sample
selection: Evidence from
distributions of reported
Contemporary
Accounting
Research, 31(2),
pp.498-521.
The main
objective of
the study is
to conduct
significant
research on
the earnings
EPS. The study
reveals that
EPS is one of
the most
significant
factors in
determining
SUNIL YADAV
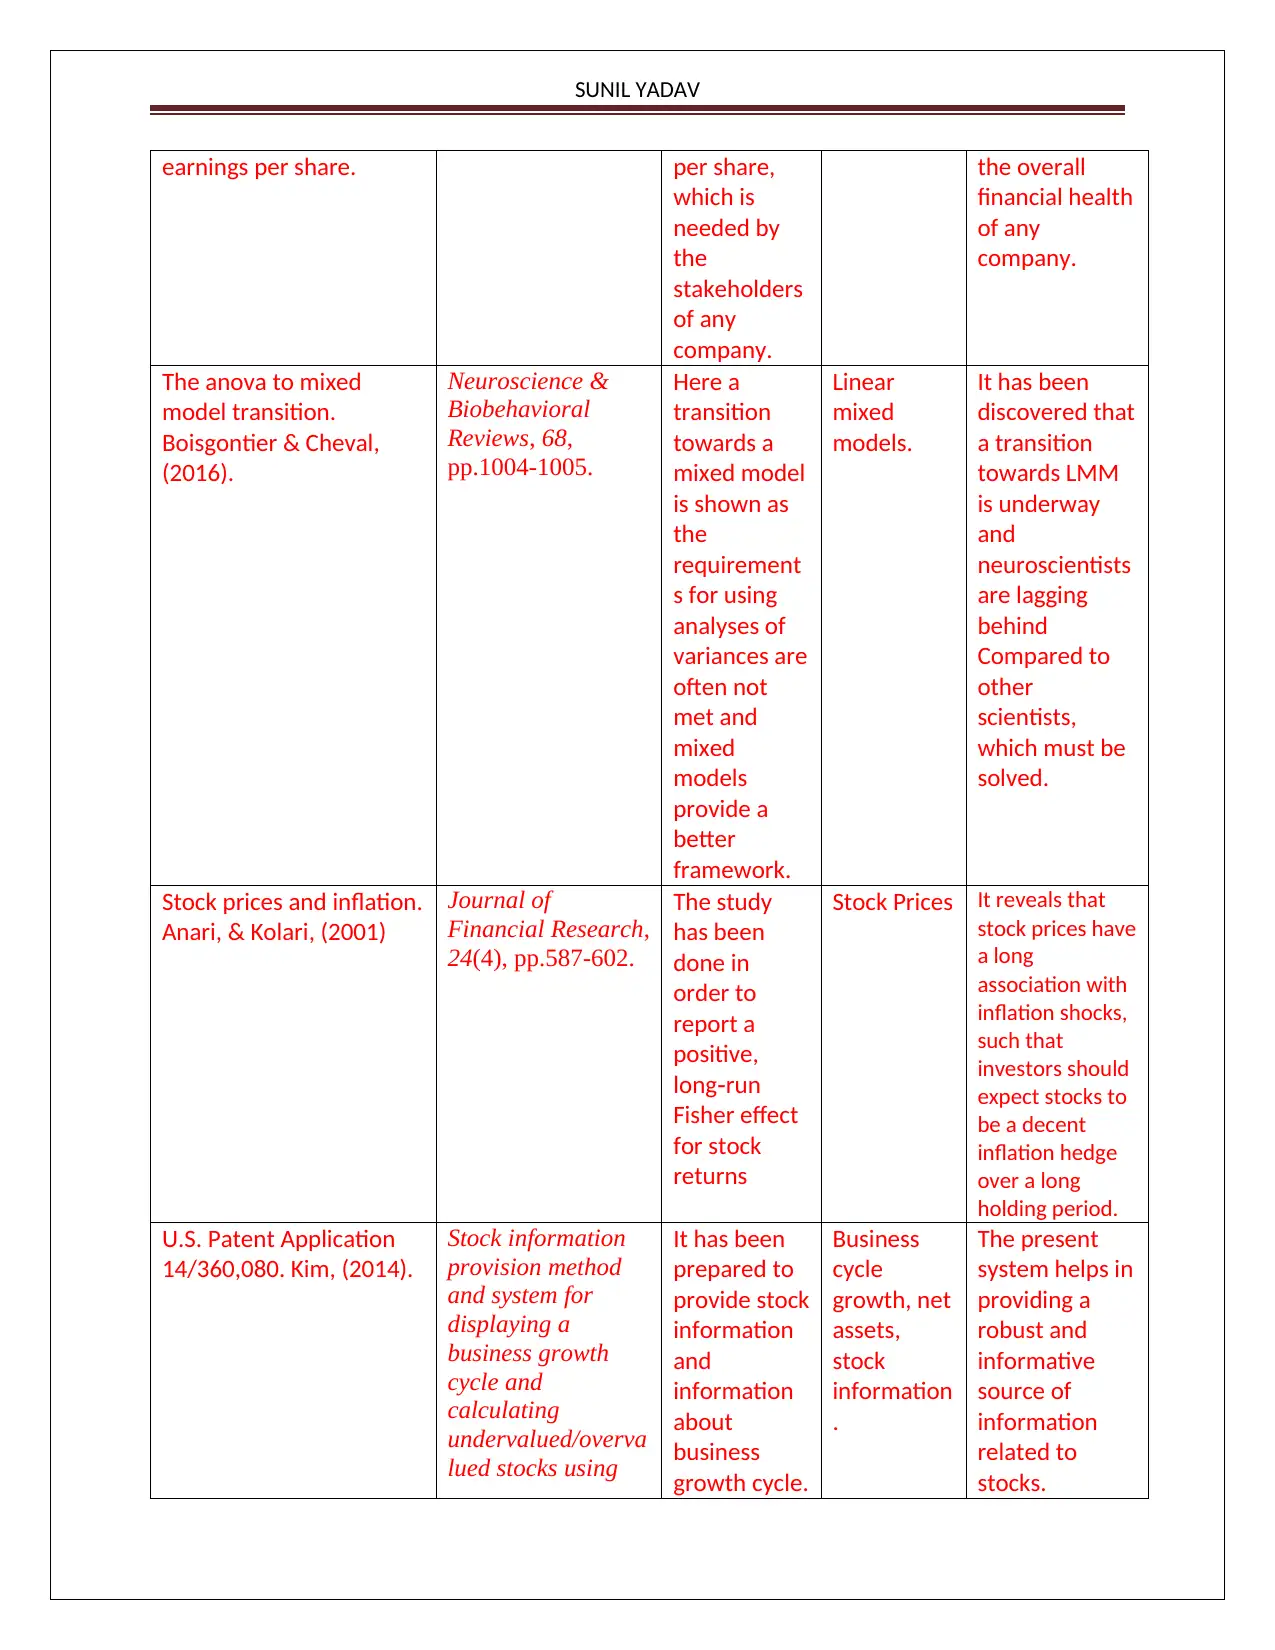
earnings per share. per share,
which is
needed by
the
stakeholders
of any
company.
the overall
financial health
of any
company.
The anova to mixed
model transition.
Boisgontier & Cheval,
(2016).
Neuroscience &
Biobehavioral
Reviews, 68,
pp.1004-1005.
Here a
transition
towards a
mixed model
is shown as
the
requirement
s for using
analyses of
variances are
often not
met and
mixed
models
provide a
better
framework.
Linear
mixed
models.
It has been
discovered that
a transition
towards LMM
is underway
and
neuroscientists
are lagging
behind
Compared to
other
scientists,
which must be
solved.
Stock prices and inflation.
Anari, & Kolari, (2001)
Journal of
Financial Research,
24(4), pp.587-602.
The study
has been
done in
order to
report a
positive,
long run‐
Fisher effect
for stock
returns
Stock Prices It reveals that
stock prices have
a long
association with
inflation shocks,
such that
investors should
expect stocks to
be a decent
inflation hedge
over a long
holding period.
U.S. Patent Application
14/360,080. Kim, (2014).
Stock information
provision method
and system for
displaying a
business growth
cycle and
calculating
undervalued/overva
lued stocks using
It has been
prepared to
provide stock
information
and
information
about
business
growth cycle.
Business
cycle
growth, net
assets,
stock
information
.
The present
system helps in
providing a
robust and
informative
source of
information
related to
stocks.
⊘ This is a preview!⊘
Do you want full access?
Subscribe today to unlock all pages.
Trusted by 1+ million students worldwide
1 out of 16
Related Documents


Your All-in-One AI-Powered Toolkit for Academic Success.
+13062052269
info@desklib.com
Available 24*7 on WhatsApp / Email
![[object Object]](/_next/static/media/star-bottom.7253800d.svg)
Unlock your academic potential
Copyright © 2020–2026 A2Z Services. All Rights Reserved. Developed and managed by ZUCOL.