ECON20039 Term 3 Essay: Price Elasticity of Demand and Oligopoly
VerifiedAdded on 2022/08/31
|19
|4508
|21
Essay
AI Summary
This essay, prepared for the Economics for Managers course (ECON20039), delves into the concepts of price elasticity of demand and oligopoly market structures. It begins by defining price elasticity, differentiating between elastic and inelastic demand, and illustrating these concepts with relevant graphs. The essay then explores the importance of price elasticity for producers, examining how it influences pricing strategies and profit maximization. The second part of the essay focuses on oligopoly markets, detailing their characteristics, including interdependence, fixed prices, and the strategic behavior of firms. It analyzes the oligopoly structure within the car industry, considering market share, barriers to entry, and non-price competition strategies such as advertising and product differentiation. The essay incorporates examples and economic journal estimates to support its analysis, providing a comprehensive overview of these key economic principles.
Running head: ECONOMICS FOR MANAGER
ECONOMICS FOR MANAGER
Name of the Student
Name of the University
Author Note
ECONOMICS FOR MANAGER
Name of the Student
Name of the University
Author Note
Paraphrase This Document
Need a fresh take? Get an instant paraphrase of this document with our AI Paraphraser

1
ECONOMICS FOR MANAGER
Table of Contents
Answer to question (a)...............................................................................................................2
Answer to question (b)...............................................................................................................6
Answer to question (c)...............................................................................................................9
References................................................................................................................................14
2
ECONOMICS FOR MANAGER
Answer to question (a)
According to the general law of demand, if the commodity price increases as its
demand decreases or vice versa keeping all other factor constant (ceterius paribus). The
magnitude of demand changes due to change in per unit price is called price elasticity of
demand. If there is a change of percentage in demand is greater than the percentage change in
price, the product is known to be elastic, whereas if there is change in the percentage of
demand is less than the percentage change in price then the product is known as inelastic.
Price elasticity of demand (Ep) = % change in demand / % change in price.
If the elasticity is more than one the product is said to be elastic and if the value is less than
one the product is inelastic.
Types of elasticity of demand are as follows:
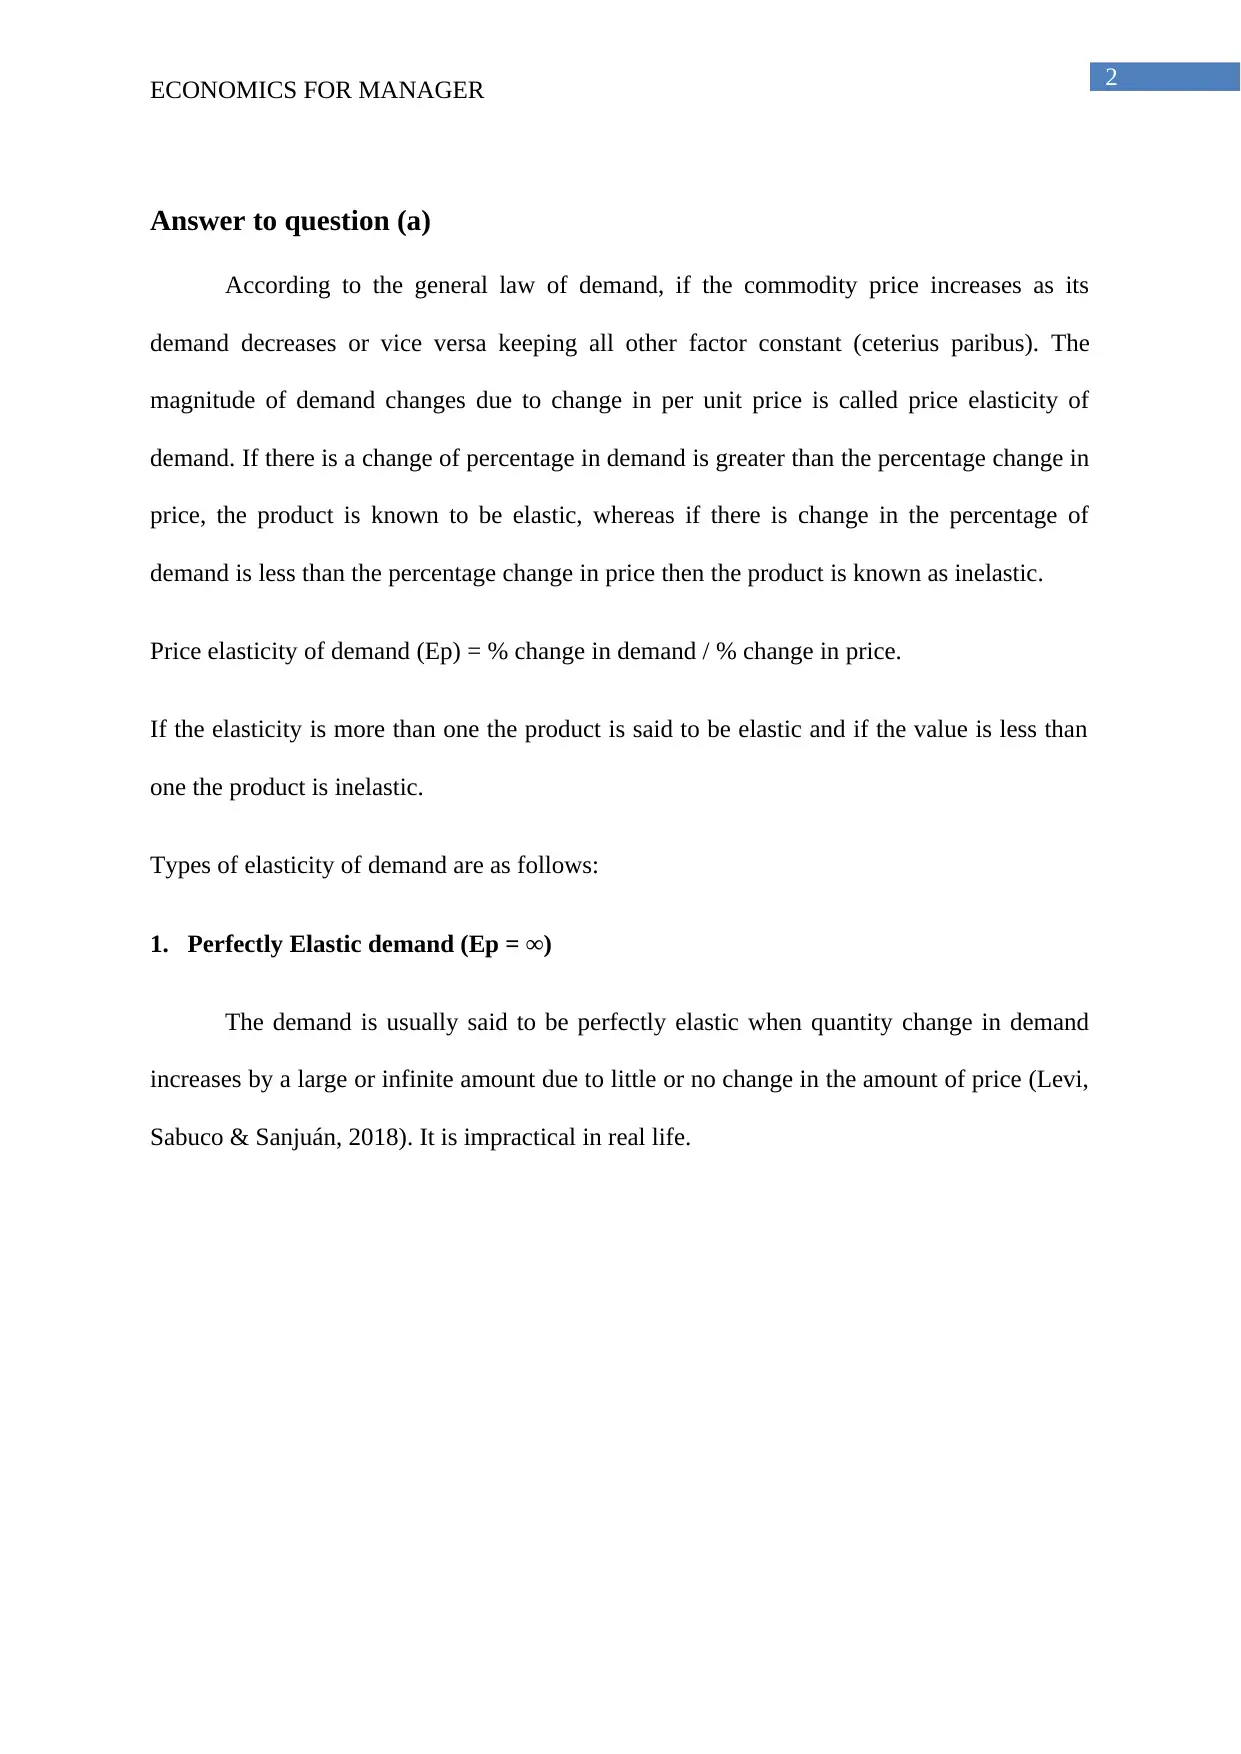
1. Perfectly Elastic demand (Ep = ∞)
The demand is usually said to be perfectly elastic when quantity change in demand
increases by a large or infinite amount due to little or no change in the amount of price (Levi,
Sabuco & Sanjuán, 2018). It is impractical in real life.
ECONOMICS FOR MANAGER
Answer to question (a)
According to the general law of demand, if the commodity price increases as its
demand decreases or vice versa keeping all other factor constant (ceterius paribus). The
magnitude of demand changes due to change in per unit price is called price elasticity of
demand. If there is a change of percentage in demand is greater than the percentage change in
price, the product is known to be elastic, whereas if there is change in the percentage of
demand is less than the percentage change in price then the product is known as inelastic.
Price elasticity of demand (Ep) = % change in demand / % change in price.
If the elasticity is more than one the product is said to be elastic and if the value is less than
one the product is inelastic.
Types of elasticity of demand are as follows:
1. Perfectly Elastic demand (Ep = ∞)
The demand is usually said to be perfectly elastic when quantity change in demand
increases by a large or infinite amount due to little or no change in the amount of price (Levi,
Sabuco & Sanjuán, 2018). It is impractical in real life.
⊘ This is a preview!⊘
Do you want full access?
Subscribe today to unlock all pages.
Trusted by 1+ million students worldwide
3
ECONOMICS FOR MANAGER
Figure: Perfectly elastic demand
In the above figure, D is the demand line, Y-axis measures the price and X-axis
measures the quantity demanded (Mpakaniye & Paul, 2016). Thus, it can be seen that the
demand of the commodity increases with no change in the price of the commodity.
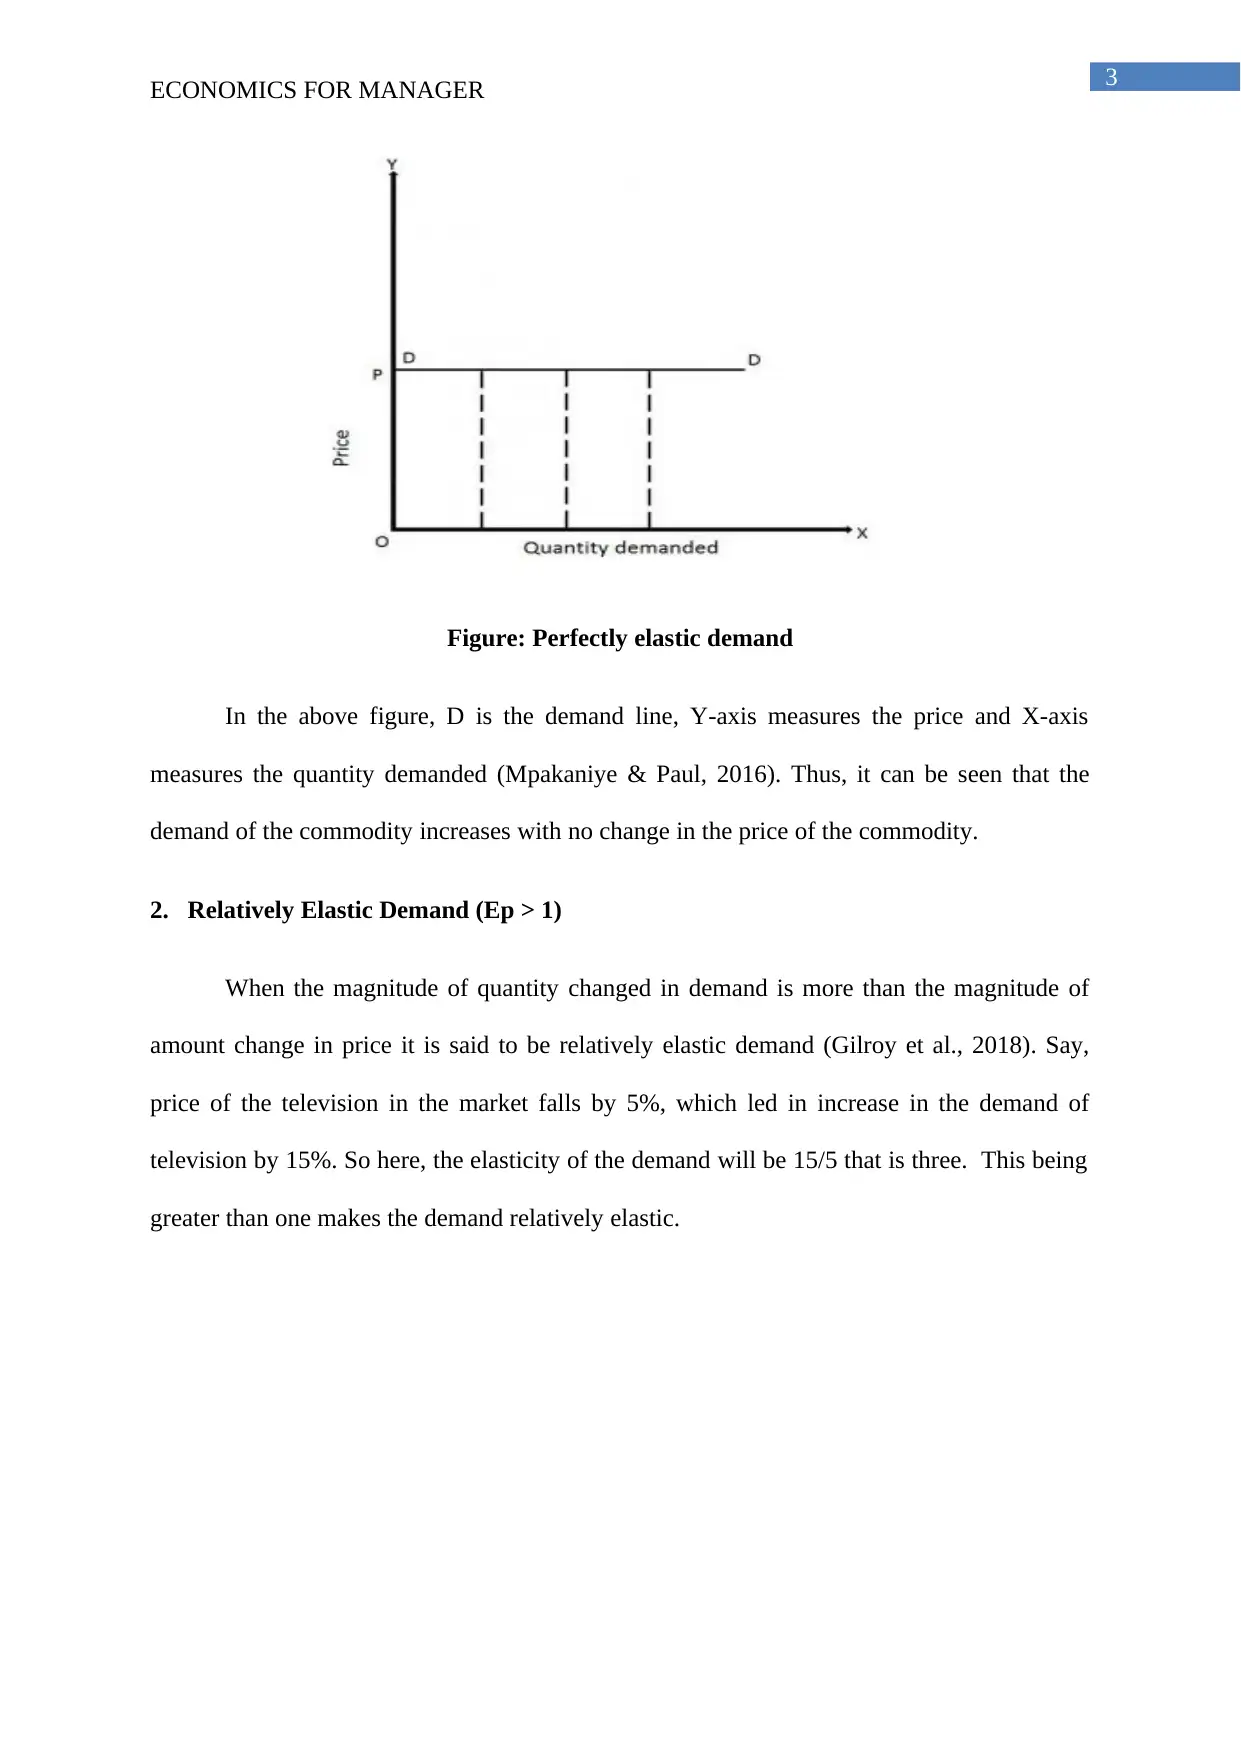
2. Relatively Elastic Demand (Ep > 1)
When the magnitude of quantity changed in demand is more than the magnitude of
amount change in price it is said to be relatively elastic demand (Gilroy et al., 2018). Say,
price of the television in the market falls by 5%, which led in increase in the demand of
television by 15%. So here, the elasticity of the demand will be 15/5 that is three. This being
greater than one makes the demand relatively elastic.
ECONOMICS FOR MANAGER
Figure: Perfectly elastic demand
In the above figure, D is the demand line, Y-axis measures the price and X-axis
measures the quantity demanded (Mpakaniye & Paul, 2016). Thus, it can be seen that the
demand of the commodity increases with no change in the price of the commodity.
2. Relatively Elastic Demand (Ep > 1)
When the magnitude of quantity changed in demand is more than the magnitude of
amount change in price it is said to be relatively elastic demand (Gilroy et al., 2018). Say,
price of the television in the market falls by 5%, which led in increase in the demand of
television by 15%. So here, the elasticity of the demand will be 15/5 that is three. This being
greater than one makes the demand relatively elastic.
Paraphrase This Document
Need a fresh take? Get an instant paraphrase of this document with our AI Paraphraser
4
ECONOMICS FOR MANAGER
Figure: Relatively elastic demand
In the above figure, Y-axis measures price and X-axis measures quantity demanded D
is the demand line. A decrease in price from P to P1, results in increases in the quantity
demanded from M to M1. It can be clearly inferred from the figure increase in quantity
demanded is more than the decrease in the price of the commodity (Fernandez, 2018).
Similarly, demand falls by a larger quantity with increase in the price. Luxurious goods such
as cars, gadgets are often categorized under elastic demand.
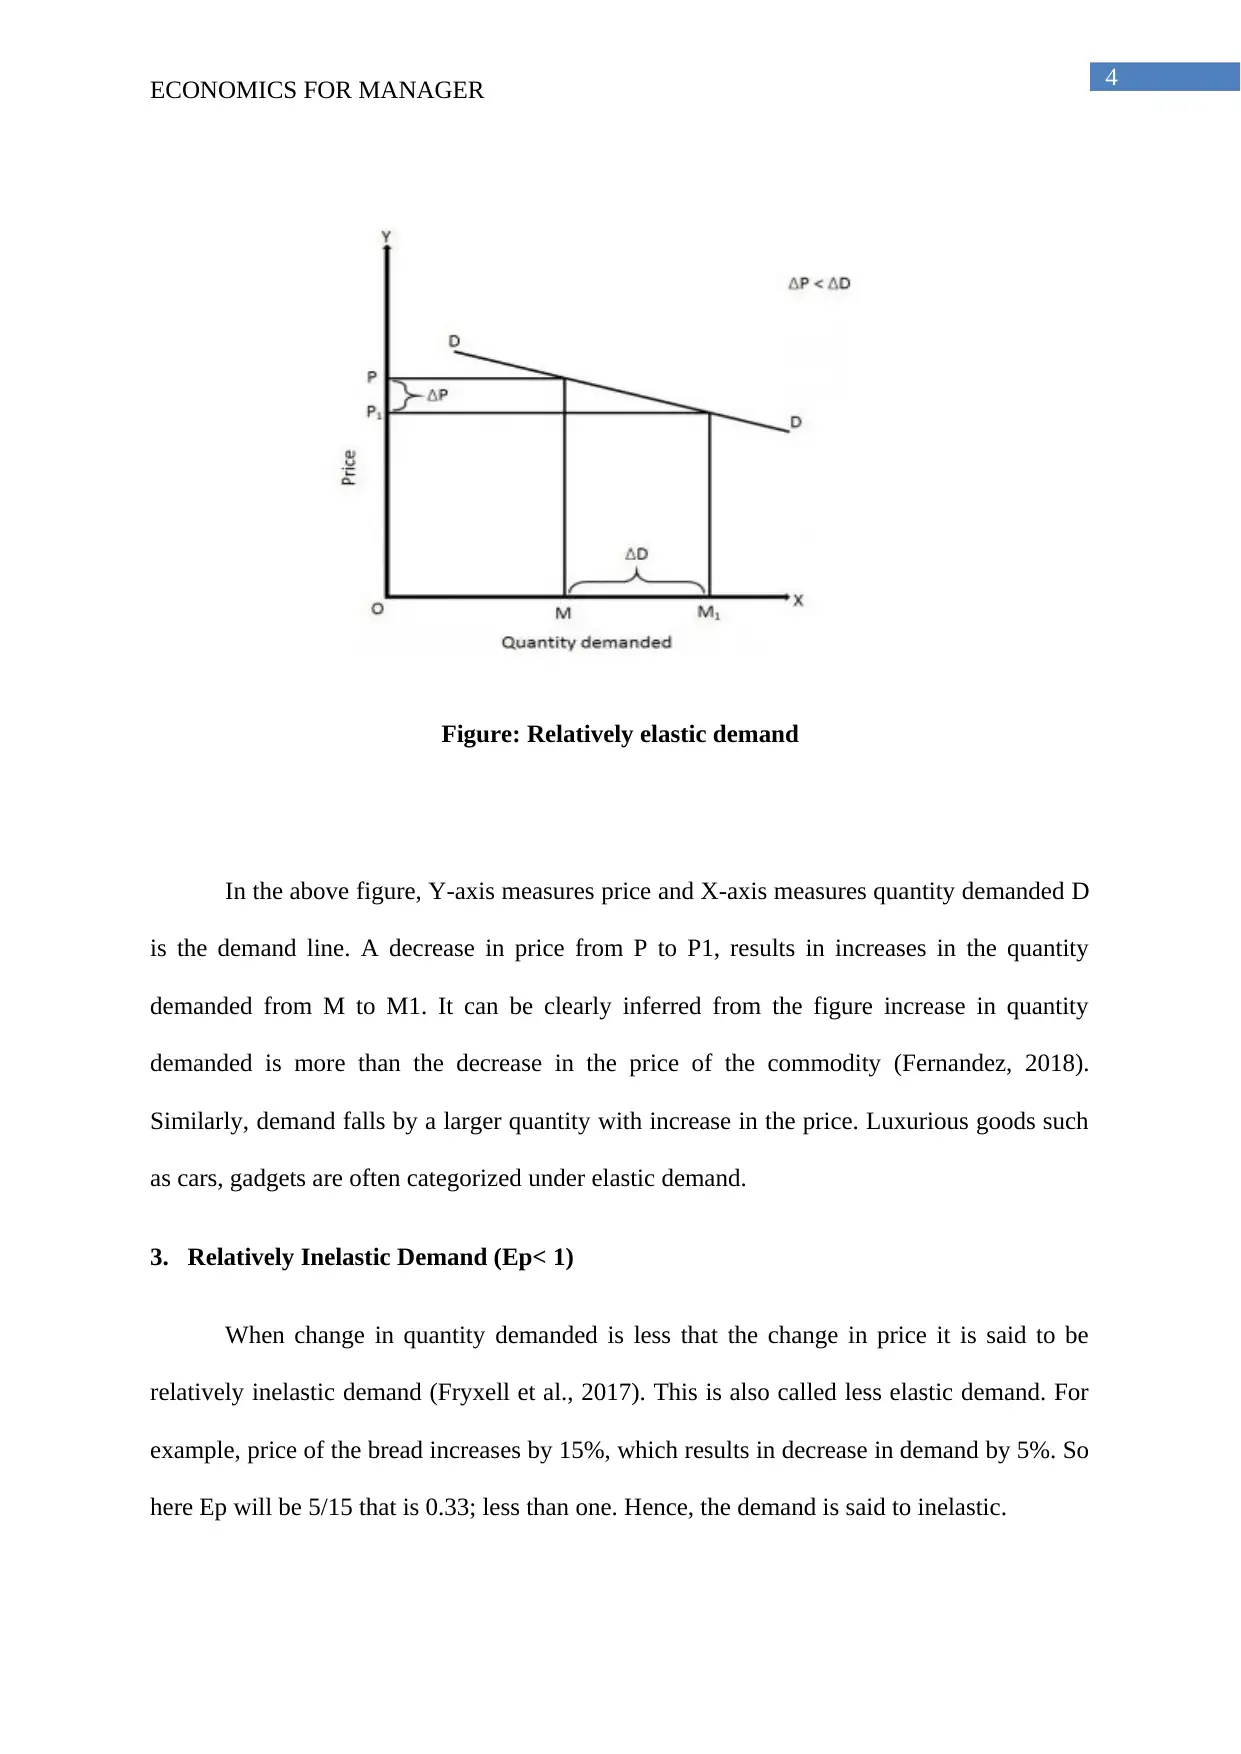
3. Relatively Inelastic Demand (Ep< 1)
When change in quantity demanded is less that the change in price it is said to be
relatively inelastic demand (Fryxell et al., 2017). This is also called less elastic demand. For
example, price of the bread increases by 15%, which results in decrease in demand by 5%. So
here Ep will be 5/15 that is 0.33; less than one. Hence, the demand is said to inelastic.
ECONOMICS FOR MANAGER
Figure: Relatively elastic demand
In the above figure, Y-axis measures price and X-axis measures quantity demanded D
is the demand line. A decrease in price from P to P1, results in increases in the quantity
demanded from M to M1. It can be clearly inferred from the figure increase in quantity
demanded is more than the decrease in the price of the commodity (Fernandez, 2018).
Similarly, demand falls by a larger quantity with increase in the price. Luxurious goods such
as cars, gadgets are often categorized under elastic demand.
3. Relatively Inelastic Demand (Ep< 1)
When change in quantity demanded is less that the change in price it is said to be
relatively inelastic demand (Fryxell et al., 2017). This is also called less elastic demand. For
example, price of the bread increases by 15%, which results in decrease in demand by 5%. So
here Ep will be 5/15 that is 0.33; less than one. Hence, the demand is said to inelastic.
5
ECONOMICS FOR MANAGER
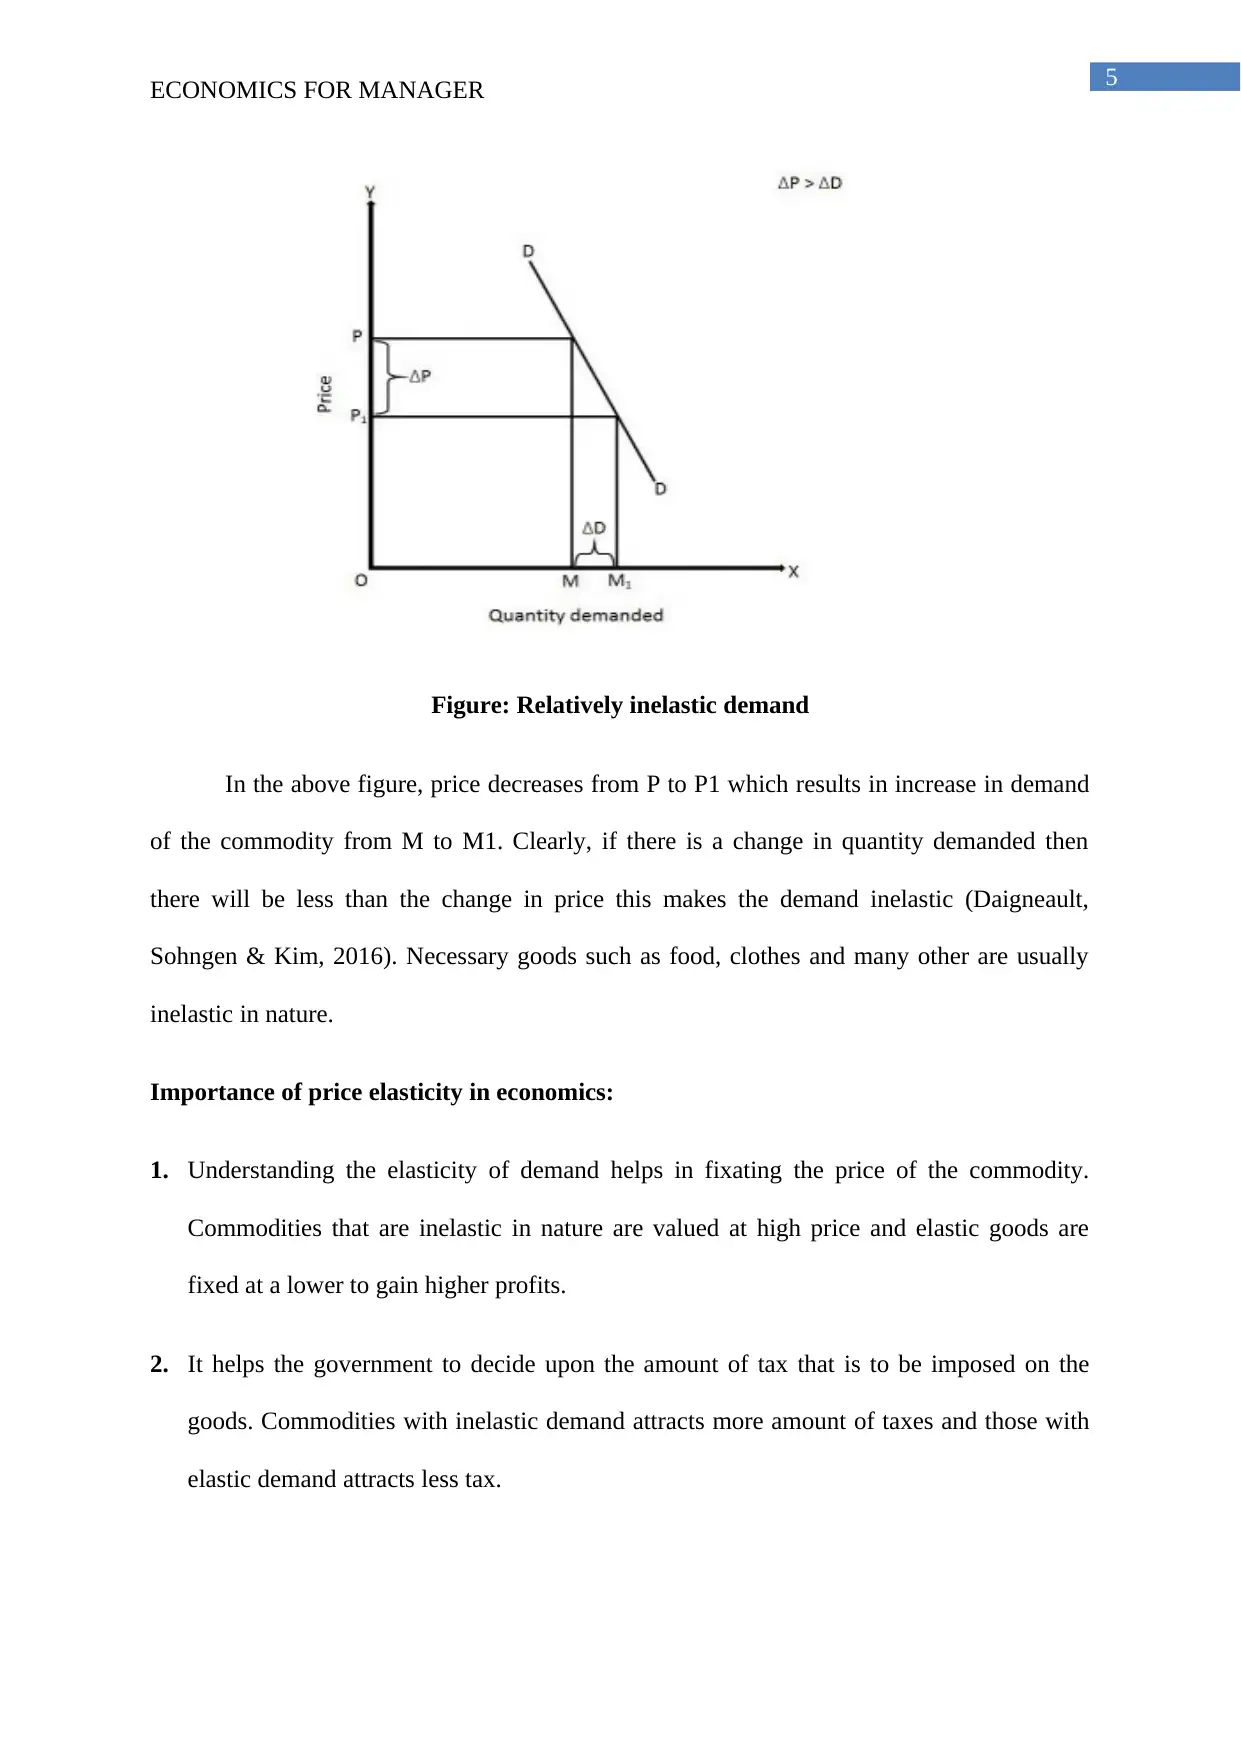
Figure: Relatively inelastic demand
In the above figure, price decreases from P to P1 which results in increase in demand
of the commodity from M to M1. Clearly, if there is a change in quantity demanded then
there will be less than the change in price this makes the demand inelastic (Daigneault,
Sohngen & Kim, 2016). Necessary goods such as food, clothes and many other are usually
inelastic in nature.
Importance of price elasticity in economics:
1. Understanding the elasticity of demand helps in fixating the price of the commodity.
Commodities that are inelastic in nature are valued at high price and elastic goods are
fixed at a lower to gain higher profits.
2. It helps the government to decide upon the amount of tax that is to be imposed on the
goods. Commodities with inelastic demand attracts more amount of taxes and those with
elastic demand attracts less tax.
ECONOMICS FOR MANAGER
Figure: Relatively inelastic demand
In the above figure, price decreases from P to P1 which results in increase in demand
of the commodity from M to M1. Clearly, if there is a change in quantity demanded then
there will be less than the change in price this makes the demand inelastic (Daigneault,
Sohngen & Kim, 2016). Necessary goods such as food, clothes and many other are usually
inelastic in nature.
Importance of price elasticity in economics:
1. Understanding the elasticity of demand helps in fixating the price of the commodity.
Commodities that are inelastic in nature are valued at high price and elastic goods are
fixed at a lower to gain higher profits.
2. It helps the government to decide upon the amount of tax that is to be imposed on the
goods. Commodities with inelastic demand attracts more amount of taxes and those with
elastic demand attracts less tax.
⊘ This is a preview!⊘
Do you want full access?
Subscribe today to unlock all pages.
Trusted by 1+ million students worldwide
6
ECONOMICS FOR MANAGER
3. Rate of change in the currency of a country sometimes depends on the elasticity of the
demand that is to be exported.
4. Knowing the demand of the product is useful in knowing the forecasted quantity.
5. The government considers the elasticity of demand at the time of subsidy and protection.
The government puts subsidy on the products that are elastic in nature to reduce foreign
competition.
The nature of a commodity decides whether it is elastic or inelastic in nature. Luxury
goods such as cars, expensive watches, perfumes are examples of elastic demand. These are
elastic in nature, as change in the price of these goods will lead to a greater change in the
demand of these products (Huang et al., 2017). Say, ford cars increase its price for ford
mustang from $1.04 lakhs to $1.10 lakhs. As it was a luxury item for many consumers, these
consumers would cut down these expenses to invest in the necessary goods. As a result, the
change in demand will fall by a greater magnitude (Hilden et al., 2018). Hence, making the
elasticity more than one. However, in case of necessary goods say, food, clothing,
transportation, medicine do not get affected much by change in price much. Say, price of the
bread increases by 2.5% many consumers who cannot afford bread at this price would still
not cut down the consumption as it is a necessary item (Miller & Alberini, 2016). As a result,
consumption of some other luxury would be reduced in order to afford bread. Hence, the
change in demand would not be as much as the change in price. Thereby, making the
elasticity of demand less than one.
An organisation’s main motive is to earn or maximise it profits. Hence, at times to
maximise the overall profit the organisation might decide to increase the price of the product
(Havranek, Irsova & Vlach, 2018). However, it should keep in mind the price elasticity of
demand while fixing the price of the commodity. If the price increases then there will be
Paraphrase This Document
Need a fresh take? Get an instant paraphrase of this document with our AI Paraphraser
7
ECONOMICS FOR MANAGER
decrease in demand and might result in overall decrease in revenue of the firm (Dissanayake,
2016). Hence, price elasticity plays a very important role in determining the price of a
commodity.
Say, a restaurant sells burger at the rate $10 and its daily sales quantity comes to 1200
per day. Now the owner decides to increase the price from $10 to $12 and the demand comes
down to 900 (Makienko, 2017). The revenue comes down to 10800 from 12000 (Revenue =
price*quantity demanded). Elasticity of demand plays a very important role in determining
the price of the commodity (Dominique, Vasconcelos & Proença, 2016). Now the restaurant
increases the price to $15 and the demand comes down to 850, the revenue here becomes
12750 hence maximising the revenue for the firm. This is how price elasticity helps an
organisation in determining the equilibrium price for the burger.
Answer to question (b)
Oligopoly market is when there are two or more firms selling the same or similar
product to many buyers. In simple words, oligopoly is when few firms are selling
homogenous products in the market (Lamantia & Radi, 2018). Some large firms selling
similar products come together in a contract where they decide not to compete via price wars
rather use other strategies such as advertising and product differentiation (Geras’kin &
Chkhartishvili, 2017). In this type of market price of the commodities remains same.
Features of an oligopoly market are as follows:
1. Interdependence - In an oligopoly structure, firms are dependent on each other at the
time of taking decisions. Firms cannot alter the price of the product without consulting
other firms in the market.
8
ECONOMICS FOR MANAGER
2. Fixed Price - Price of the product in an oligopoly structure is fixed. All the firms come
together and collectively fix the price. No firm has the power to change the price of the
independently (Dang, 2016). In this market, to maximise profits firms use other strategies
such as advertising, product differentiation.
3. Strategy - Firms in this type of market structure are very cautious of the strategy they
take, considering the response the rival firms would have to their strategy. They plan the
strategy and figure out the possible responses that the rivals may take (Alinia, Rashidian
& Naddafi, 2017). This helps them in analysing whether the strategy will reap the
expected result or not. In this market structure, the firms have either a first mover
advantage or a second mover advantage. If a firm implements the strategy first, it might
help him or it might pay him (Yang, Ng & Ni, 2017). Other competitors in the market
then observes the market reactions towards this strategy and take a decision accordingly,
hence, getting a second mover advantage.
4. Barriers to entry - Firms in an oligopoly structure decides a price, which is lower than
the average total cost (ATC) of the product. This creates a pressure on the new firms
because if they sell at the average price they would face a high competition and if they
sell at the decided price, revenue earned would be less than the price of the product.
Anyway, the new firms would end up incurring a loss.
There are two types of oligopoly market structure. One where the firms sell similar
products and other where the firm sell differentiated product. Oligopoly market where similar
products are sold is called pure oligopoly.
Oligopoly in the car industry:
⊘ This is a preview!⊘
Do you want full access?
Subscribe today to unlock all pages.
Trusted by 1+ million students worldwide
9
ECONOMICS FOR MANAGER
To understand the oligopoly structure of the car industry we need to find out the
market share of the companies in the market. In the automobile sector, more than 70 million
cars are produced and sold in the year 2018-19. Toyota the market leader in this industry
produces 9.46% of the total cars produced, followed by Volkswagen with 7.38% and ford
with 5.83% of the total production (Geras’kin & Chkhartishvili, 2017). Market leader Toyota
announces a rise it its average price by 5%. This came hard on other brands in the market.
Within two days of this announcement, Volkswagen too announces an increase in its average
price by 5.25%. Ford declared that the current average price of its cars is unsustainable and it
would soon be revising the price. The kinked demand curve is being contradicted by the
behaviour. Firms are not following the price of one particular brand. They watch the action
and strategies taken by their competitors and accordingly respond to it. This behaviour
implies that there is interdependence in the market structure. In the car industry there is high
possibility of barriers to entry and it has a sheer magnitude in the production of economies of
scale and does have an advantage upon the large organizations that are dominating are giving
advertisements.
Even though price is the key factor, the firms decide not to collude with the price, as it
might not help them in the long run. There is a use of non-price competition so that it helps in
increasing the market share of their brand such as advertising and brand differentiation.
Volkswagen uses product differentiation strategies to give itself a competitive edge in the
industry. There are many brands under Volkswagen. Some produces luxury cars some
domestic cars. This helps the brand to capture a large segment in the market. Volkswagen is
known for its diversified product in the market. It covers all the market segment be it middle
class or upper class. Similarly, Tesla, an American automotive and energy company, had a
first mover advantage by introducing self-driver cars (Matsumoto & Szidarovszky, 2017).
Advertising is another major non-price strategy used by the car industry in increasing its
Paraphrase This Document
Need a fresh take? Get an instant paraphrase of this document with our AI Paraphraser
10
ECONOMICS FOR MANAGER
market share. Ford uses advertisement to have a competitive edge in the market.
Advertisement helps the company to make its consumers aware of the product. It helps in
communicating with the consumers and introducing new features to the market. Aggressive
advertising helps in creating familiarity of the product to its targeted consumers.
Introducing new products help the industry in creating a competitive edge in the car
industry. Car industry being an oligopoly market structure cannot independently alter the
price of the product and if it does, it cannot maximise its profit from this. Hence, to enjoy a
competitive edge and capture the larger market segment these brands use the strategy of
product differentiation. Introducing new models constantly helps in capturing the larger
market share and stay alive in the competition. These at times give the manufacturers a first
mover advantage. For example, in the case of Tesla, it came up with an innovation of self-
driver cars that gave it a first mover advantage too.
Answer to question (c)
Climate change is a change of weather pattern over a period of time due to certain
factors affecting the sporadic change in climate. The factors may include a rapid increase in
global warming, decrease in the polar ice caps and many more. Climate change is a
substantial deviation from what is normal.
Natural causes of climate change- the earth surface goes through warm and cold
phases and it happened even when humans were not around. This happens because of the
sun’s intensity, volcanic eruptions and other natural causes that takes place irrespective of
human activities. However, recent research shows that the earth surface has started heating
faster which cannot be explained by natural factors alone. According to NASA, natural
11
ECONOMICS FOR MANAGER
causes are still paying the role in climate change but they are too small and too slow to
explain the rapid warming of the surface.
Anthropogenic causes of climate change- human activities such as burning coals,
deforestations, transportation and others emits gases that are harmful for the earth’s surface.
These emits greenhouse gases; it is estimated that 20% of the global emission happens due to
due to deforestation and degradations. Greenhouse gases helps in keeping the surface warm
enough to carry on inhabitant in the planet. However, in recent years these have skyrocketed
which affects the climate change adversely.
Economic consequences of climate change are as follows:
Agriculture
The sector which is most affected by the climate change is the agriculture sector.
Climate change leads to flooding or draughts, which makes the yielding of crops difficult.
According to the report of National Academy of Sciences, which was released in the year
2011, there was a rise of global thermostat for every degree Celsius, and because of that there
will be a decrease of 5 to 15 percent in overall crop production. Some crops such as rice,
wheat, soya bean, corn do not grow well above a certain threshold temperature. The scarcity
of water also affects these crops. Farmers skirmish to stay tune to these climate changes
hence resulting in a hike in the prices of these commodities for the consumers.
Infrastructure
Climate change results in natural disasters such as flooding, earthquakes, which affect
the infrastructure of the nation. These destructions will lead to higher repair costs and
maintenance hence, leading to unnecessary increase in the economic spending of the country.
It has been found from a study of 2018, there is more than 4,000 miles of the fibre optic cable
⊘ This is a preview!⊘
Do you want full access?
Subscribe today to unlock all pages.
Trusted by 1+ million students worldwide
1 out of 19
Related Documents


Your All-in-One AI-Powered Toolkit for Academic Success.
+13062052269
info@desklib.com
Available 24*7 on WhatsApp / Email
![[object Object]](/_next/static/media/star-bottom.7253800d.svg)
Unlock your academic potential
Copyright © 2020–2026 A2Z Services. All Rights Reserved. Developed and managed by ZUCOL.