Price Theory 1: Demand, Equilibrium, and Market Power Analysis
VerifiedAdded on 2020/01/07
|7
|1318
|249
Homework Assignment
AI Summary
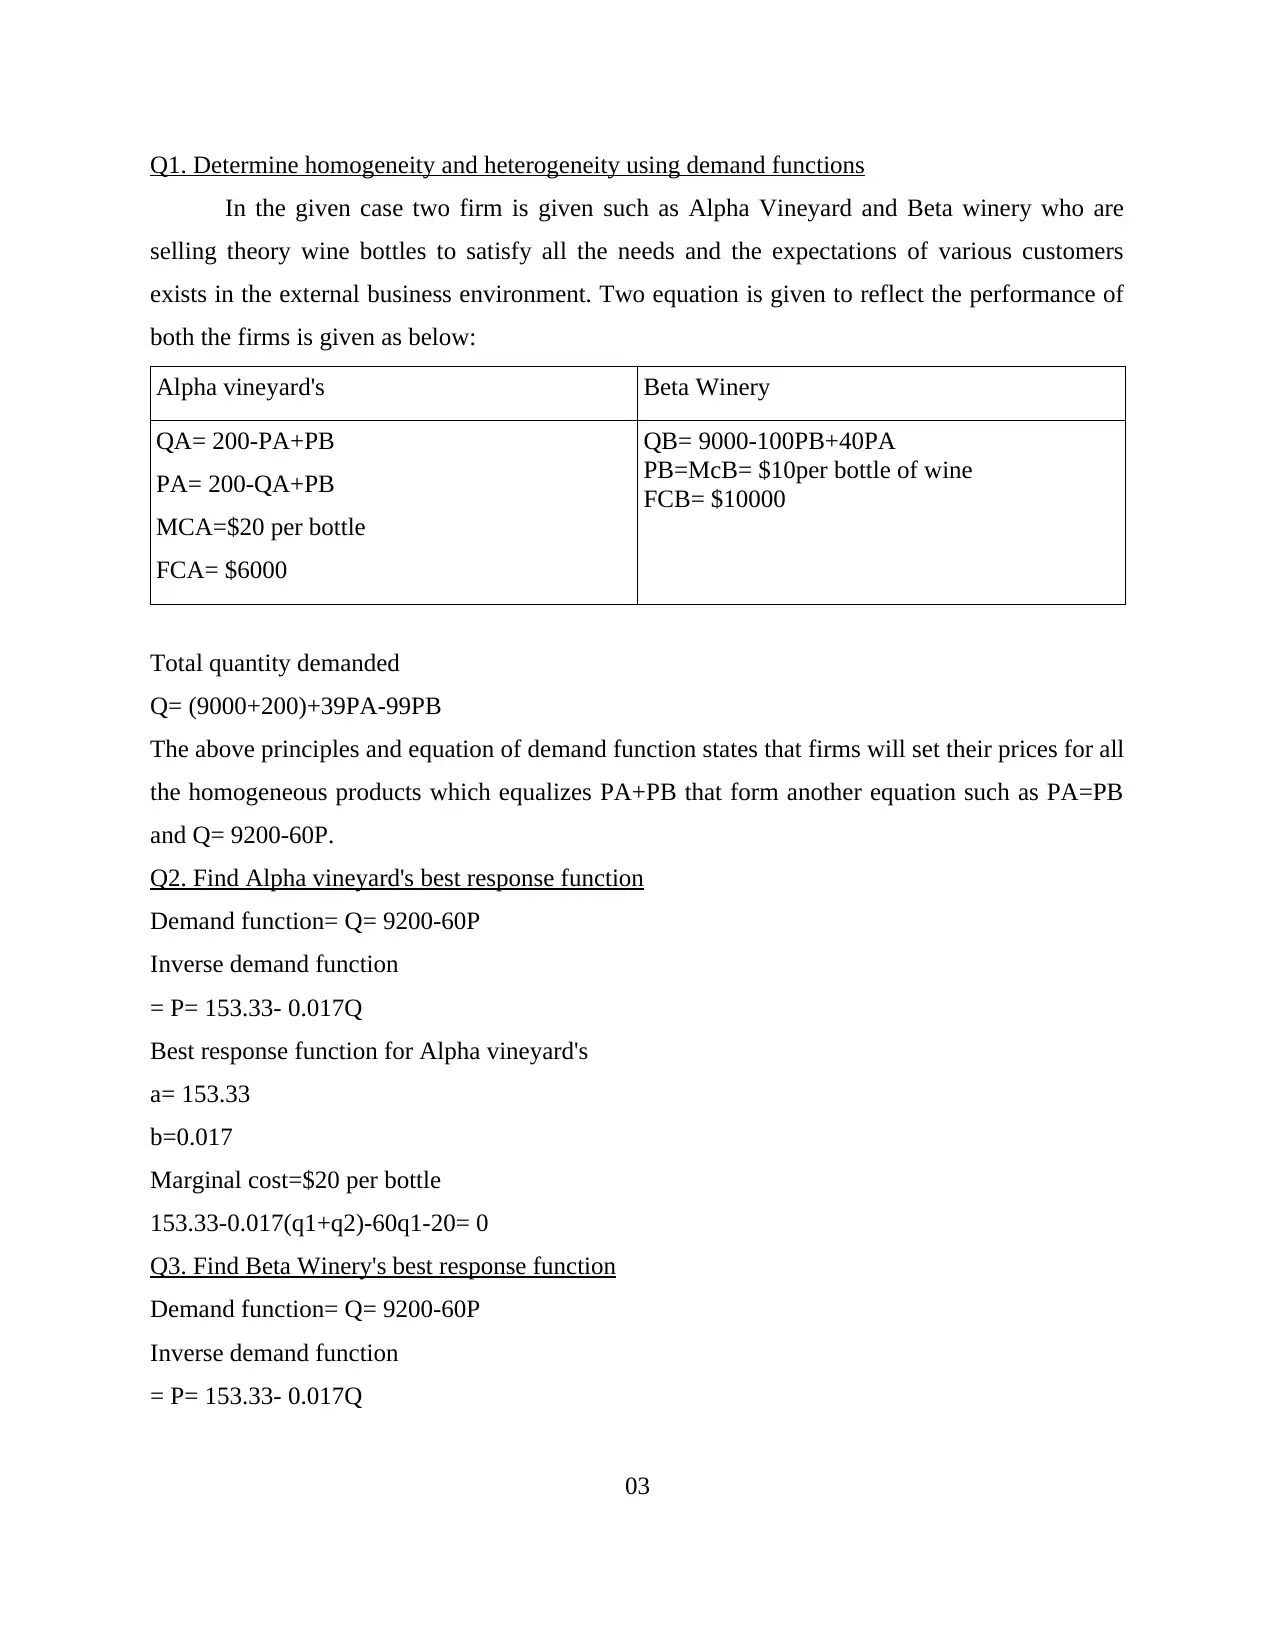
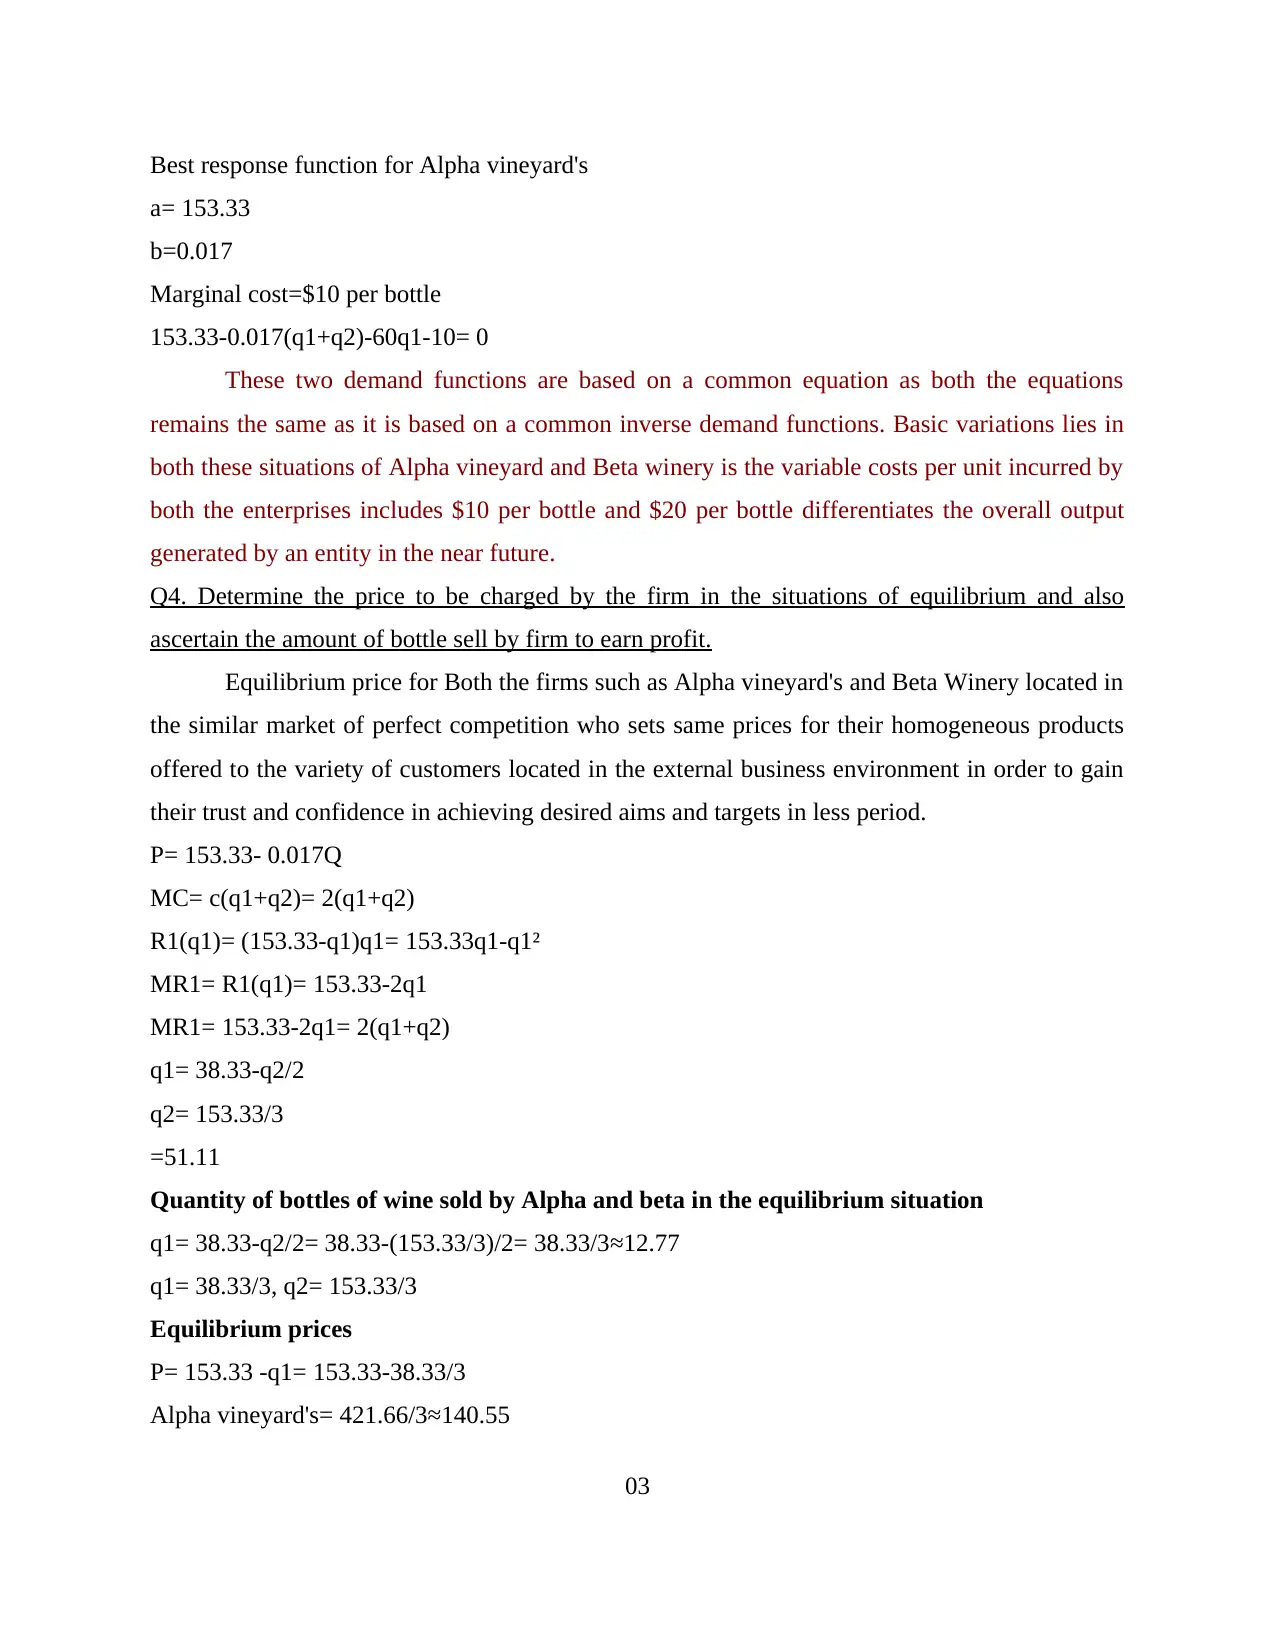
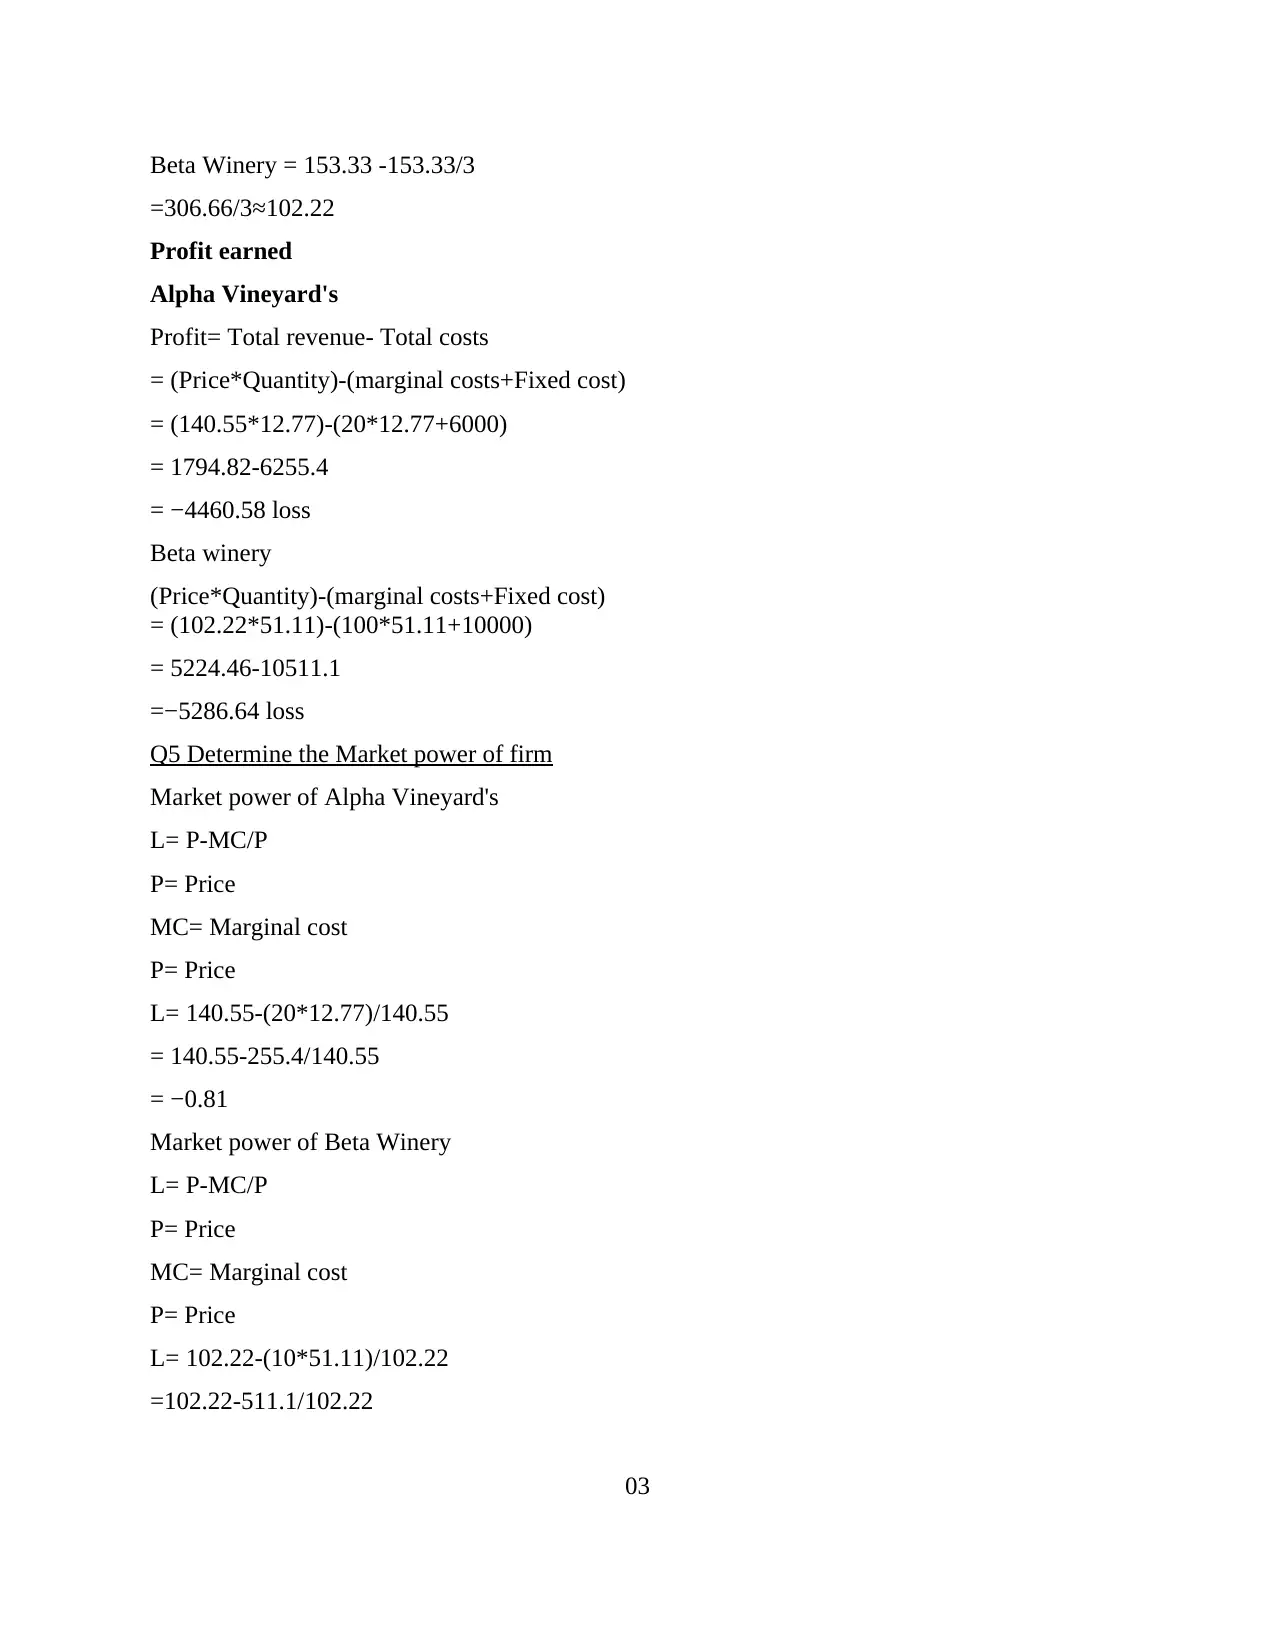
This assignment delves into price theory, analyzing the behavior of two firms, Alpha Vineyard and Beta Winery, within a competitive market. It begins by establishing demand functions for both firms, exploring concepts of homogeneity and heterogeneity. The analysis proceeds to calculate best response functions, determine equilibrium prices, and assess the quantity of wine bottles sold by each firm. The study further investigates the market power of each firm using the Lerner index and examines how changes in fixed costs impact the equilibrium. The assignment incorporates calculations of profit and loss for each firm under different scenarios and provides a comprehensive understanding of market dynamics and firm performance.

PRICE THEORY
03
03
Paraphrase This Document
Need a fresh take? Get an instant paraphrase of this document with our AI Paraphraser

Q1. Determine homogeneity and heterogeneity using demand functions
In the given case two firm is given such as Alpha Vineyard and Beta winery who are
selling theory wine bottles to satisfy all the needs and the expectations of various customers
exists in the external business environment. Two equation is given to reflect the performance of
both the firms is given as below:
Alpha vineyard's Beta Winery
QA= 200-PA+PB
PA= 200-QA+PB
MCA=$20 per bottle
FCA= $6000
QB= 9000-100PB+40PA
PB=McB= $10per bottle of wine
FCB= $10000
Total quantity demanded
Q= (9000+200)+39PA-99PB
The above principles and equation of demand function states that firms will set their prices for all
the homogeneous products which equalizes PA+PB that form another equation such as PA=PB
and Q= 9200-60P.
Q2. Find Alpha vineyard's best response function
Demand function= Q= 9200-60P
Inverse demand function
= P= 153.33- 0.017Q
Best response function for Alpha vineyard's
a= 153.33
b=0.017
Marginal cost=$20 per bottle
153.33-0.017(q1+q2)-60q1-20= 0
Q3. Find Beta Winery's best response function
Demand function= Q= 9200-60P
Inverse demand function
= P= 153.33- 0.017Q
03

Best response function for Alpha vineyard's
a= 153.33
b=0.017
Marginal cost=$10 per bottle
153.33-0.017(q1+q2)-60q1-10= 0
These two demand functions are based on a common equation as both the equations
remains the same as it is based on a common inverse demand functions. Basic variations lies in
both these situations of Alpha vineyard and Beta winery is the variable costs per unit incurred by
both the enterprises includes $10 per bottle and $20 per bottle differentiates the overall output
generated by an entity in the near future.
Q4. Determine the price to be charged by the firm in the situations of equilibrium and also
ascertain the amount of bottle sell by firm to earn profit.
Equilibrium price for Both the firms such as Alpha vineyard's and Beta Winery located in
the similar market of perfect competition who sets same prices for their homogeneous products
offered to the variety of customers located in the external business environment in order to gain
their trust and confidence in achieving desired aims and targets in less period.
P= 153.33- 0.017Q
MC= c(q1+q2)= 2(q1+q2)
R1(q1)= (153.33-q1)q1= 153.33q1-q1²
MR1= R1(q1)= 153.33-2q1
MR1= 153.33-2q1= 2(q1+q2)
q1= 38.33-q2/2
q2= 153.33/3
=51.11
Quantity of bottles of wine sold by Alpha and beta in the equilibrium situation
q1= 38.33-q2/2= 38.33-(153.33/3)/2= 38.33/3≈12.77
q1= 38.33/3, q2= 153.33/3
Equilibrium prices
P= 153.33 -q1= 153.33-38.33/3
Alpha vineyard's= 421.66/3≈140.55
03
⊘ This is a preview!⊘
Do you want full access?
Subscribe today to unlock all pages.

Trusted by 1+ million students worldwide

Beta Winery = 153.33 -153.33/3
=306.66/3≈102.22
Profit earned
Alpha Vineyard's
Profit= Total revenue- Total costs
= (Price*Quantity)-(marginal costs+Fixed cost)
= (140.55*12.77)-(20*12.77+6000)
= 1794.82-6255.4
= −4460.58 loss
Beta winery
(Price*Quantity)-(marginal costs+Fixed cost)
= (102.22*51.11)-(100*51.11+10000)
= 5224.46-10511.1
=−5286.64 loss
Q5 Determine the Market power of firm
Market power of Alpha Vineyard's
L= P-MC/P
P= Price
MC= Marginal cost
P= Price
L= 140.55-(20*12.77)/140.55
= 140.55-255.4/140.55
= −0.81
Market power of Beta Winery
L= P-MC/P
P= Price
MC= Marginal cost
P= Price
L= 102.22-(10*51.11)/102.22
=102.22-511.1/102.22
03
Paraphrase This Document
Need a fresh take? Get an instant paraphrase of this document with our AI Paraphraser

= -4
It can be seen from the results generated through all the calculations using Lerner index
as knowing the existing strength of an entity in order to attract variety of customers towards the
particular business. Market power depicts the existing skills and the capabilities applied by an
entity owner in order to generate higher market returns in order to accomplish the desired aims
and targets within a given period. P denotes the price set by an entity owner in order to attract
various customers towards all the products or services offered by an entity in satisfying all the
needs and the expectations of the external market users (Kelly, B., Pástor, Ľ. and Veronesi, P.,
2016). Higher values of Lerner index shows higher market power of an entity which will helps in
eliminating all the exiting competition in the market. The results generated from the above shows
that market power of both the entity is in negative which shows its deficiency in maintaining its
unique image in the external business environment. In comparison, to both the firms such as
Alpha and Beta which deals in the same sector of providing different wines to all the customers.
Market power of Alpha is less negative than compare to the beta winery.
Q6 How equilibrium gets changes with the increase in Fixed cost of B to $100,000
Beta winery
Fixed costs= $10000
(Price*Quantity)-(marginal costs+Fixed cost)
= (102.22*51.1)-(10*51.11+100000)
= 5224.46-(511.1+100000)
= 5224.46-100511.1
=- 95286.64
It can be said that beta winery has suffered with heavy amount of loss as revenue
generated by the business is less than compared to the costs incurred in the business. Higher
amount of costs incurred in the business as compared to sales and the revenue generated by an
entity (Telser, 2016). This shows the business performance of an entity which is suppressed due
to increasing amount of costs incurred in the business which needs to be regulate in order to earn
higher amount of profit for the betterment of the business. Cost plays an integral role in setting
up the existing business of an entity as this will cover up all the strengths of the business.
03

Illustration 1: Equilibrium
The above figure is all about explaining the existing conditions of equilibrium takes
places in the external business environment. The price will be determined by an entity when the
demand and supply of an entity will get equated as in that conditions level of profit earned by the
business is higher than compared to all other situations. Increase in the fixed costs will
automatically raise the costs in the business which in turn decreases the chances of earning
higher profit.
03
⊘ This is a preview!⊘
Do you want full access?
Subscribe today to unlock all pages.

Trusted by 1+ million students worldwide

REFERENCES
Boettke, P. J. and Candela, R. A., 2017. Price theory as prophylactic against popular fallacies.
Journal of Institutional Economics, pp.1-28.
Kelly, B., Pástor, Ľ. and Veronesi, P., 2016. The price of political uncertainty: Theory and
evidence from the option market. The Journal of Finance.
Telser, L. G., 2016. Competition, collusion and game theory. Springer.
Price, E. and Ostfeld, A., 2016. Optimal Pump Scheduling in Water Distribution Systems Using
Graph Theory under Hydraulic and Chlorine Constraints. Journal of Water Resources
Planning and Management. 142(10). p.04016037.
Ahrens, S., Pirschel, I. and Snower, D. J., 2017. A theory of price adjustment under loss aversion.
Journal of Economic Behavior & Organization. 134. pp.78-95.
Hsu, C. L., Chang, C. Y. and Yansritakul, C., 2017. Exploring purchase intention of green
skincare products using the theory of planned behavior: Testing the moderating effects of
country of origin and price sensitivity. Journal of Retailing and Consumer Services. 34.
pp.145-152.
Meczkowski, E. J. and Dillard, J. P., 2017. Fear Appeals in Strategic Communication. The
International Encyclopedia of Media Effects.
03
1 out of 7
Your All-in-One AI-Powered Toolkit for Academic Success.
+13062052269
info@desklib.com
Available 24*7 on WhatsApp / Email
Unlock your academic potential
Copyright © 2020–2026 A2Z Services. All Rights Reserved. Developed and managed by ZUCOL.
